
View by category
The third phase of the Lava Flows release brings you the bibliometric dataset for the THE World University Rankings 2027 and U.S. News Best National University Rankings 2027.
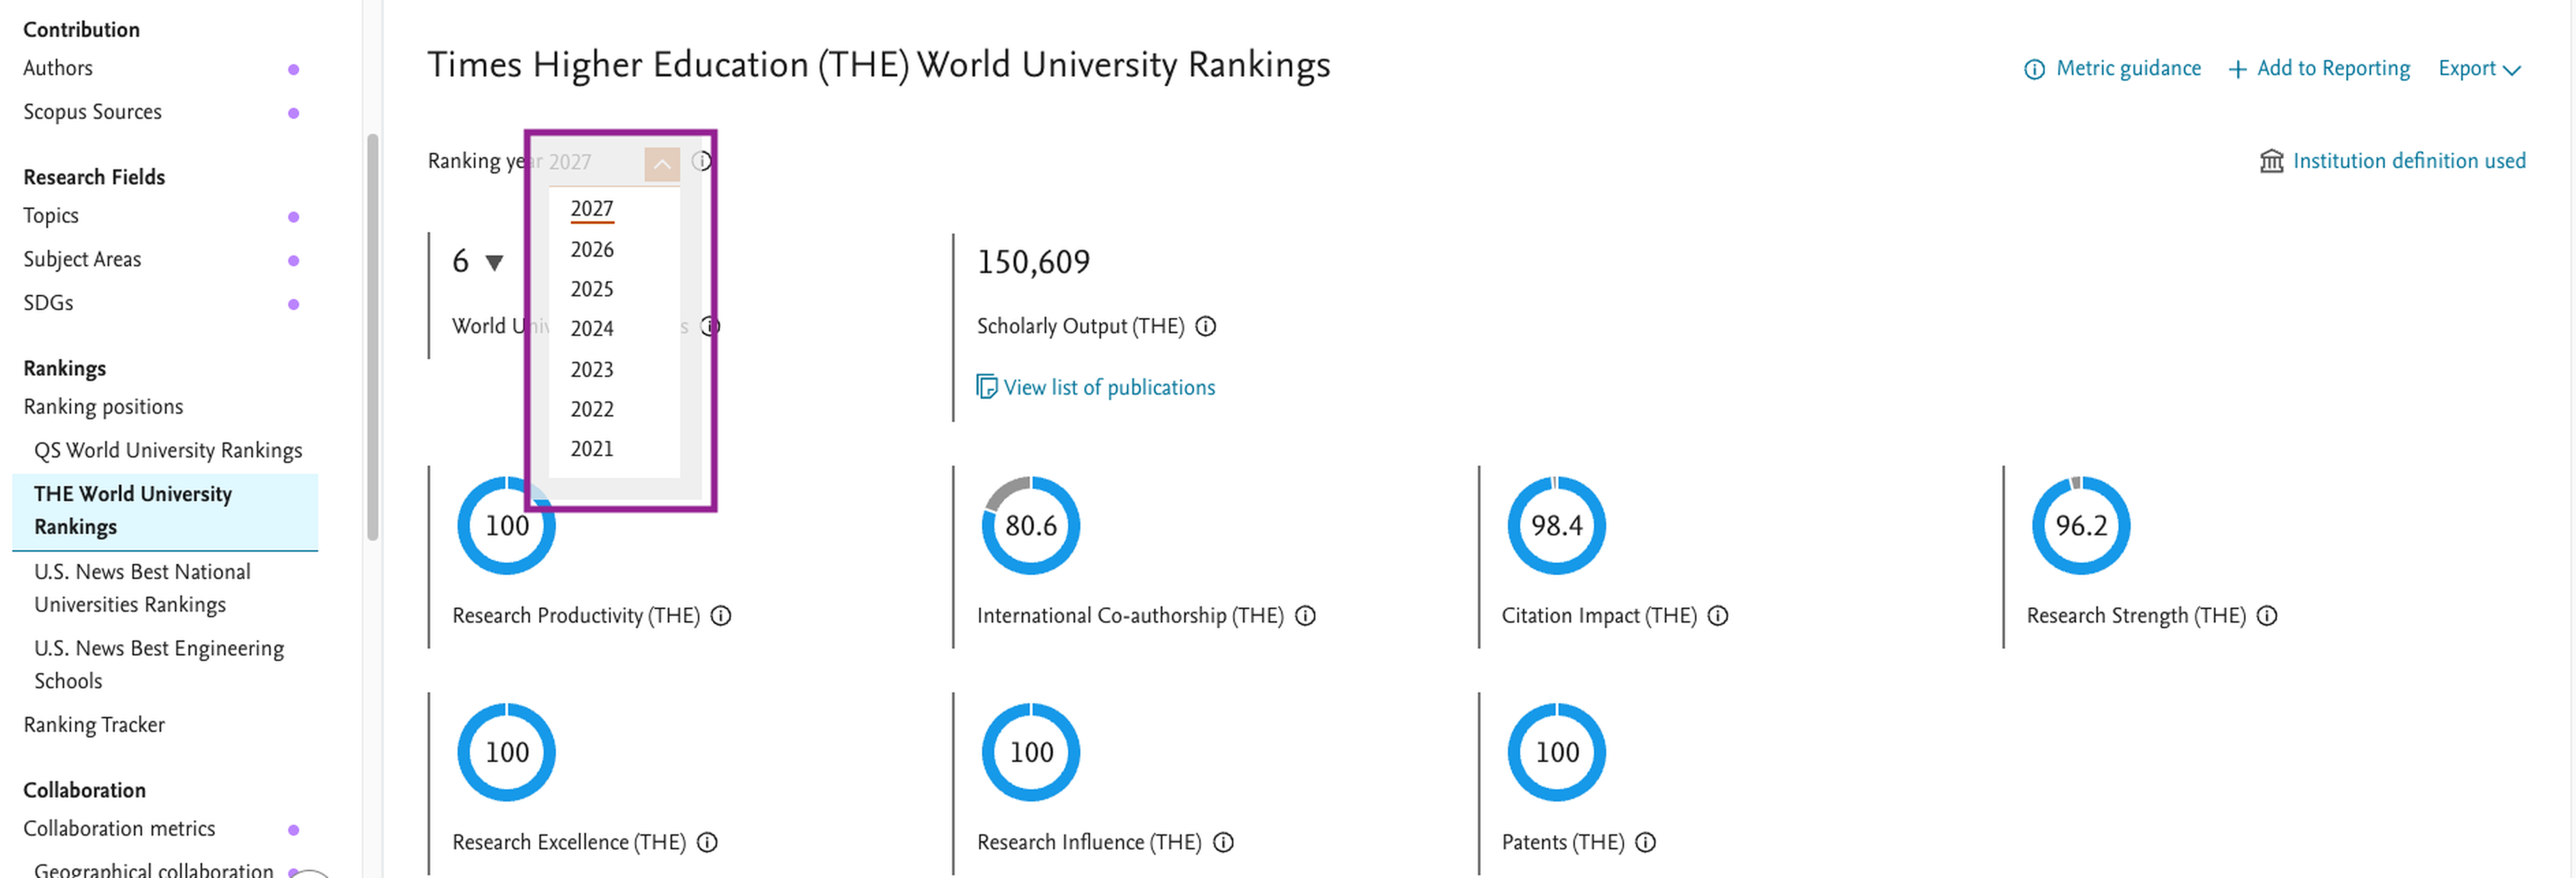
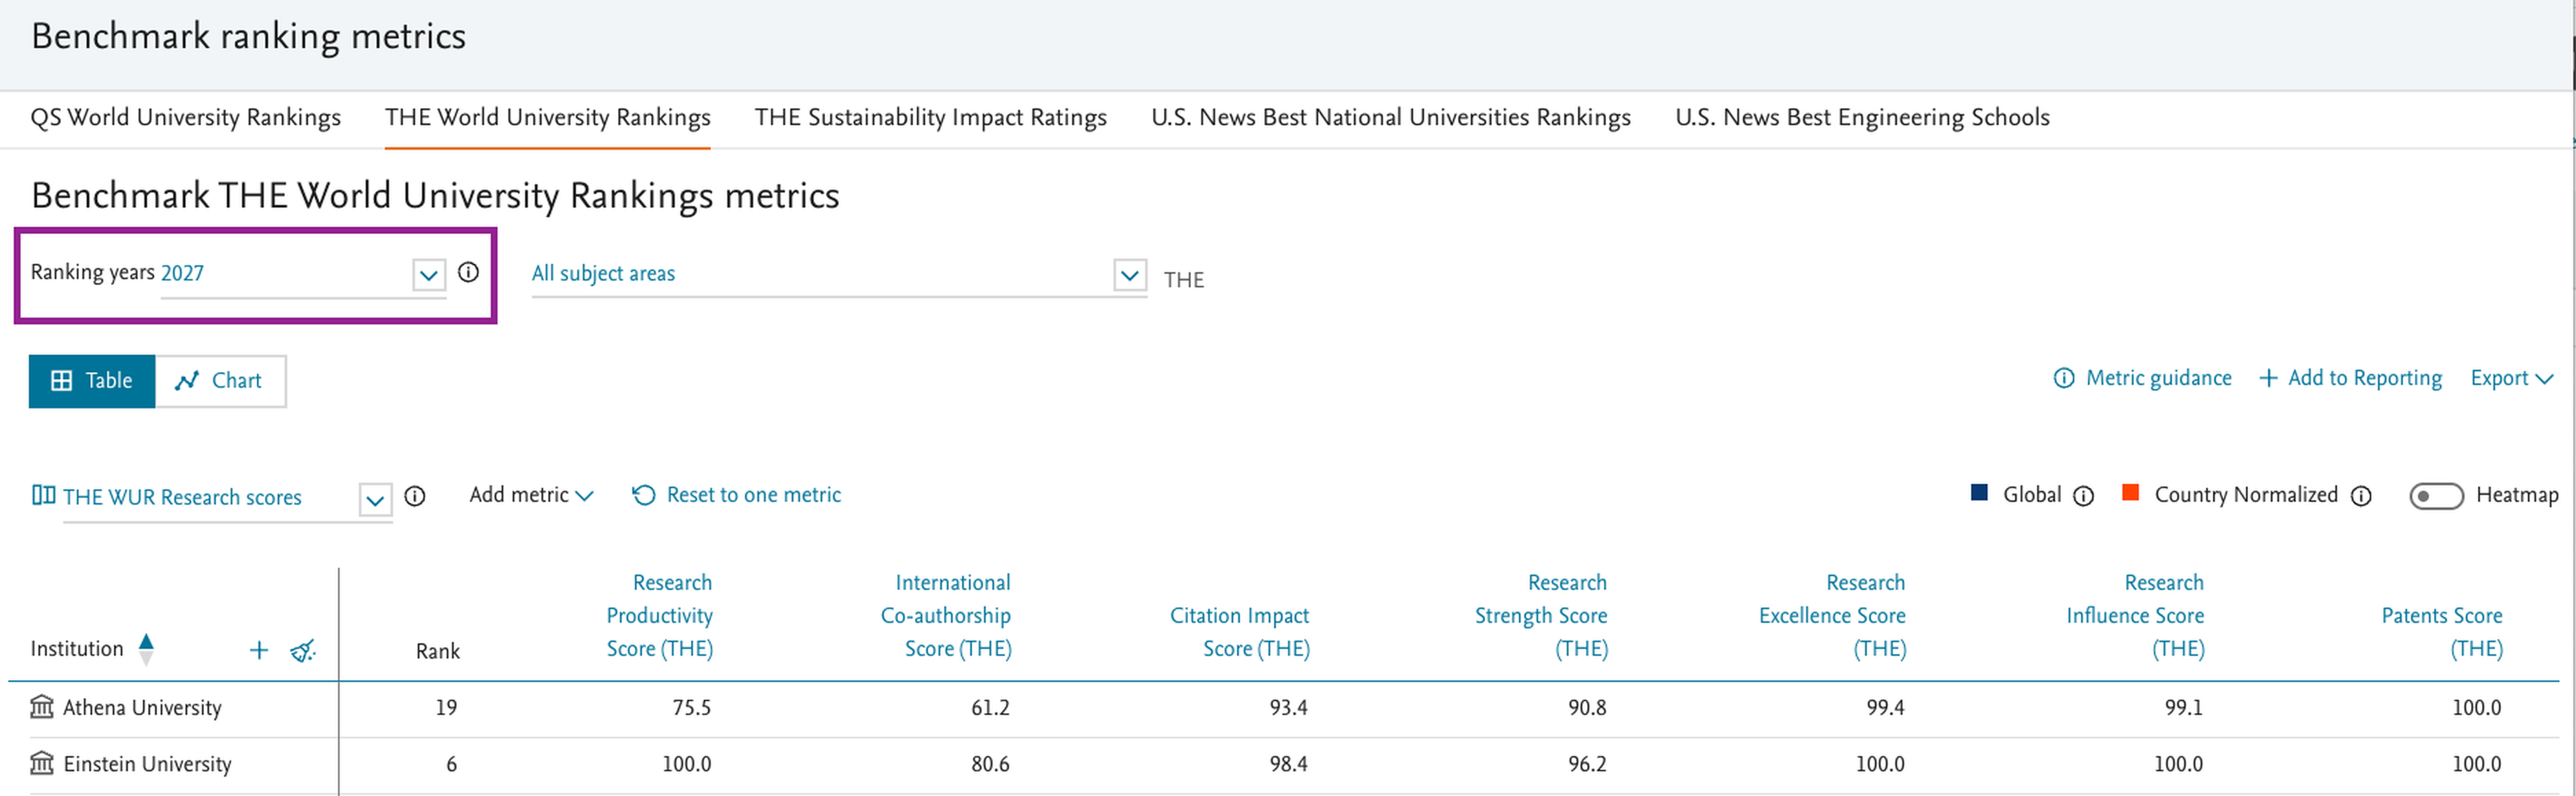
- THE World University Rankings 2027 bibliometric dataset is available for analysis and benchmarking
We are excited to provide access to the bibliometric dataset underpinning the THE World University Rankings 2027 (announced on September 30th, 2025) in SciVal. Gain insights into the bibliometric dataset underlying your institution’s rankings scores and analyze the factors that contribute to 40% of the overall ranking. Compare your performance to peer institutions in Compare across multiple ranking years (from 2021 to 2027) and easily populate the comparison table using the predefined metric sets.
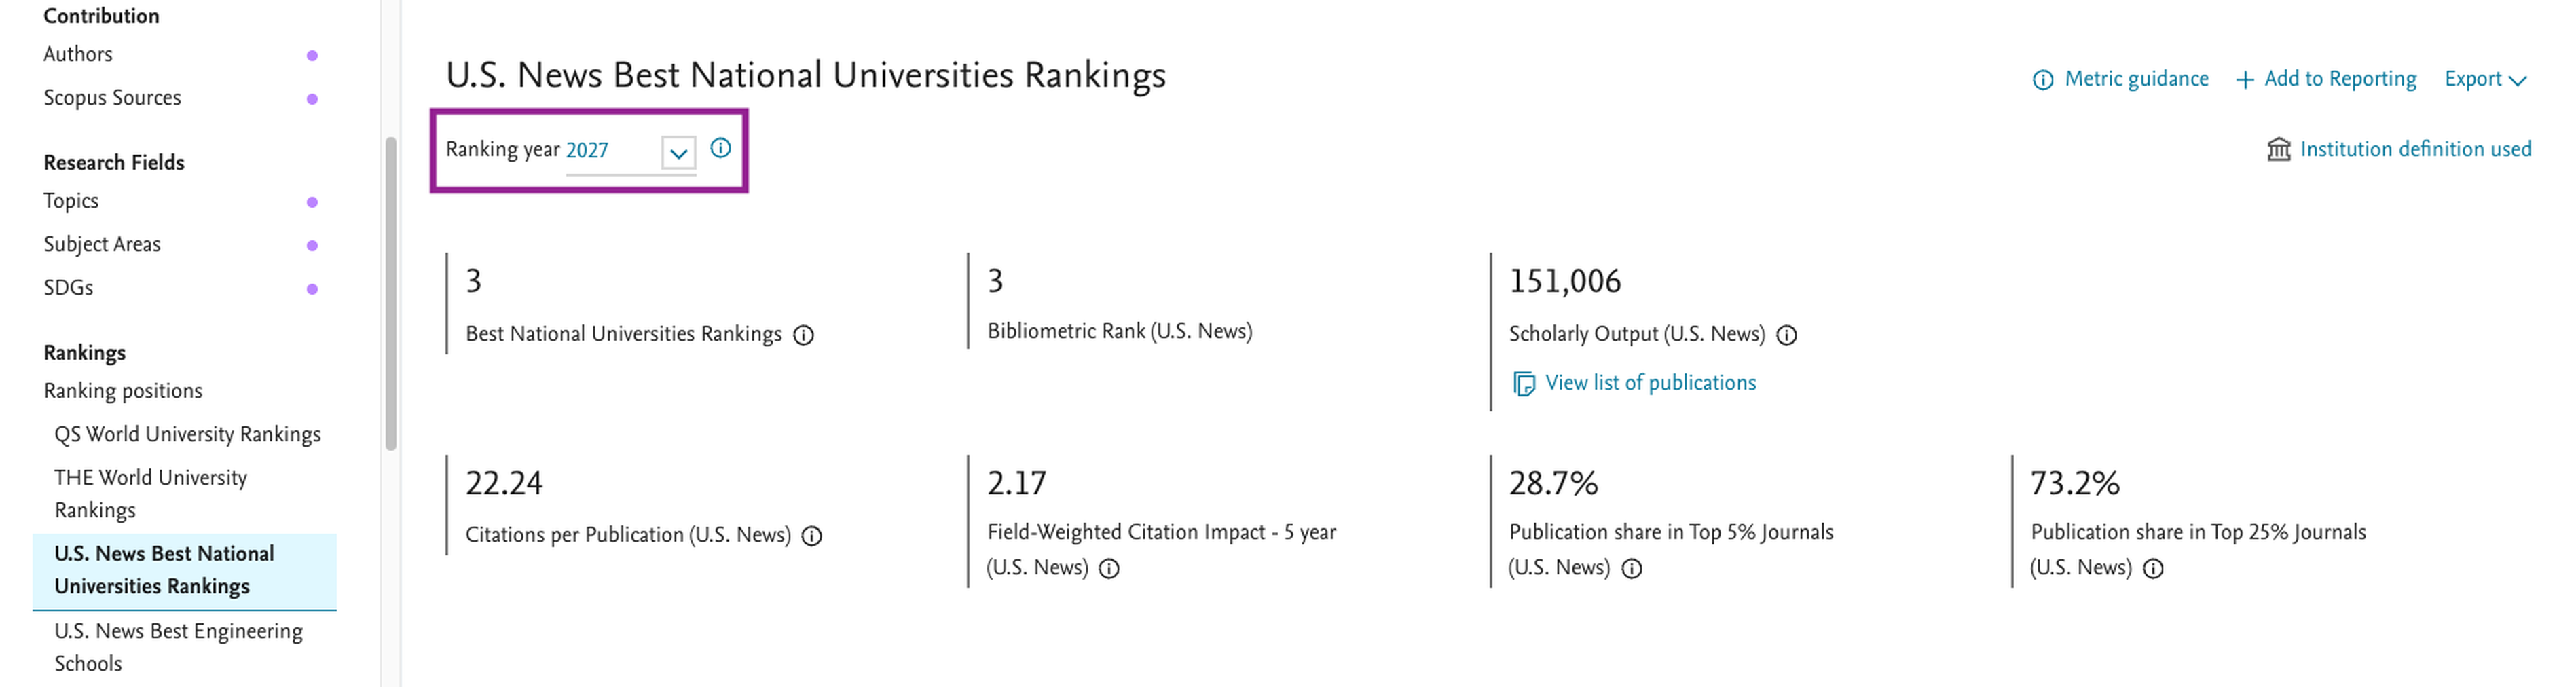
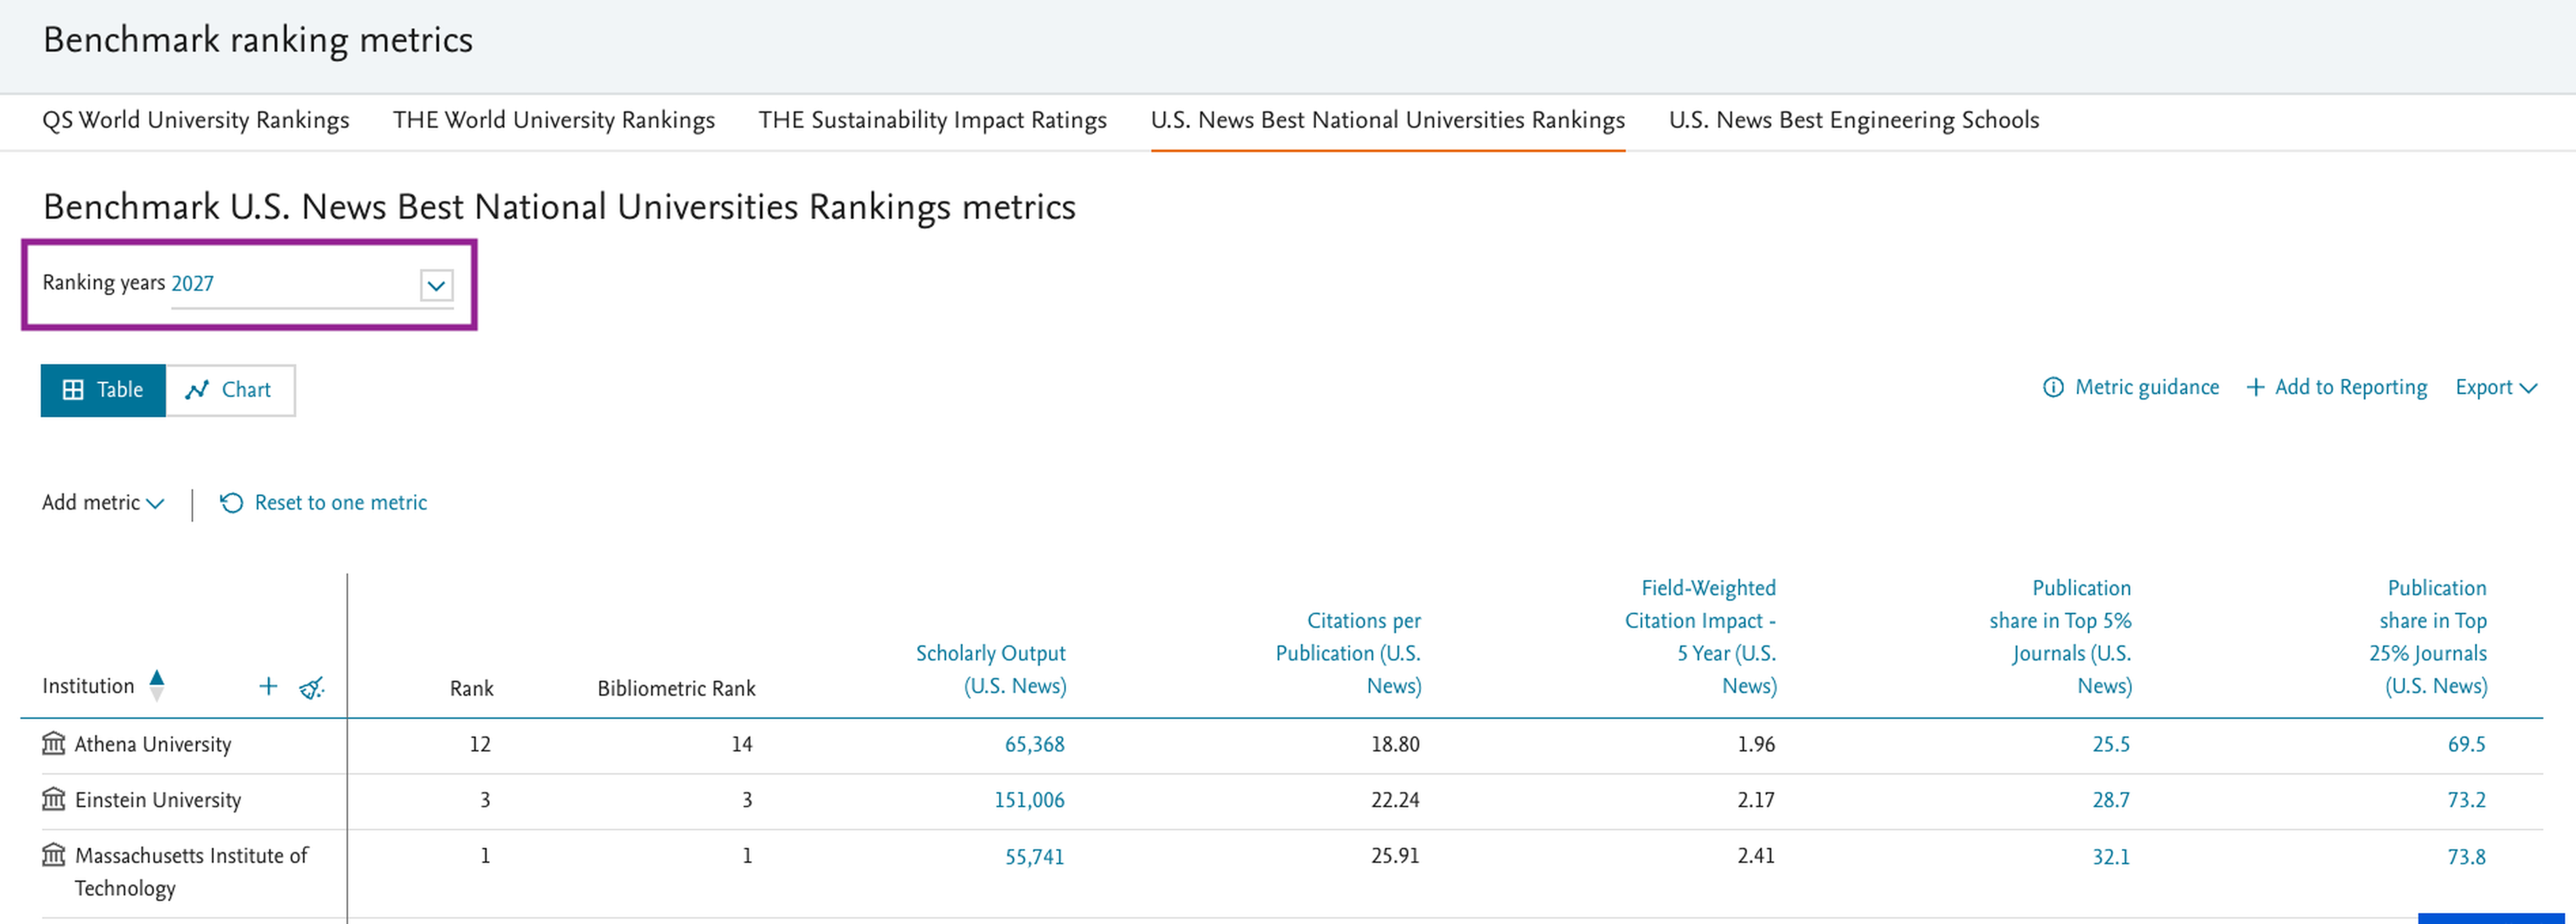
- U.S. News Best National University Rankings 2027 bibliometric dataset is available to analyze
Building on the launch of the U.S. News Rankings in SciVal, you can now analyze the bibliometric dataset used in the U.S. News Best National University Rankings 2027 (released on September 22nd, 2026). Get a deeper understanding of the drivers behind the U.S. News specific bibliometrics (Citations per Publication, FWCI, Publication shares in top 5% and 25% journals by CiteScore), contributing 4% to the overall ranking.
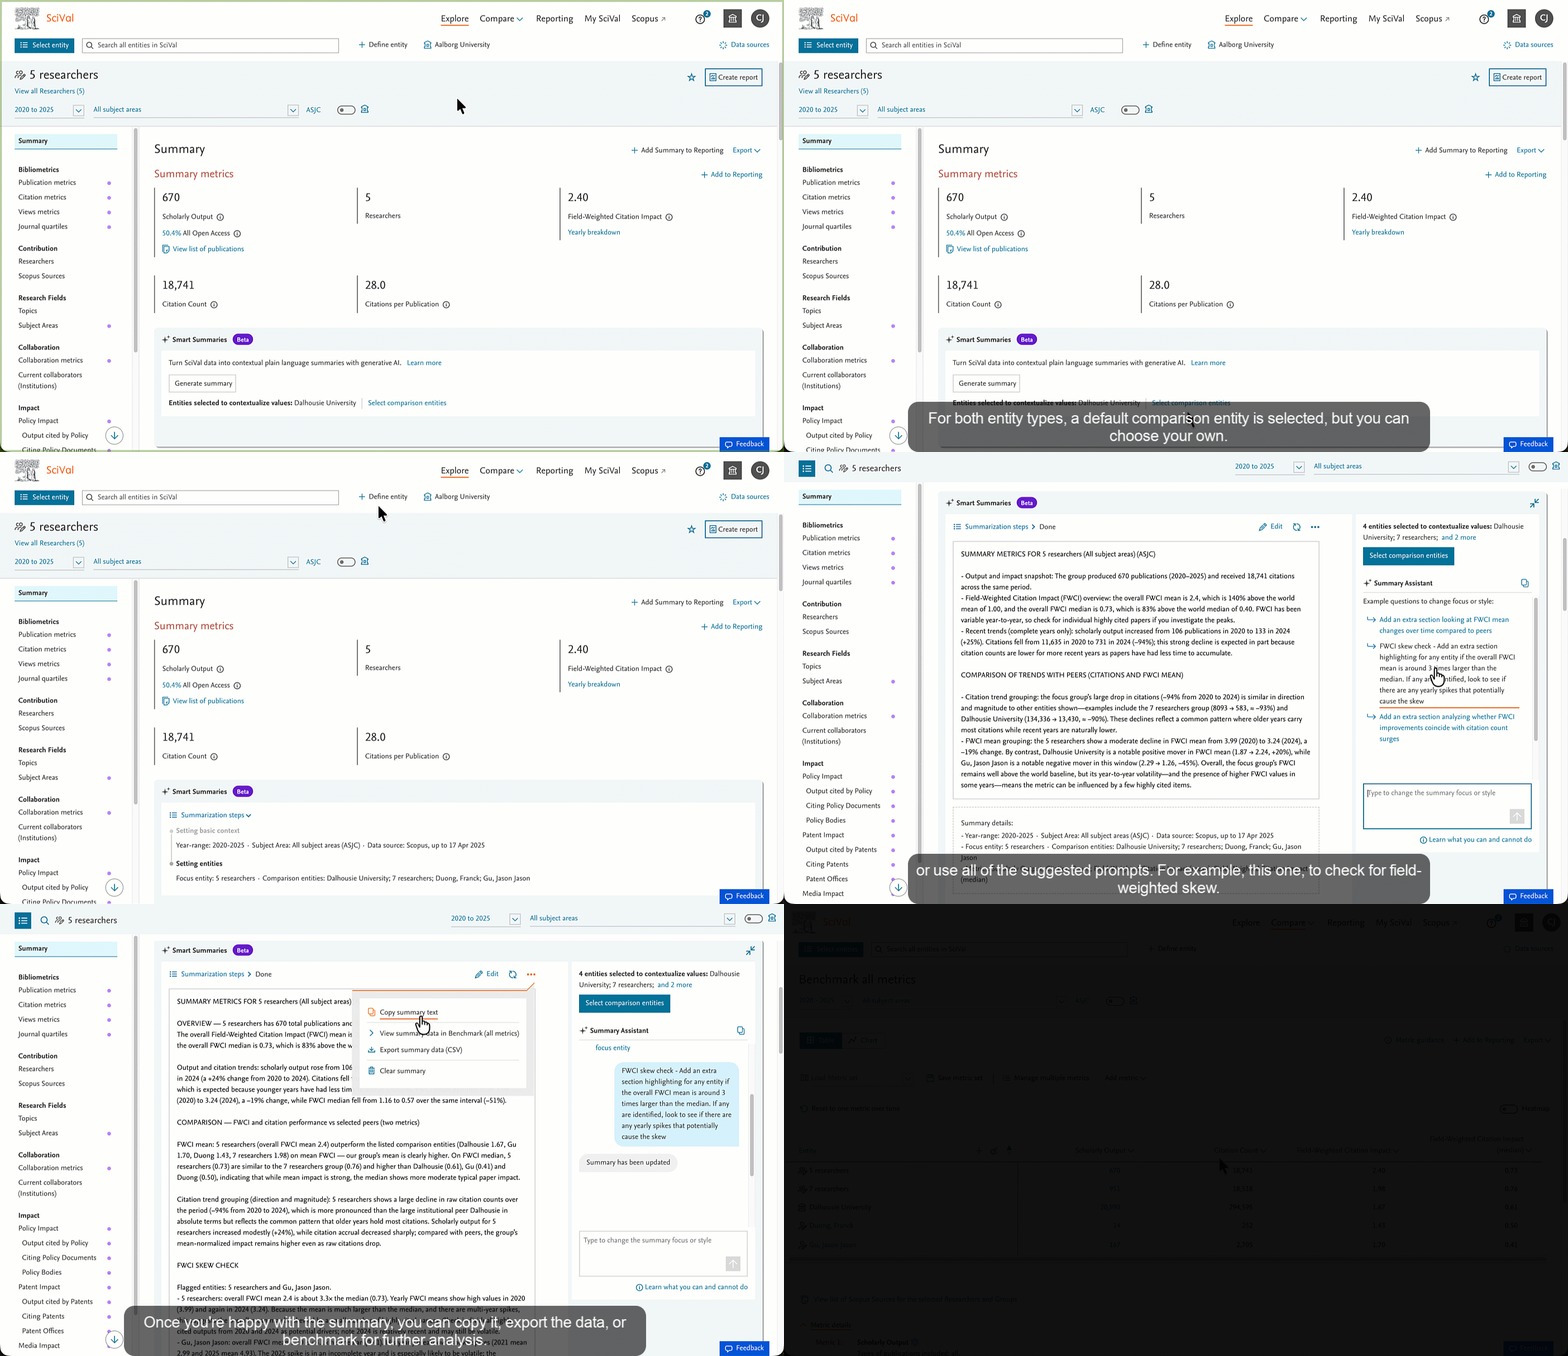
The second phase of the Lava Flows release brings you the latest enhancements to Smart Summaries, including a more conversational experience, formatted summaries, and much more.
- Smart Summaries enhancements
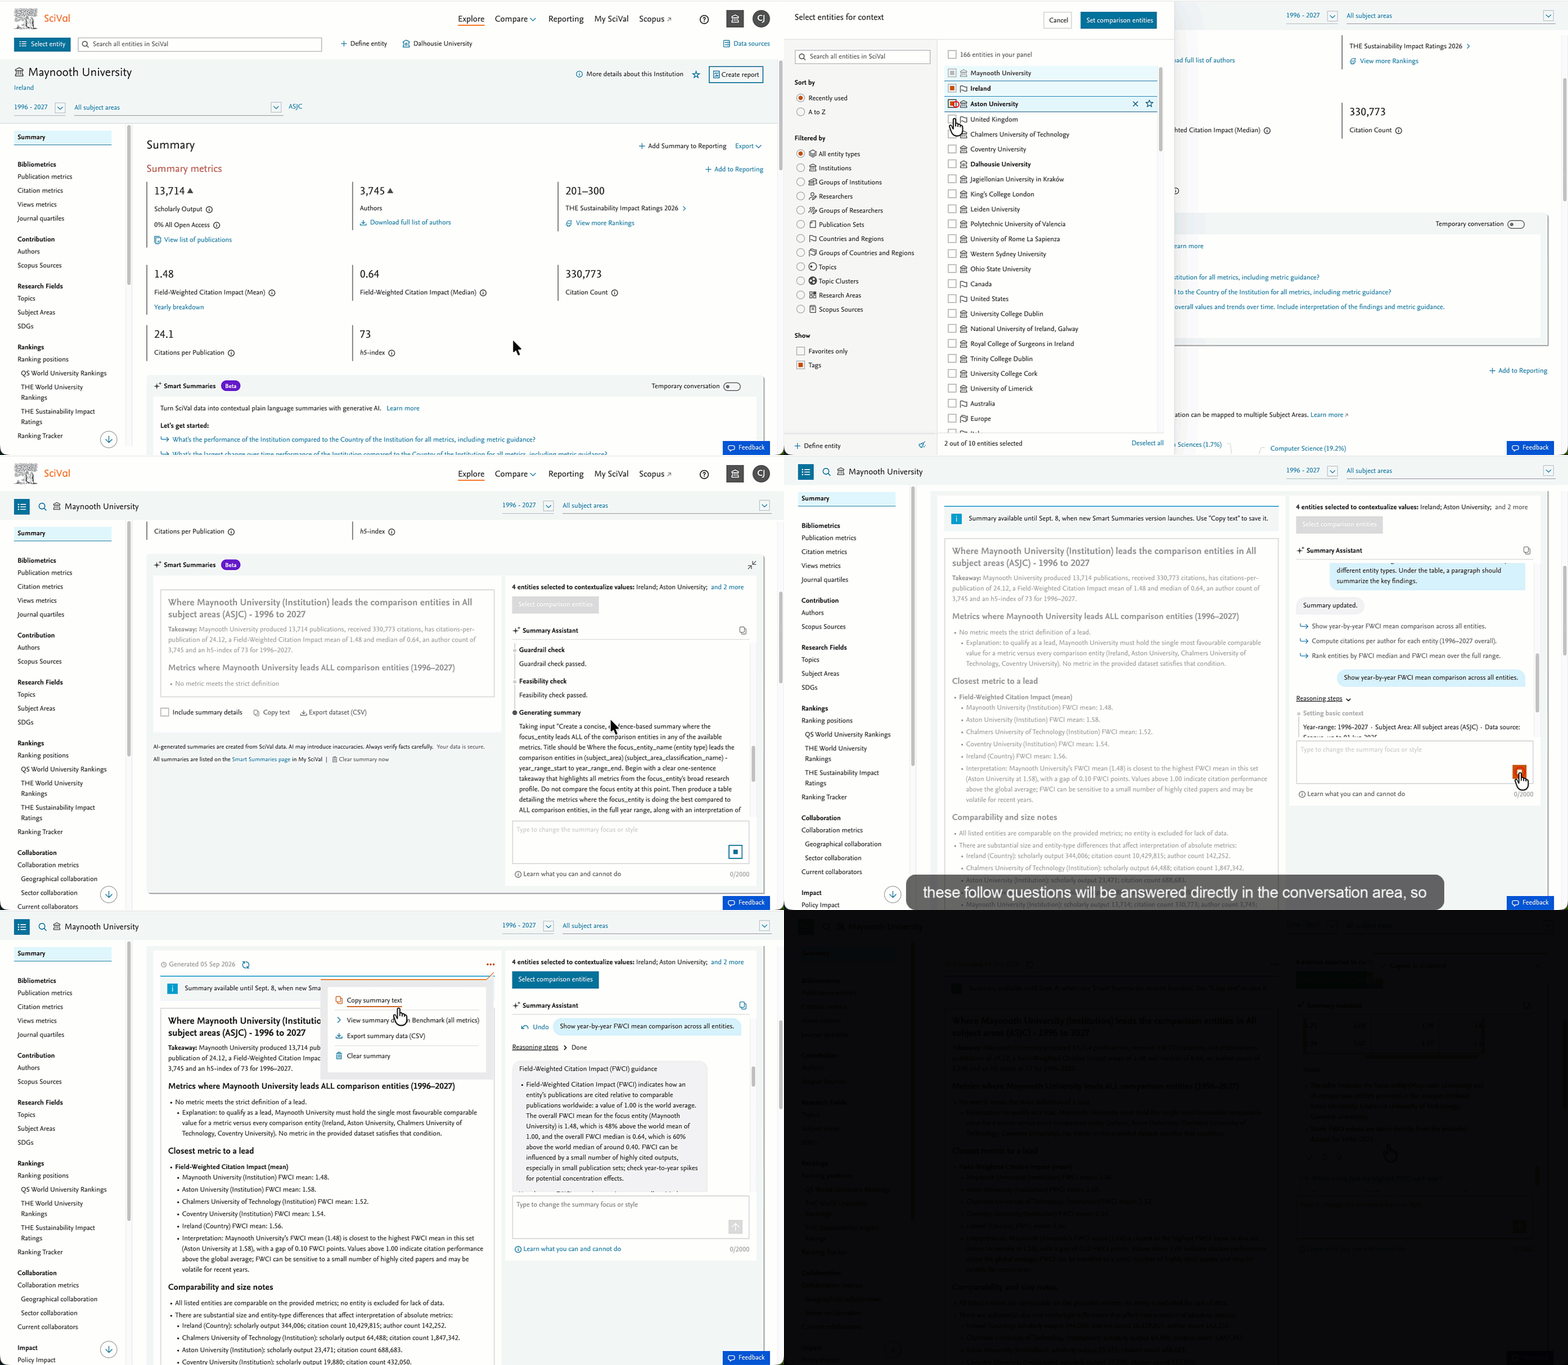
With this update, we’ve made Smart Summaries more conversational and transparent, with richer formatting in both summaries and chat responses. The main focus of this release has been improving how the tool understands user intent and providing a cleaner, more transparent experience.
The update introduces a new agentic workflow, with improved model reasoning and direct responses to questions. Together, these changes provide a more reliable, direct and richly formatted analytical experience. Below are the main improvements included in this release.
New 10-step process
We’ve introduced a new agentic workflow (a 10-step process) that improves safety, intent detection and the overall quality of generated summaries.
Better model reasoning
Together with the new workflow, we’ve moved to a new ChatGPT model. This helps Smart Summaries better interpret metrics, user instructions and the surrounding analytical context.
Direct answers in the chat window
You can now ask metric-focused questions and receive a conversational reply directly in the chat window. This means you can get quick answers without always having to update the full summary.
Clearer explanations and error responses
The conversation window is now more transparent about what Smart Summaries is doing. It also provides clearer explanations when a request cannot be completed, along with more tailored suggested next steps.
Tailored suggested next steps
Follow-up prompts are now generated based on your specific request, as well as the metrics and data available to Smart Summaries. This makes the suggestions more relevant and useful.
Rich formatting with Markdown
We’ve added support for headings, tables, bold text and italics in both summaries and chat responses. You can use the copy option to paste the summary, including its formatting, into programmes such as Microsoft Word.
The August 2026 release is dedicated to lava flows. Lava flows form when molten rock reaches Earth’s surface during a volcanic eruption and moves away from the vent. As the lava cools and solidifies, it creates new rock and reshapes the surrounding landscape, offering a visible reminder of the geological processes that continue to shape our planet.
The Lava Flows release brings you greater flexibility and insight across SciVal with multi subject area analysis, flexible year ranges and subject classification across all pages, deeper collaboration analysis for Institution Groups and easier access to rankings and citation impact insights.
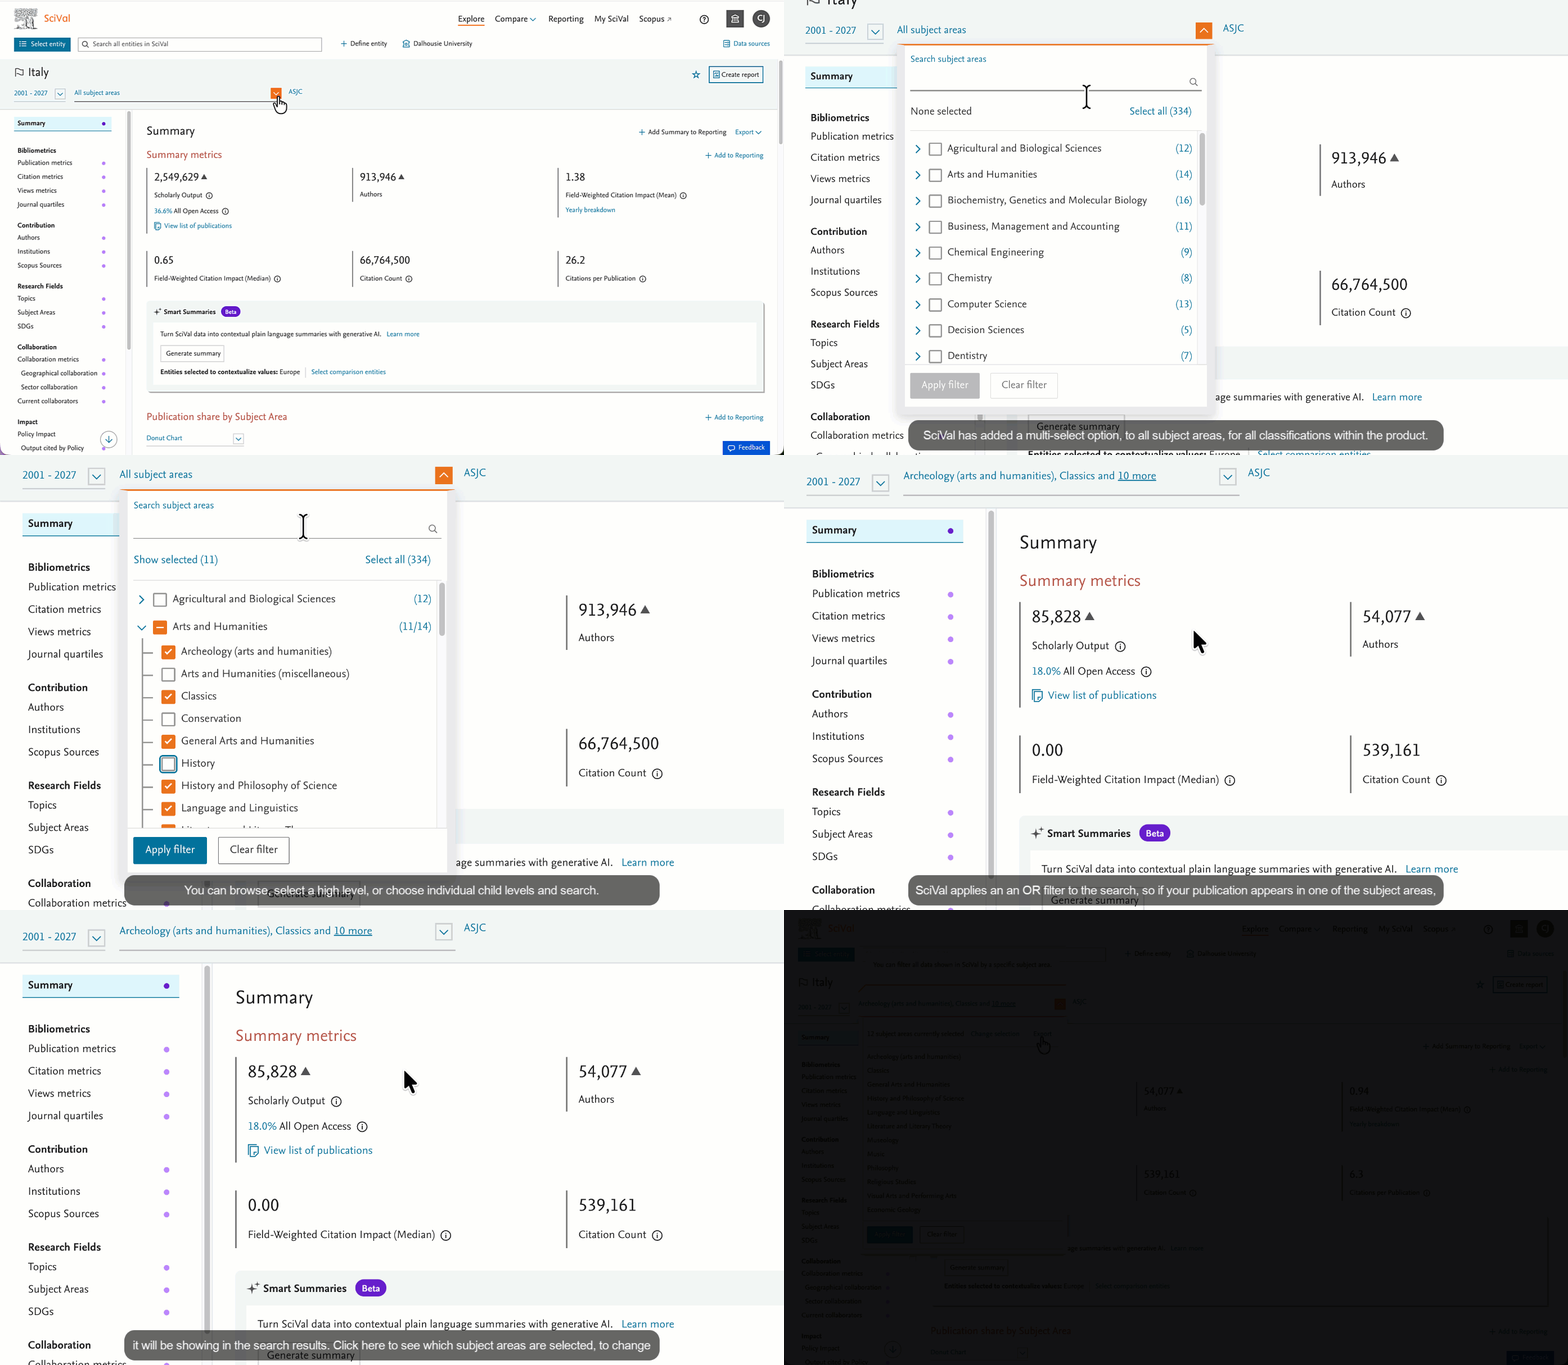
- Gain interdisciplinary insights by analyzing multiple subject areas simultaneously
You can now select more than one subject area at the same time across all available subject classifications in SciVal. This enables deeper analysis across cross disciplines and helps you gain interdisciplinary insights.
Use multiple subject areas to benchmark against peers and identify research strengths, trends, and gaps across related fields. Combined with flexible year ranges, this enhancement provides greater control over subject area analysis. You can also continue your analysis by exporting the results or adding them to Reporting.
- Analyze research with greater flexibility and consistency across SciVal
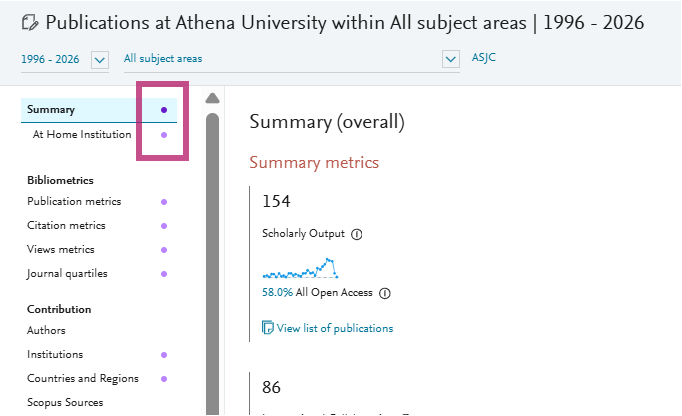
We have extended the latest migration benefits to the remaining Authors, Scopus Sources, and Topics pages. These pages are now identified by a purple dot in the page navigation.
With this update, all SciVal pages now support flexible year range selection from 1996 to the present, access to all available subject classifications, including the Sustainable Development Goals, and entity calculations seven days a week. This provides greater consistency and flexibility when analyzing research performance throughout SciVal.
- Understand collaboration within your Institution Groups
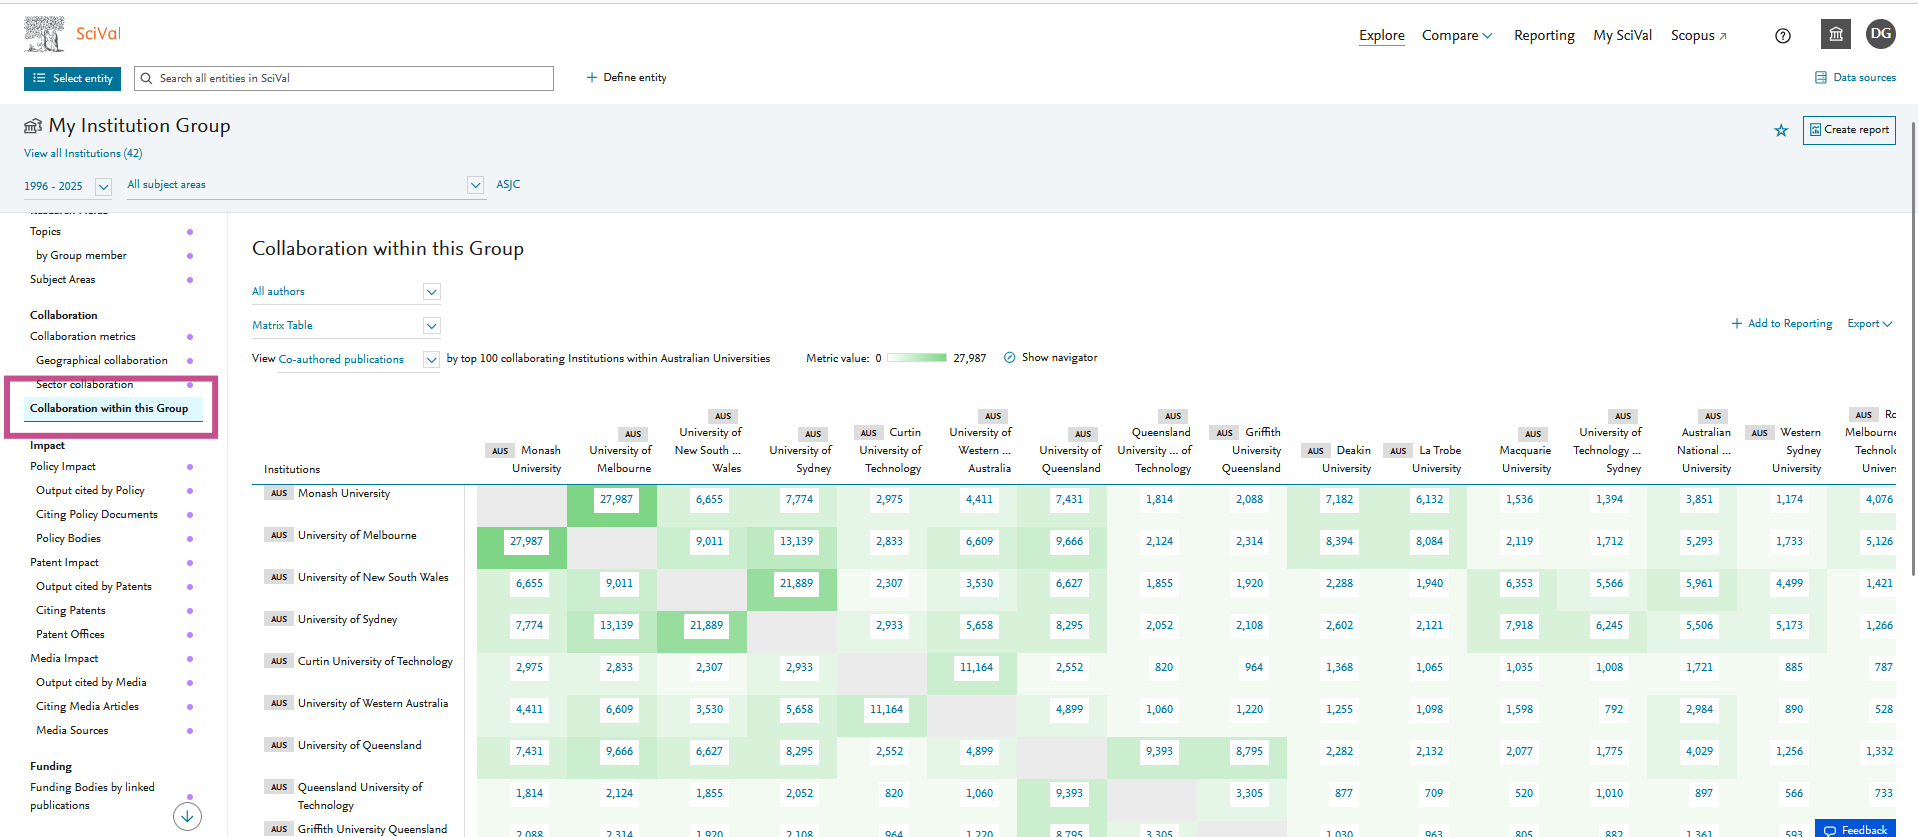
You can now analyze collaboration between the institutions in your user-defined Institution Groups using the 'Collaboration within this Group’ page.
This helps you understand collaboration patterns within the institutional groupings that matter to you and identify how individual institutions contribute to collaboration across the group.
- Get a more complete view of research performance on Summary pages
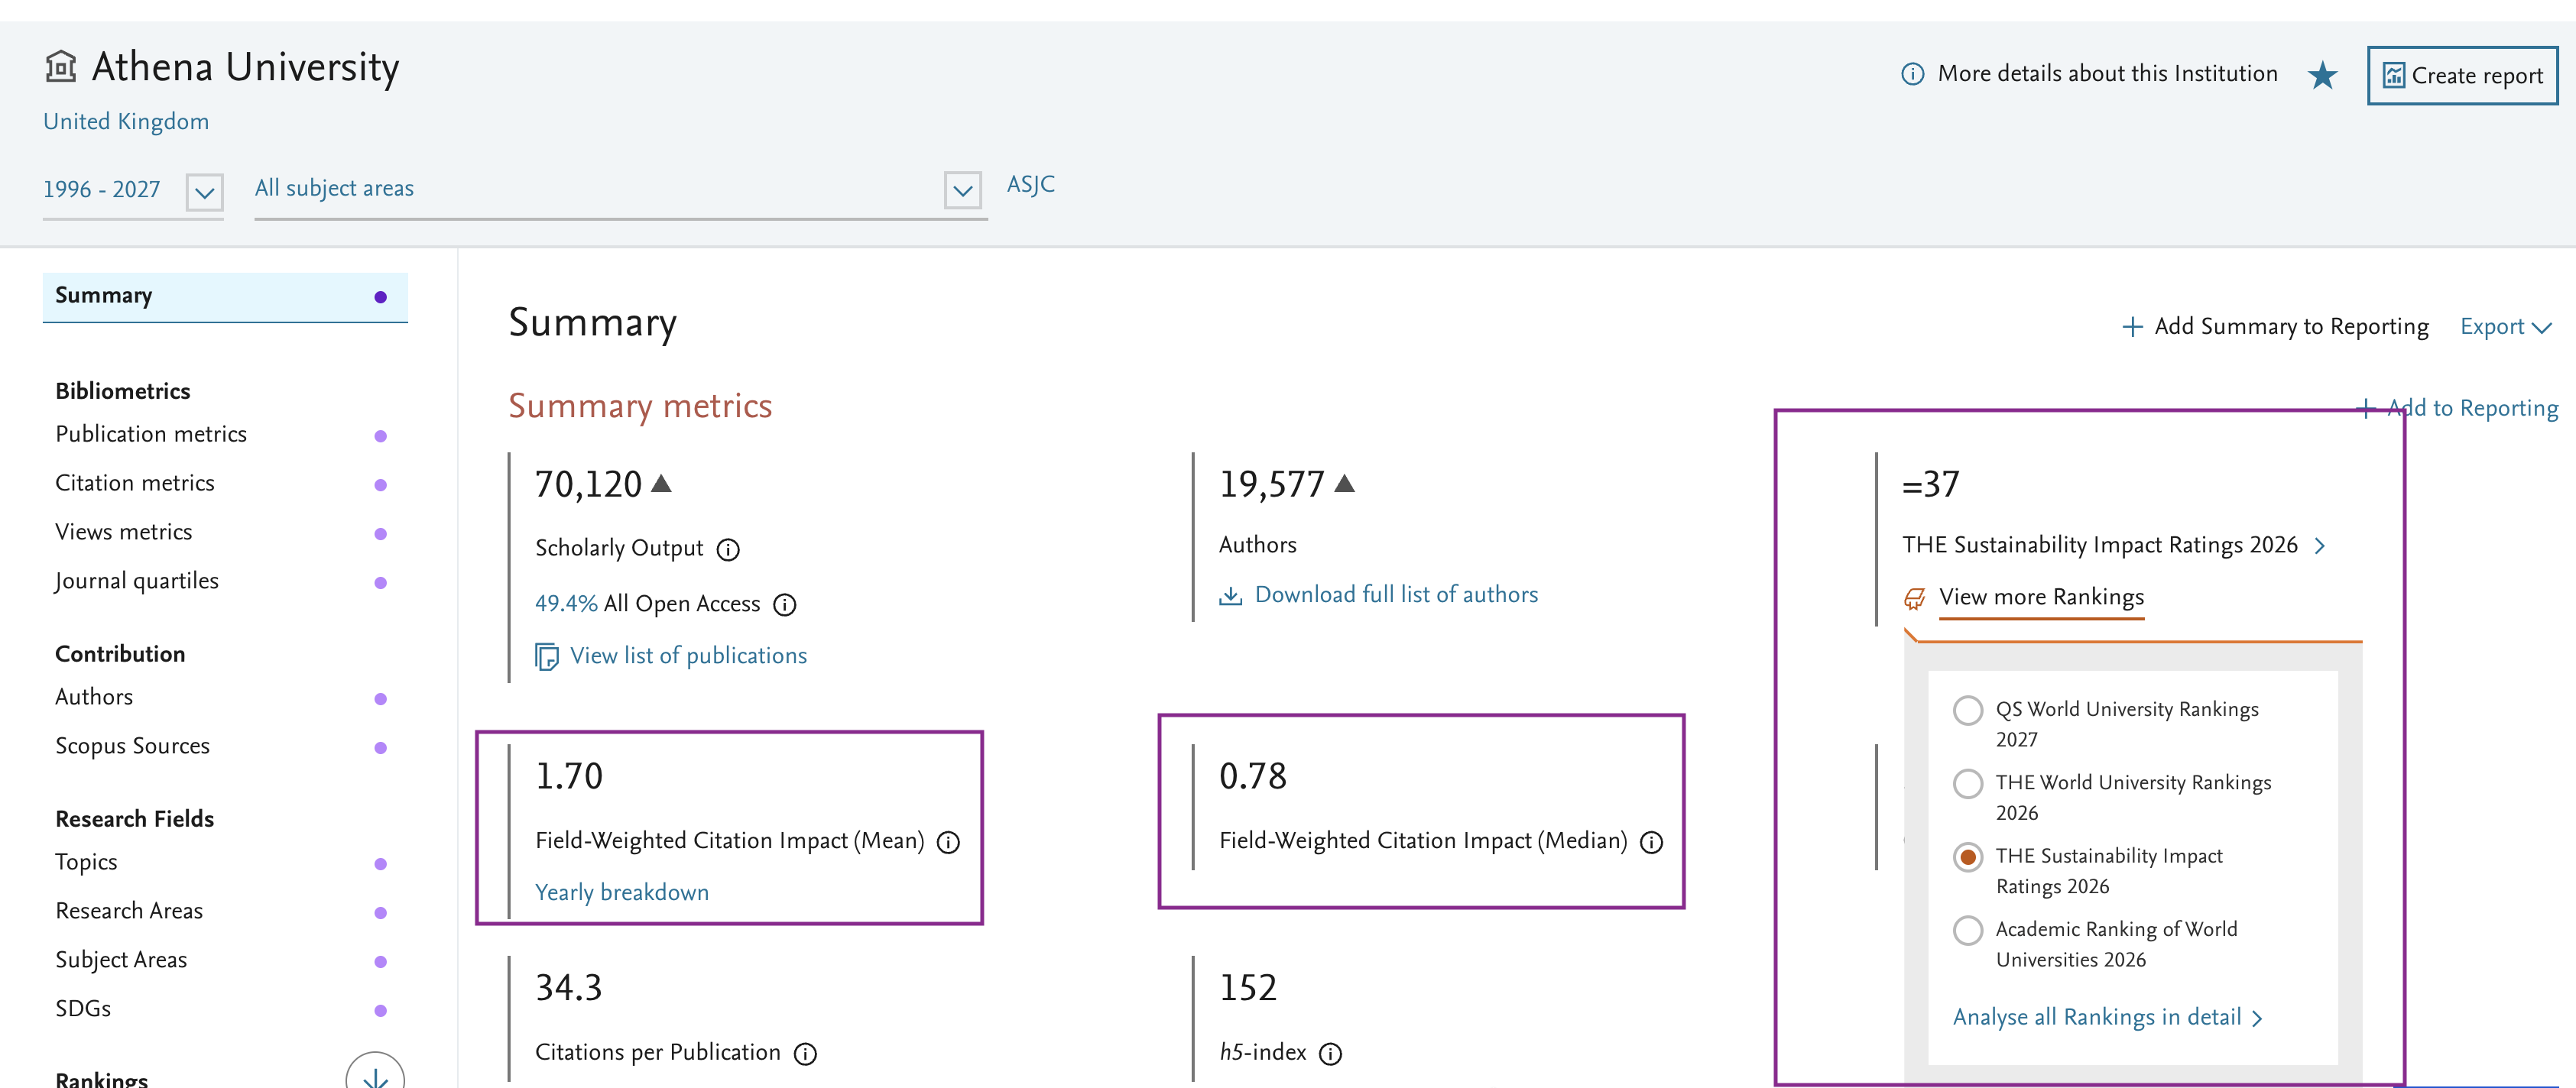
The Summary page for Institution entities now includes a Rankings tile, making relevant ranking information more visible within your research performance overview.
Mean and Median Field-Weighted Citation Impact values are also displayed more prominently for the applicable entities. Viewing these measures together provides additional context for understanding the distribution of citation impact across the selected entity's publications.
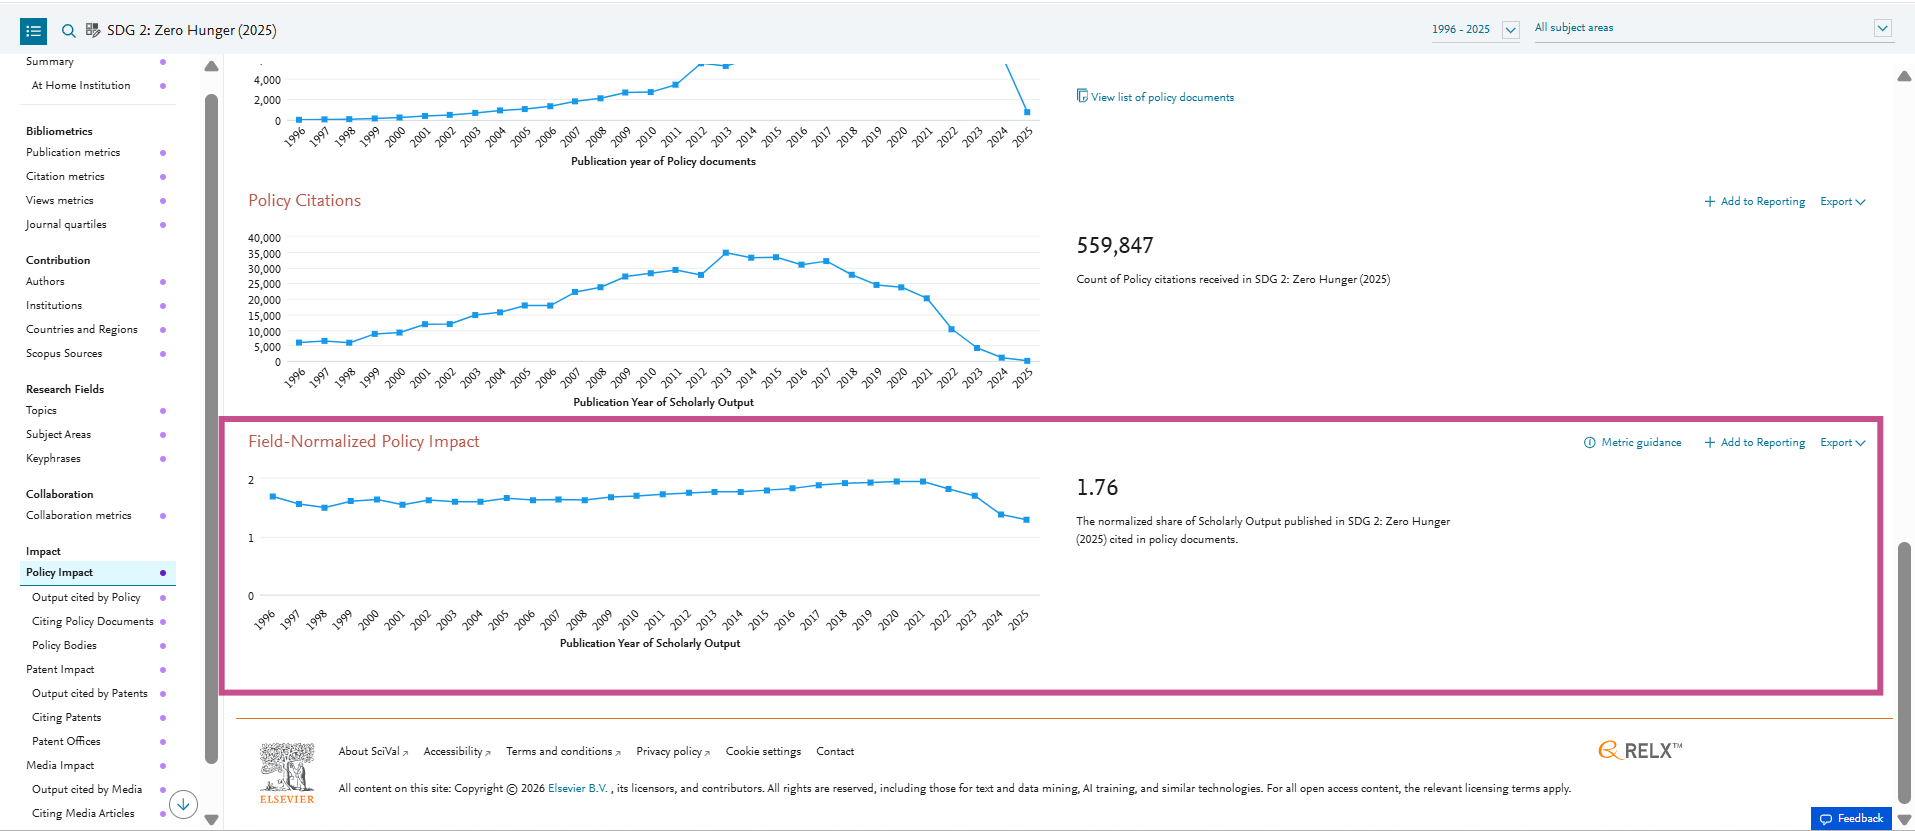
- Track changes in Field-Normalized Policy Impact over time
A new annual breakdown visualization for Field-Normalized Policy Impact (FNPI) is now available on the Policy Impact page in Explore.
The visualization allows you to see at a glance how the FNPI for your selected entity has developed over the years, making it easier to identify changes and trends over time.
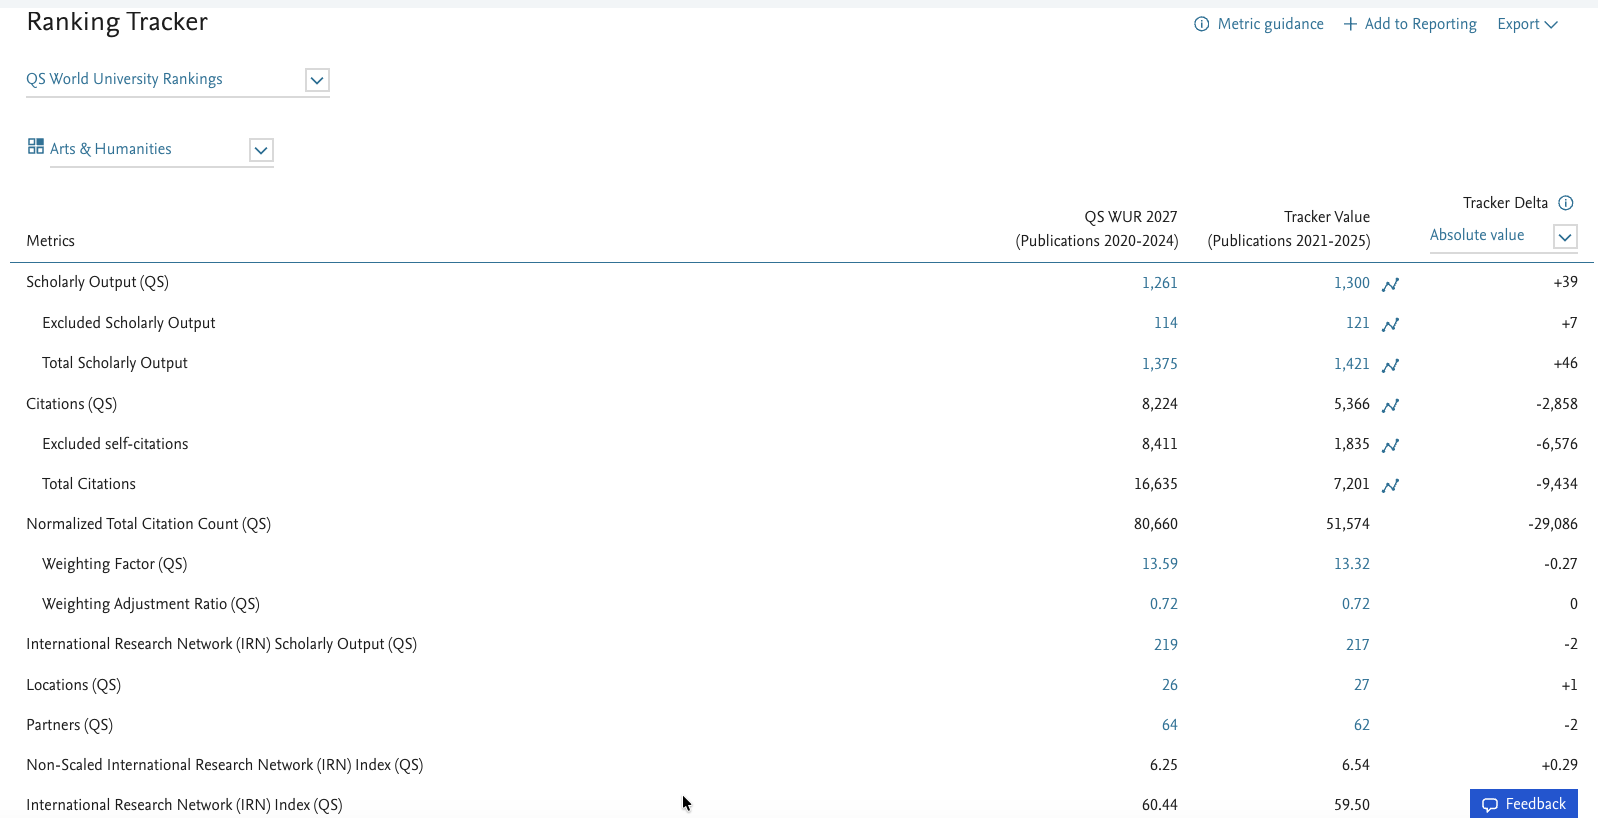
- Access your latest QS World University Rankings performance in Ranking Tracker
Using an interim Scopus data snapshot (1 July 2026) and applying the same methodology outlined by QS for the final rankings (QS WUR 2028), you can review your current performance across the bibliometric drivers and compare it with the latest published edition (QS WUR 2027).
Gain deeper insights into key metrics such as the Normalized Total Citation Count (NTCC) and the International Research Network (IRN) Index, both overall and by QS faculty area. These insights help you make more informed planning and strategic decisions.
The second phase of the Kilimanjaro release brings the latest QS World University Rankings 2027 and Sustainability Impact Ratings 2026 datasets for deeper analysis and benchmarking.
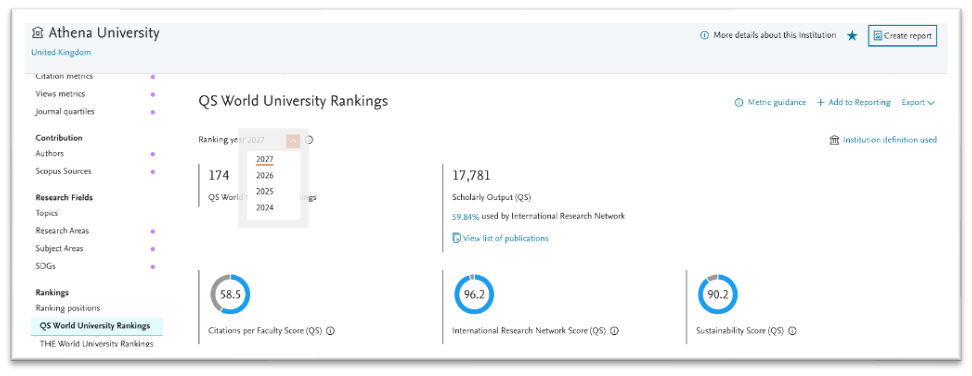
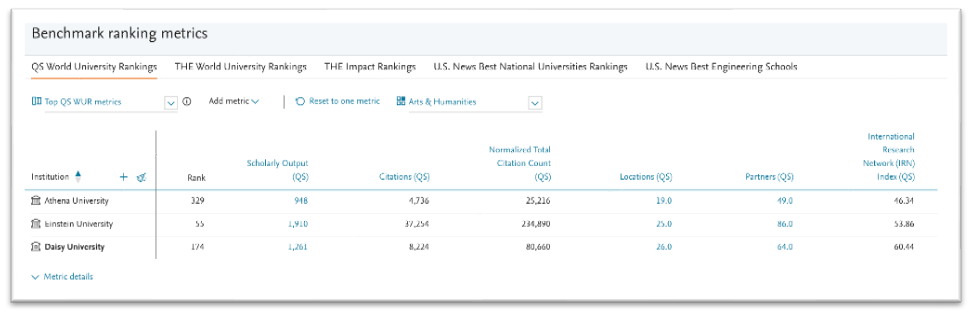
- Analyze the bibliometric dataset behind the QS World University Rankings 2027
Gain insights into the bibliometric indicators used in the recently announced QS World University Rankings 2027. (Announced on 18th June 2026)
You will be able to analyze key indicators such as Citations per Faculty, International Research Network, and Sustainability, which together contribute 26.3% of the overall ranking score.
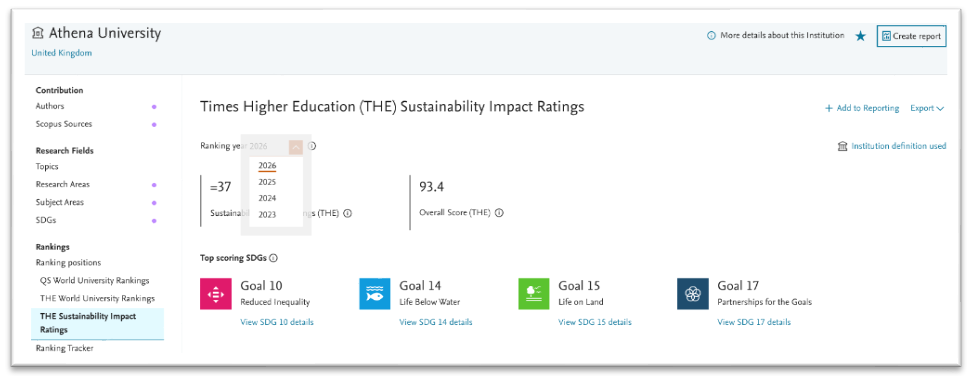
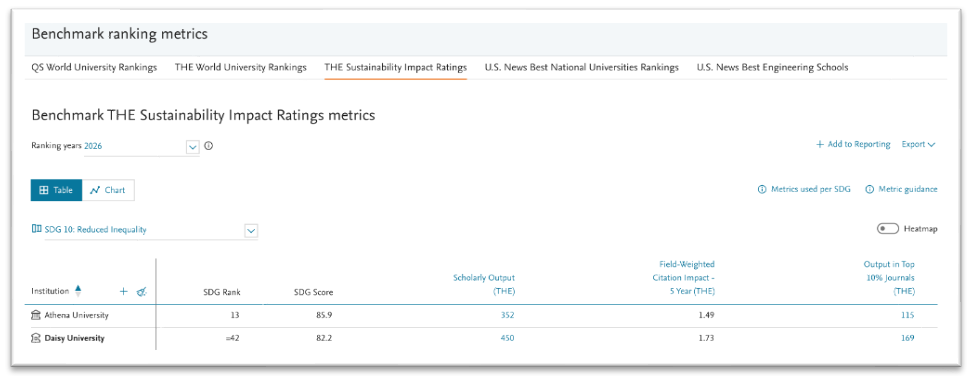
- Analyze the bibliometric dataset underlying the Sustainability Impact Ratings 2026
Analyze the research metrics and underlying publication sets used in the Sustainability Impact Ratings 2026, formerly known as the THE Impact Rankings. (Announced on 23rd June 2026)
The analysis continues to focus on performance related to the United Nations Sustainable Development Goals (SDGs), enabling deeper insight into institutional sustainability impact.
The June 2026 release is dedicated to Kilimanjaro. Rising 5,895 meters above the plains of northern Tanzania, Mount Kilimanjaro is the highest free-standing mountain in Africa and one of the world’s most recognizable natural landmarks. A UNESCO World Heritage site, it is renowned for its diverse ecosystems, from tropical forests to alpine deserts. Kilimanjaro’s enduring appeal reflects ambition, exploration, and the pursuit of new heights.
The Kilimanjaro release brings you a more conversational Smart Summaries experience, a new Field-Normalized Policy Impact metric, flexible year ranges and additional subject classifications on Summary pages, QS World University Rankings Ranking Tracker in Compare, and much more.
- Generate and manage Smart Summaries more easily
The Kilimanjaro release brings you a smoother Smart Summaries experience, with clearer generation controls, improved progress feedback, more streamlined suggested prompts and easier access to Smart Summary management.
Stop Smart Summary generation directly from the chat window - When you send a prompt in Smart Summaries, the send arrow now changes into a stop button while the response is being generated. This keeps the control where you are working, making it easier to stop a response without navigating elsewhere on the page.
Clearer feedback while Smart Summaries are generating – We've added a new loading screen for Smart Summaries. Instead of seeing a blank space while the first response is being created, you will now see a clearer progress state, giving a smoother experience.
More streamlined suggested prompts - Suggested prompts are now displayed in a smaller format to reduce the space they take up in the chat. When you select a prompt, it expands into the chat window with the full prompt, enabling richer instructions and more useful responses.
Easier access to Smart Summaries management - Smart Summaries management is now easier to find through a new link in the updated Settings menu. This makes it simpler to access, manage, review, and delete your Smart Summaries.
Try out Smart Summaries (access to 4 analytics modules is required).

- Measure policy impact with the new Field-Normalized Policy Impact metric
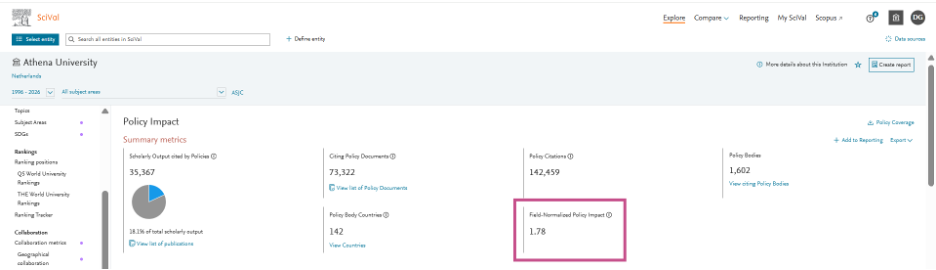
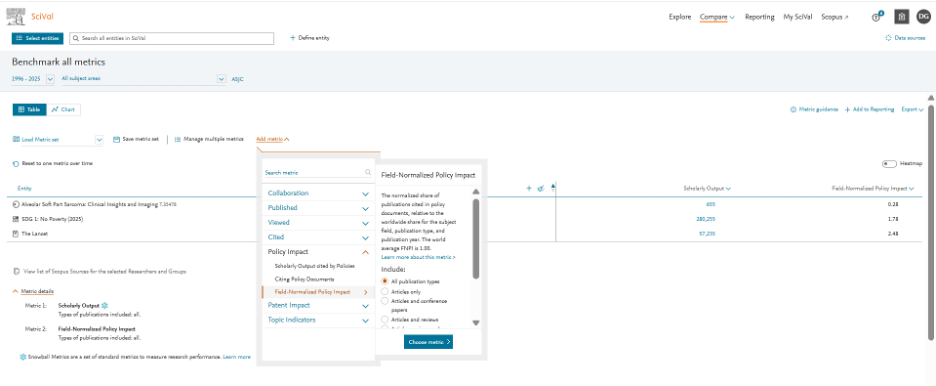
We’ve introduced the Field-Normalized Policy Impact (FNPI) metric.
FNPI indicates how the share of an entity’s publications cited in policy documents compares to the global average for similar publications. The metric is normalized by subject area, publication type, and publication year, with a world average value of 1.00. This helps you evaluate policy impact while accounting for differences across disciplines and publication characteristics. Learn more about the FNPI and its methodology.
The metric is available on the Policy Impact page in Explore and in Compare (All metrics). Customers with an Impact subscription can analyze FNPI across all entity types, while Overview and Benchmarking subscribers can access it for institution entities.
- Expanded access to flexible year ranges and additional subject classifications
We continue to bring migration benefits to more SciVal pages.
The Summary and Summary at home institution pages now support flexible year range selection from 1996 to the present, access to all available subject classifications, and entity calculations seven days a week. These enhancements provide greater flexibility when analyzing research performance and allow you to tailor analyses more closely to your reporting and benchmarking needs.
- Benchmark QS World University Rankings interim progress in Compare using Ranking Tracker
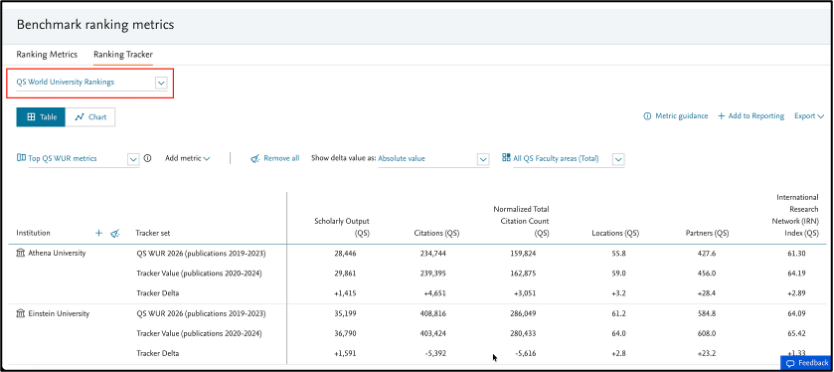
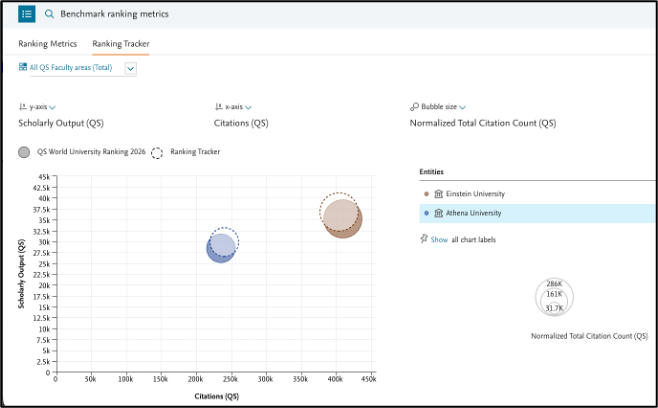
The Ranking Tracker for QS World University Rankings is now available in Compare.
You can benchmark your institution’s progress against peer institutions using the QS WUR Ranking Tracker and compare the upcoming ranking edition with the latest published rankings. This makes it easier to monitor changes over time, understand relative performance, and support rankings strategies with peer benchmarking.
The Ranking Tracker also enables you to review research metrics across the five QS faculty areas, providing deeper insight into the drivers behind rankings performance.
- Analyze institutional collaboration more accurately
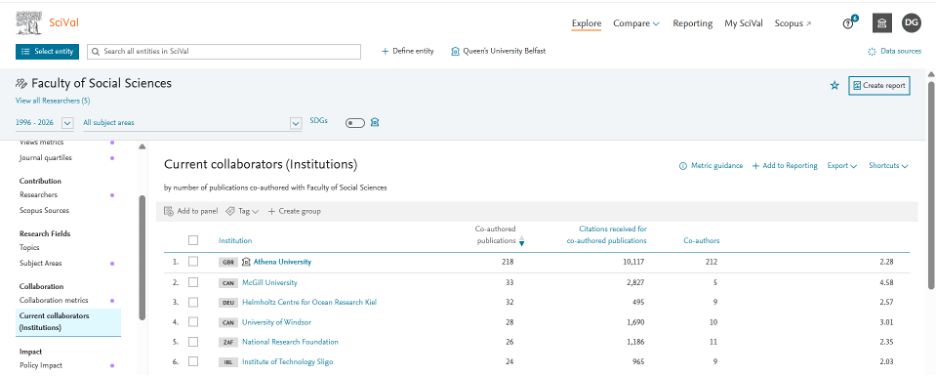
The Current Collaborators (Institutions) page for Researcher Groups is available again with improved collaboration logic.
The updated page provides improved identification of collaborating institutions and also supports the latest migration benefits, helping you analyze institutional collaboration patterns with greater flexibility.
- More granular analysis with flexible filter options on Current Collaborators page for the home institution
You can now use the Research Area filter (for the Home Institution) together with the Subject Area filter. Previously, these filters could only be applied independently. This enhancement enables more granular analysis by allowing you to explore specific Research Area and Subject Area combinations.

- Access Tags, Metrics Sets and Smart Summaries more easily
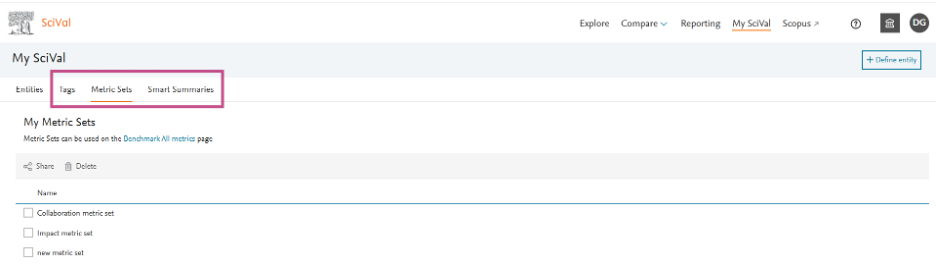
We've moved several tabs previously located under Settings to My SciVal for easier access. You can now view and manage your Tags, Metric Sets, and Smart Summaries directly from My SciVal. Simply go to the respective tab. Entity management remains available as usual, under the “Entities” tab.
- Yearly rollover updates for 2026
As part of the annual SciVal rollover process, 2025 Scopus content is now considered a complete year, enabling users to analyze and benchmark research performance using the latest complete dataset.
This update includes the latest CiteScore, SNIP, and SJR values, recalculation of Prominence Percentiles for Topics and Topic Clusters using 2025 CiteScore metrics, and reallocation of eligible four-year-old publications to more representative Topics where applicable.
Reports based on pages without flexible year ranges will automatically move forward to the new reporting window. For example, a report using the range 2020–2025 will automatically update to 2021–2026.
The May 2026 release is dedicated to Jeju Island. Located off the southern coast of South Korea, Jeju is renowned for its volcanic landscapes, including Hallasan mountain, lava tubes, and scenic waterfalls, and is recognized as a UNESCO World Heritage site. The island is also famous for its haenyeo — women who free-dive (without oxygen tanks) to collect seafood. Recently, Jeju has gained global attention as a top travel destination for 2026, with growing tourism and development.
The Jeju Island release brings you enhanced features of generative AI–powered Smart Summaries, U.S. News Best Engineering Schools in Compare and 2026 ranking edition, more pages with flexible year ranges and all subject classifications, and much more.
- Smart Summaries updates
Smarter, faster, and easier to manage — the latest Smart Summaries* updates give you more transparency, more control, and more ways to turn insights into action.
- Know when your summary may be out of date
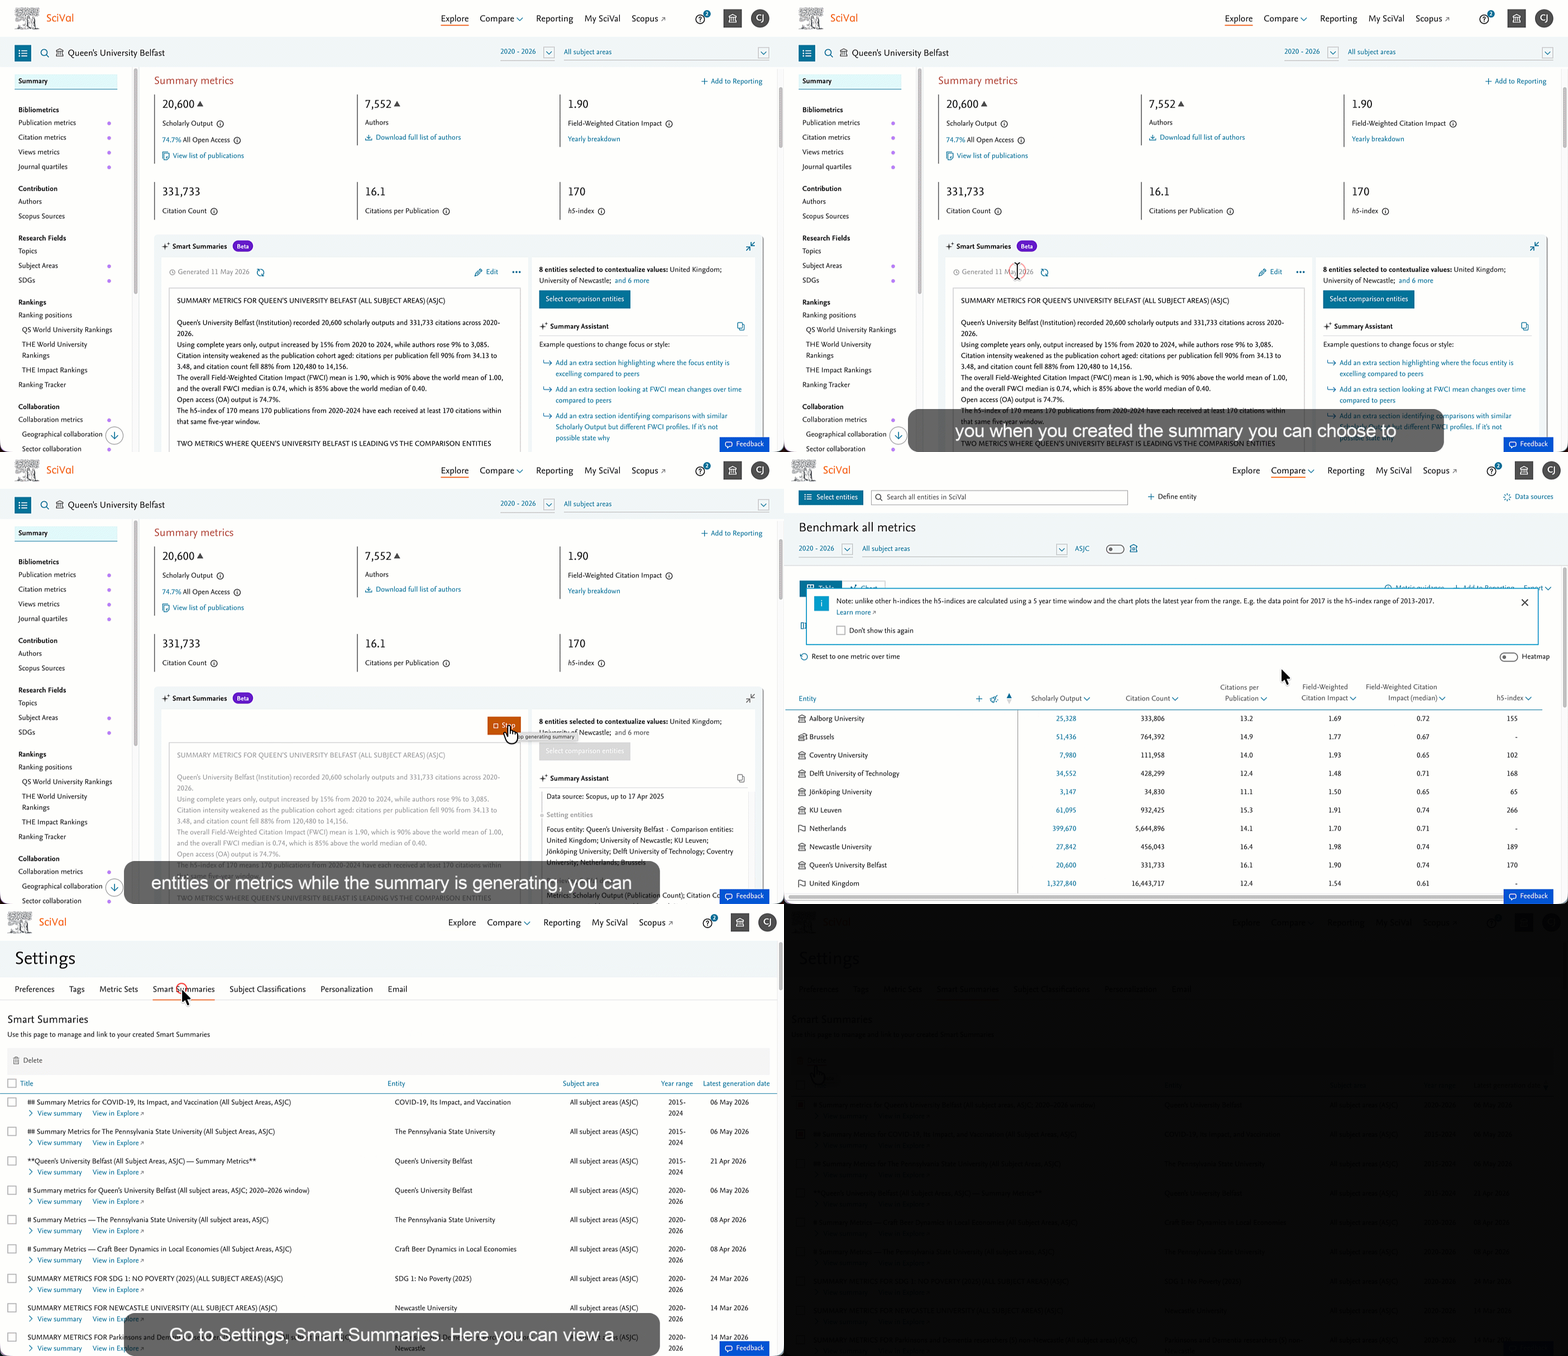
Smart Summaries now alerts you when new SciVal data cuts have been added since your summary was created. You can see when you created the summary and choose to regenerate your summary using the latest data. - Stop and refine summaries in real time
Need to adjust your prompt, entities, or metrics while a summary is generating? You can now interrupt the LLM flow at any time with our new stop button and make changes without waiting for completion. - More Summary metrics transferred directly to Compare
In the previous release, we expanded Smart Summaries to support all Summary metrics (up from 4 metrics). The option to view the summary metrics and entities in Compare now supports all of these metrics. Newly supported metrics include International Collaboration %, Citations per Publication, and h5-index, plus more, making it easier to move from insight to benchmarking. - A new home for managing your summaries
We’ve introduced a dedicated summaries management page where you can view all of your summaries in one place, revisit and read summaries, navigate back to the source page, and delete summaries you no longer need.
* Smart Summaries are available for customers with a Research Analytics subscription (previously referred to as the Overview, Benchmarking, Collaboration and Trends modules).
- U.S. News Best Engineering Schools is now available in Compare, including access to the 2026 bibliometric dataset
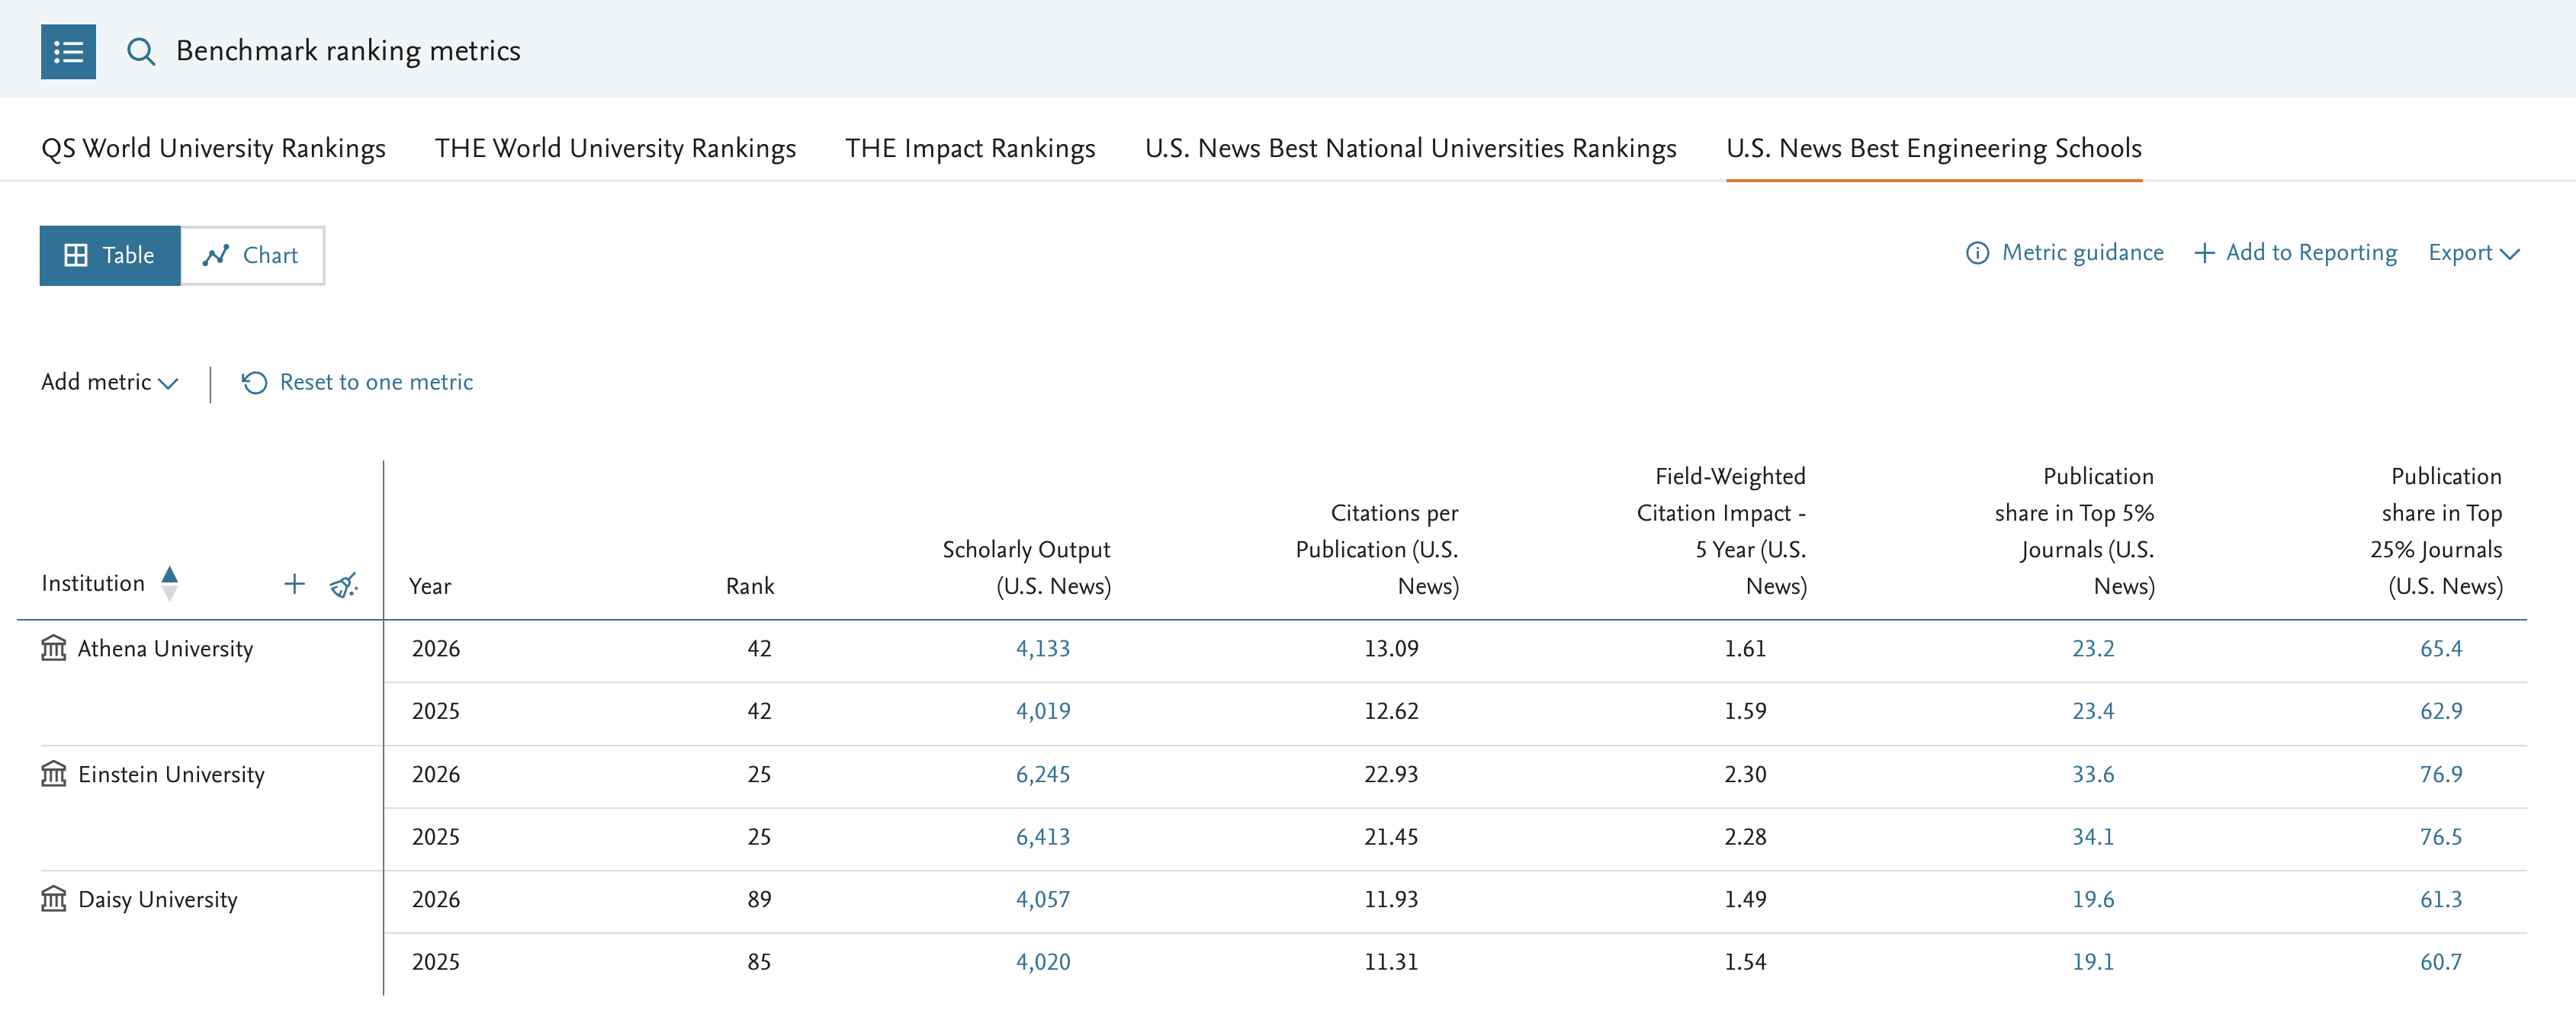
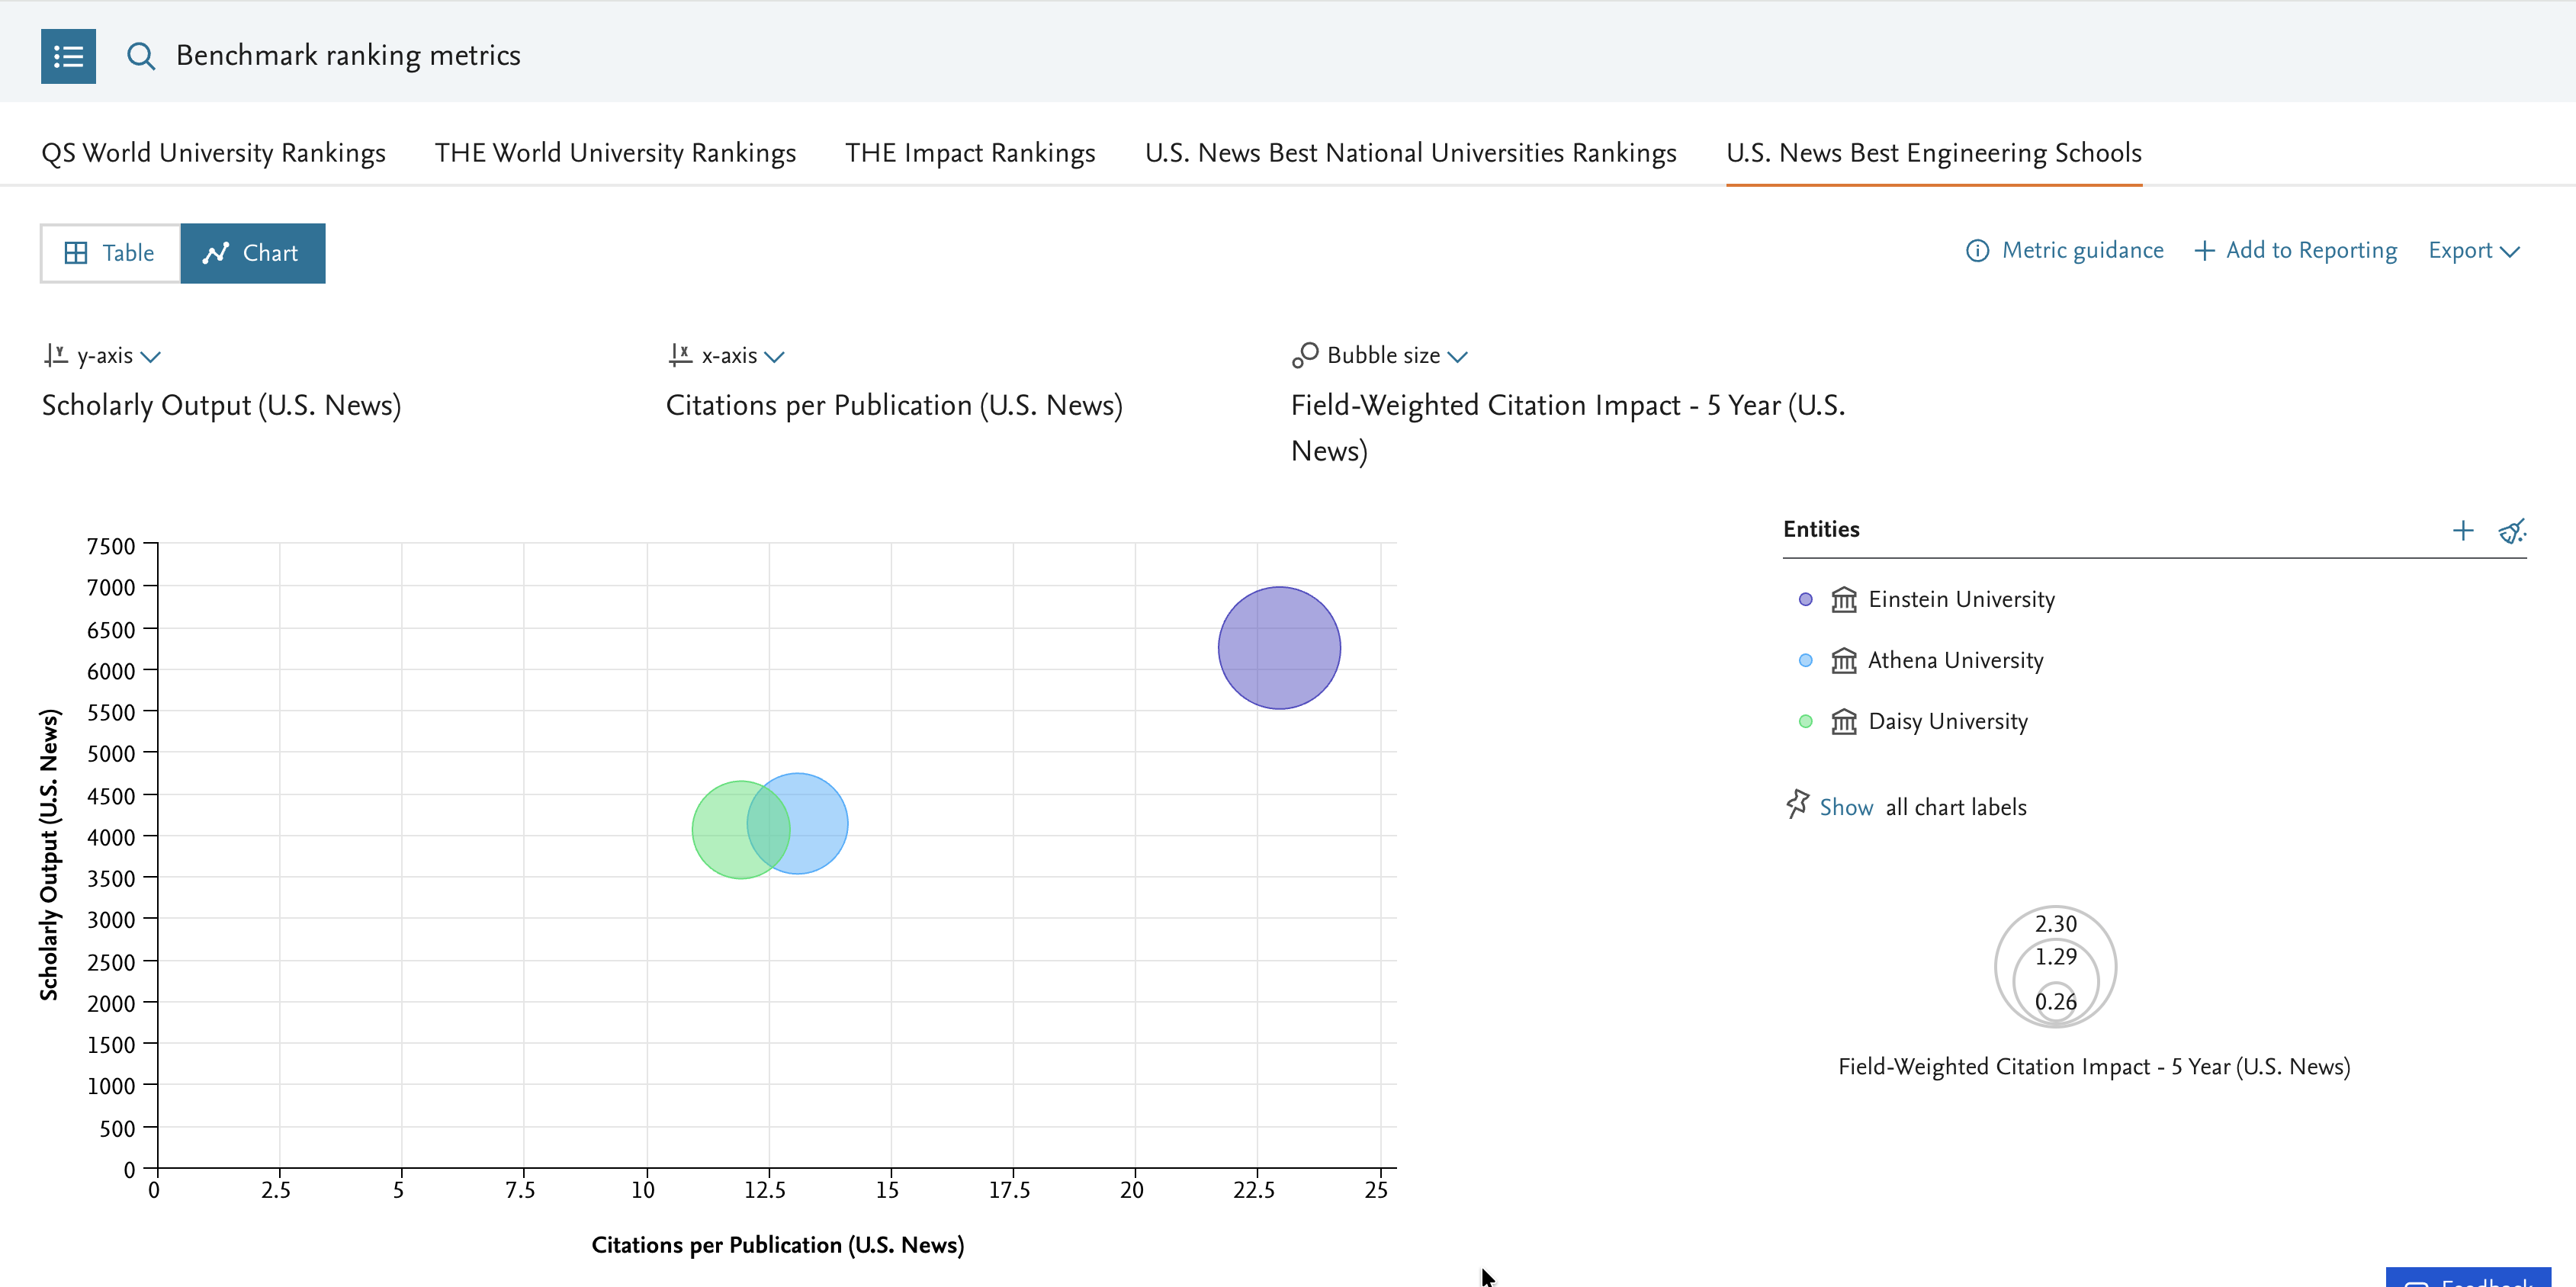
We are excited to launch the U.S. News Best Engineering Schools (part of the U.S. News Best Graduate Schools) in Compare. You can now analyze and benchmark your engineering school’s performance against peers using the actual bibliometrics used in the rankings, and populate comparison tables for reporting and deeper analysis.
Gain a deeper understanding of the drivers behind the bibliometrics, including Citations per Publication, FWCI, and publication shares in the top 5% and 25% of journals by CiteScore, which together contribute 10% of the overall ranking.
Access the U.S. News Best Engineering Schools 2026 bibliometric dataset. You can access the bibliometric dataset used in the 2026 U.S. News Best Engineering Schools rankings, released on 7 April 2026. This helps you understand relative performance across past and current ranking editions and supports benchmarking, reporting, and rankings strategy.
- Flexible year ranges and additional subject classifications on more pages in SciVal
Additional pages have been migrated to the new technologies, enabling additional flexibility. These pages now support flexible year range selection (1996 – present), all subject classifications available in SciVal, and entity computation during the weekend.
- SDGs
- Research Areas
- Researchers
- Countries and Regions
- Keyphrases
- Institutions
- Current collaborators (Institutions and Countries)
- Collaboration within this Group (for Institution Groups)
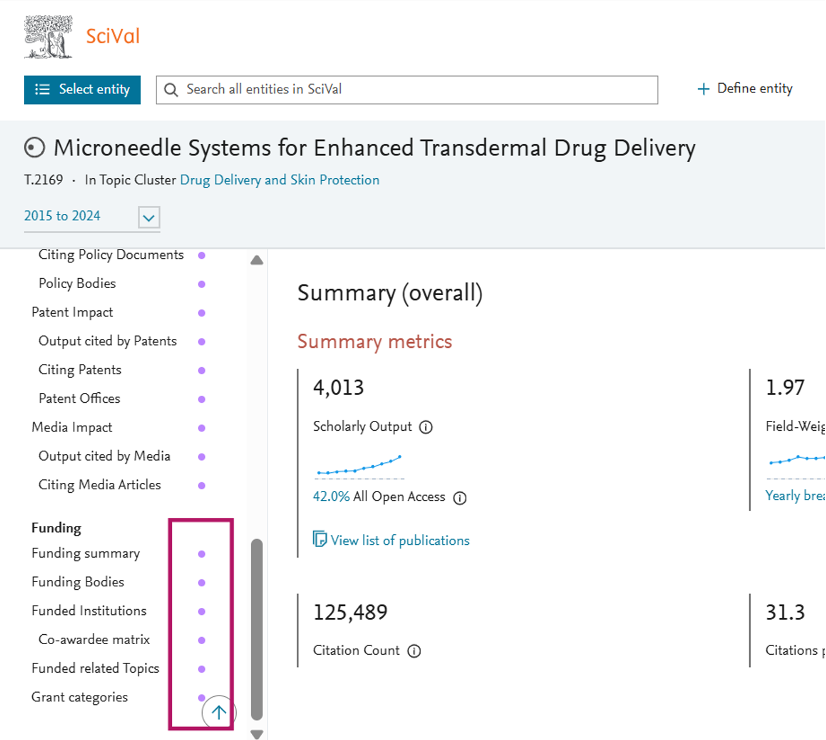
- All Funding pages in Explore and the Grants matrix in Compare
Pages that have been migrated are indicated with a purple dot in the page navigation.
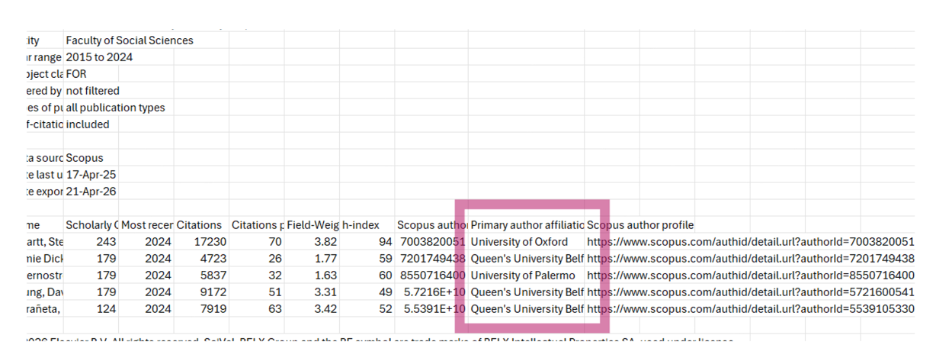
- New export field: Primary affiliation for Researchers
It’s now easier to identify which Institution a Researcher is from with a new export field showing each researcher’s primary affiliation.
This additional column is available in:
- Exports from the Researchers page for Researcher Groups in Explore
- Exports when Researcher entities are selected in Compare
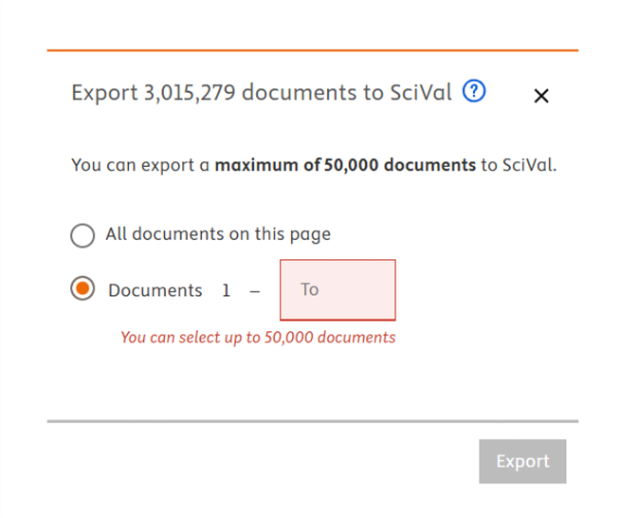
- Create larger publication sets with increased Scopus to SciVal export limits
You can now work with more comprehensive datasets in SciVal thanks to an increased export limit from Scopus.
The maximum number of documents that can be exported directly from Scopus to SciVal has been raised from 20,000 to 50,000 documents, allowing you to create larger publication sets for analysis.
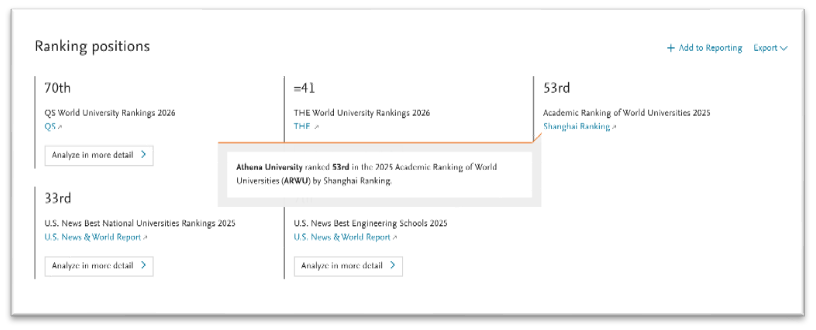
- 2025 Academic Ranking of World Universities (ARWU) ranking
For relevant institutions, you can now see your 2025 Academic Ranking of World Universities (ARWU) ranking (by Shanghai Ranking Consultancy) in the Ranking positions, alongside other rankings.
The March 2026 release is dedicated to icebergs. Icebergs are massive pieces of freshwater ice that break away from glaciers and drift through the ocean. Although they can appear enormous above the surface, most of their mass is hidden beneath the water. Icebergs play an important role in Earth’s climate and ocean systems. As global temperatures rise, however, the timing and patterns of iceberg formation are beginning to change. Scientists now use advanced satellite technology and AI tools to track them from formation to breakup, helping researchers better understand their impact on the climate. Recent observations show giant Antarctic bergs, such as A-23a, which has begun turning blue with meltwater and is now nearing complete disintegration, as they drift into warmer waters.
The Icebergs release brings you the expansion of generative AI ‘Smart Summaries’ for all entity types, Deutsche Forschungsgemeinschaft (DFG) subject classification and much more.
- Expanded rollout of generative AI ‘Smart Summaries’ for all entity types
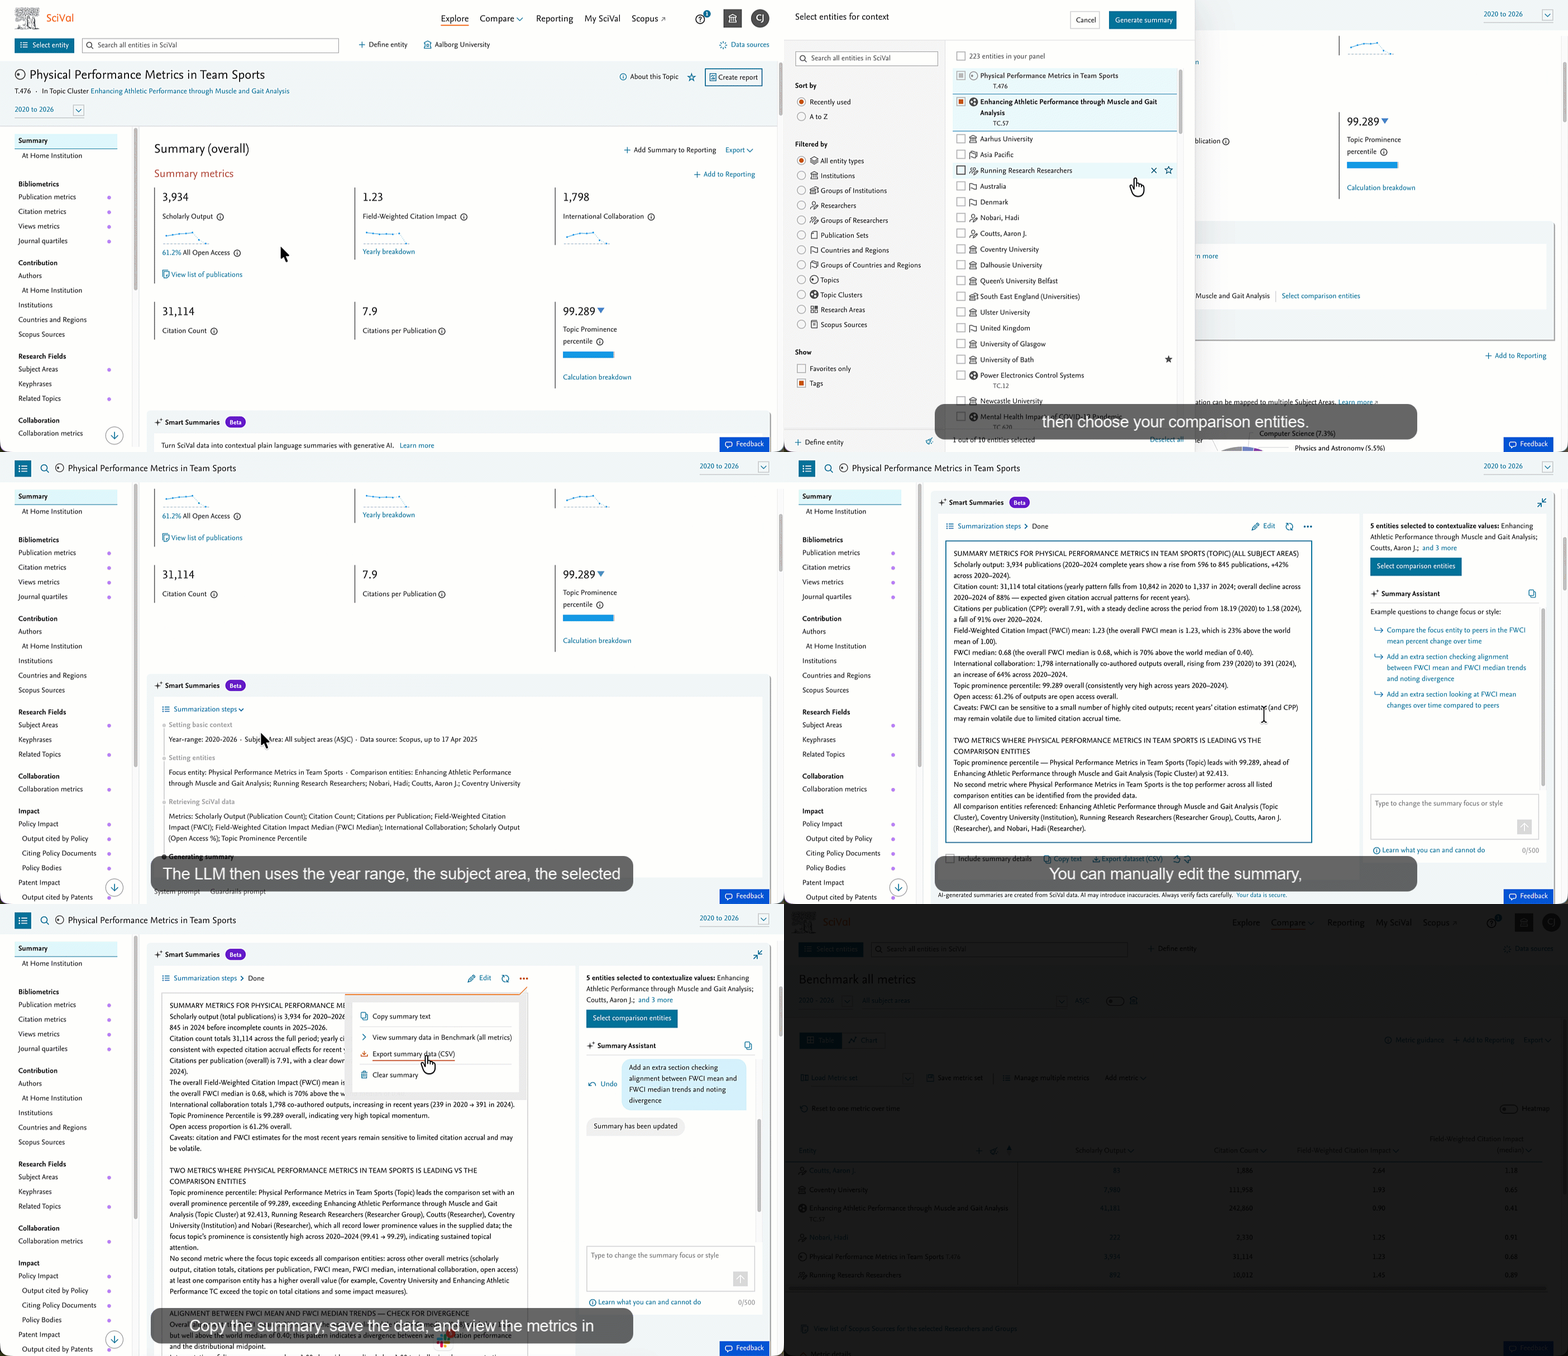
Smart Summaries are now available for all entities and draw on the full breadth of the summary metrics section. With more metrics available, the summary can better contextualize findings and deliver richer, more contextual research insights.
Smart Summaries are now available for all entities and draw on the full breadth of the summary metrics section. With more metrics available, the summary can better contextualize findings and deliver richer, more contextual research insights.
We’ve also improved the prompt in the background to provide metric guidance on the additional metrics, such as Open Access percentage, h-index, h5-index and Prominence Percentile. Go and try it out on any Summary page (Note: Customers must have all core modules – formerly Overview, Benchmarking, Collaboration and Trends - for Smart Summaries to be activated).
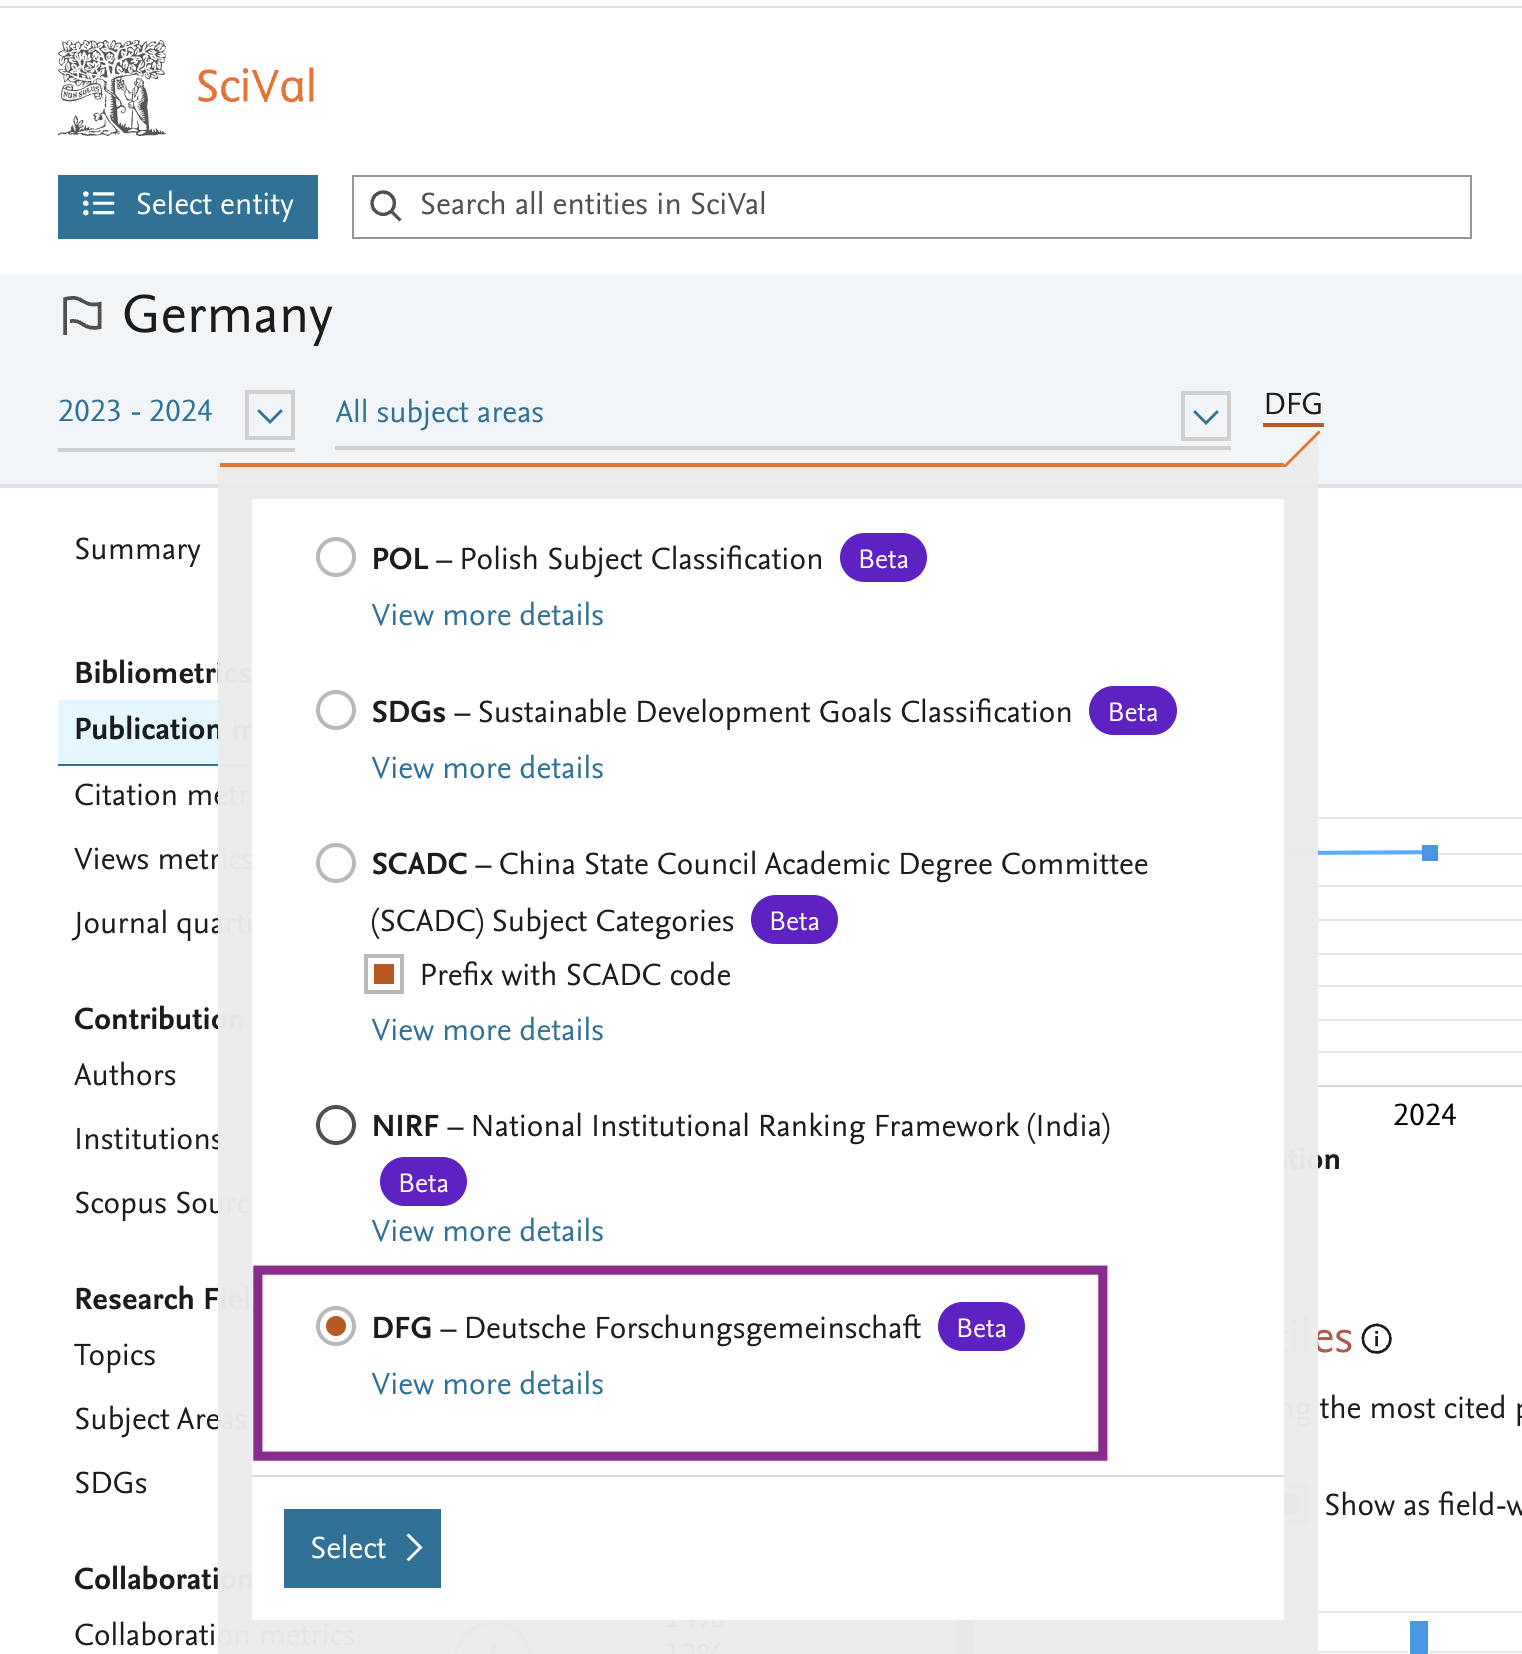
- Analyze any entity’s contribution to the DFG using the new subject classification
Analyze publication output and metrics using the Deutsche Forschungsgemeinschaft (DFG) subject classification, now available for any entity linked to DFG-assigned publications.
The DFG Subject Classification is a structured system used by the Deutsche Forschungsgemeinschaft (DFG) — the German Research Foundation — to organize and categorize a wide range of academic disciplines and research areas for evaluation and funding purposes. You can analyze the 5 broad categories of the DFG subject classification on the indicated Explore pages (purple dots), and in the Compare section under Benchmark (All metrics), and Intersect (Collaboration matrix).
New publications are assigned to their respective subject categories within the classification on a weekly basis.
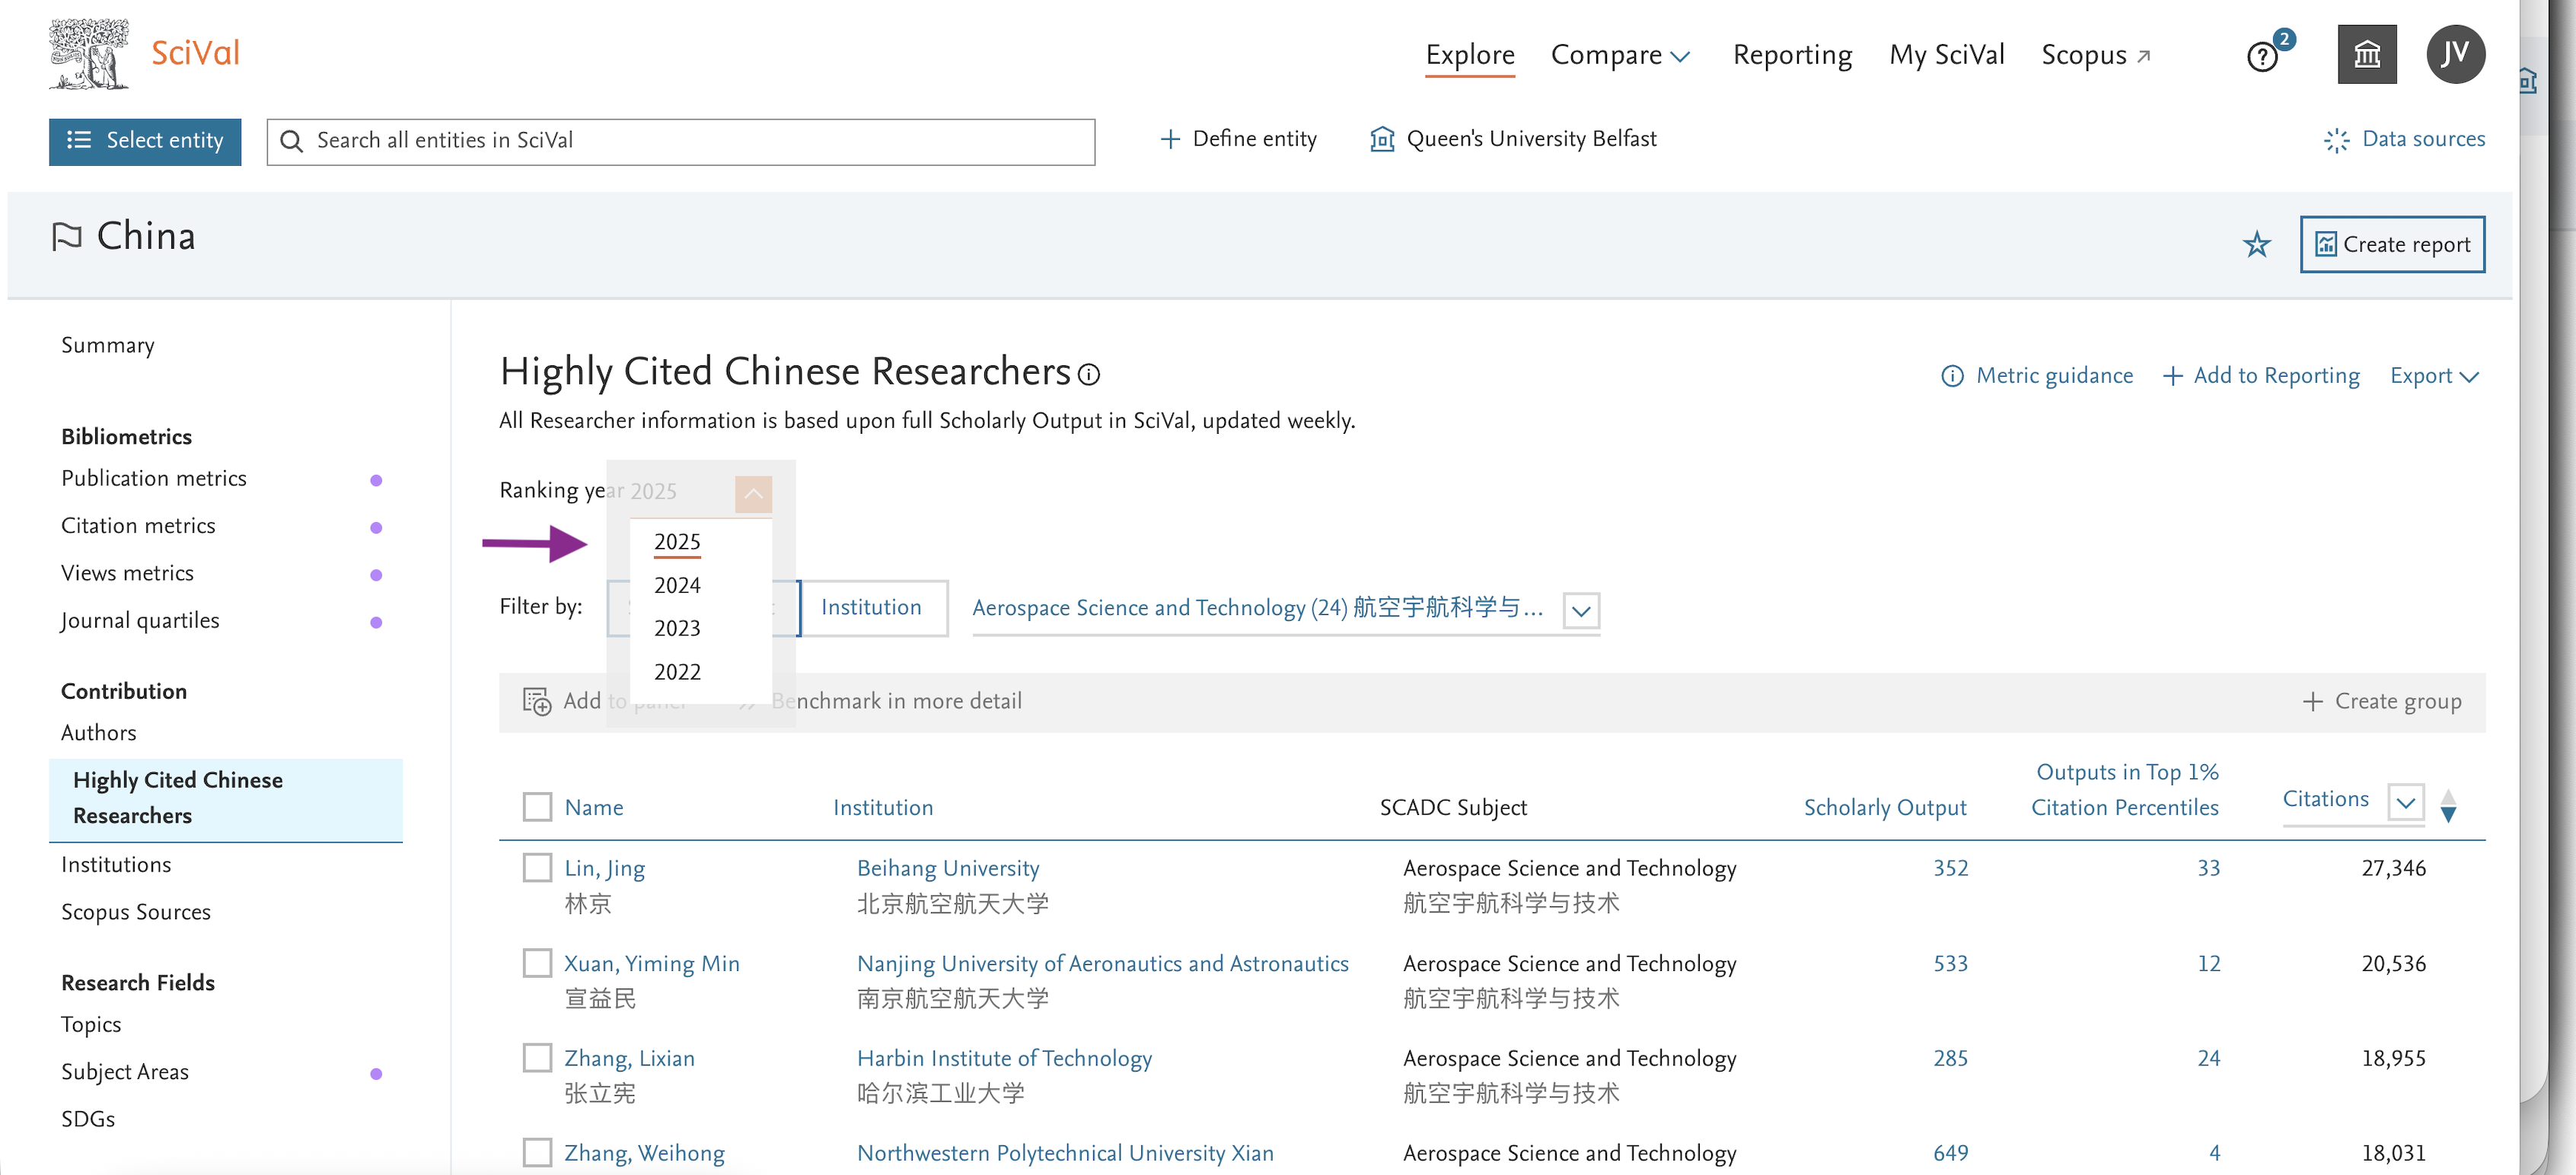
- Highly Cited Chinese Researchers 2025 now available
Check out the recently announced list of Highly Cited Chinese Researchers for 2025, categorized by subject area and institution and updated weekly. This list, released on January 30, 2026, is a collaboration between Elsevier and Shanghai Ranking Consultancy.
For further information please visit Elsevier’s Highly Cited Chinese Researchers web page in Chinese: 中国高被引学者榜单
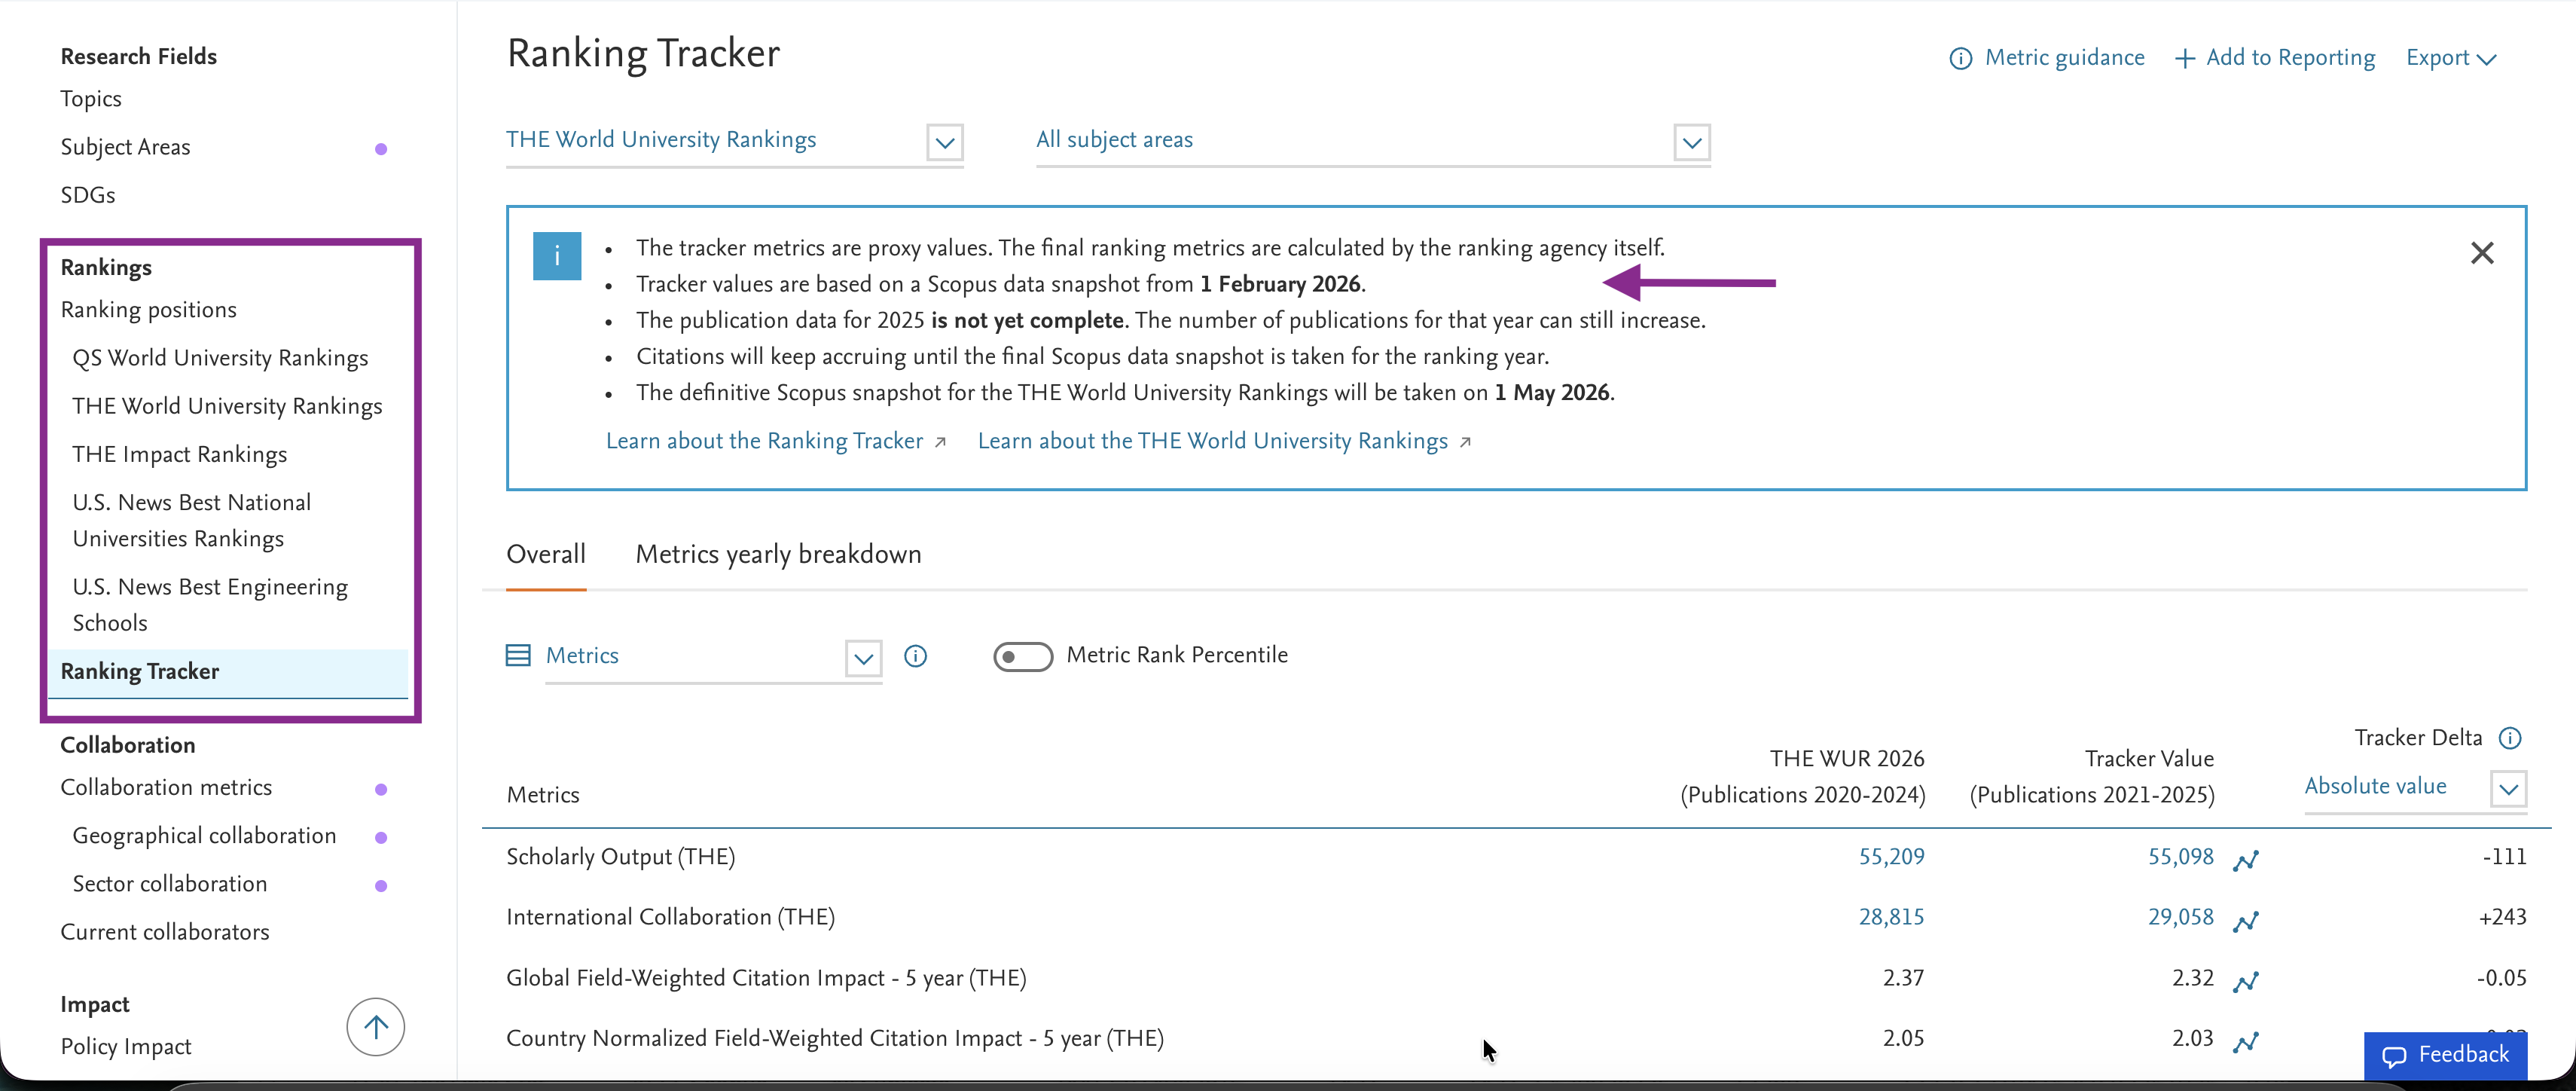
- Review your current performance with the updated Ranking Tracker data for THE World University Ranking
The Ranking Tracker for the THE World University Rankings (WUR) has been updated with the latest Scopus snapshot (1 February 2026). You can now review your current performance across the bibliometric drivers for the upcoming THE WUR 2027 and compare it with the latest published edition (THE WUR 2026).
- Connect with peers at the Elsevier Impact Conference 2026 (San Diego, USA, April 14-16, 2026)
We invite you to join us at the Elsevier Impact Conference (EIC) 2026, taking place April 14–16, 2026 in San Diego, USA. The conference brings together the global communities of Pure, SciVal, Digital Commons, and Interfolio to explore shared challenges, exchange best practices, and drive innovation across research and academic institutions. Attendees will benefit from expert-led sessions, hands-on workshops, and networking opportunities with peers and product teams.
Learn more and register here.
For SciVal users based in EMEA and APAC, a sister conference takes place in Madrid, Spain, November 3-5, 2026. The call for proposals opens in May 2026.
The February 2026 release is dedicated to Hot Springs. Hot springs are natural pools of water heated by geothermal activity beneath Earth’s surface. Often rich in minerals, these waters are believed to have therapeutic properties. The unique combination of warm temperatures and mineral content fosters diverse ecosystems and plays a significant role in local cultural traditions.
The Hot Springs release brings you ‘Smart Summaries’ using generative AI for Researchers, U.S. News Best Engineering Schools Ranking and much more.
- Smart Summaries – AI-generated contextual summaries, now available for Researchers and Researcher Groups
You can now use Smart Summaries to create contextualized, plain language summaries of SciVal analyses for Researchers and Researcher Groups. This continues the planned expansion of Smart Summaries by introducing Researchers and Groups as a selectable focus entity, alongside Institutions, and marks the first step in our broader initiative to extend Smart Summaries to all entities. With this update, users can compare a researcher or group against peer researchers or research groups, among other supported entities, enabling deeper insights and more comprehensive analysis.
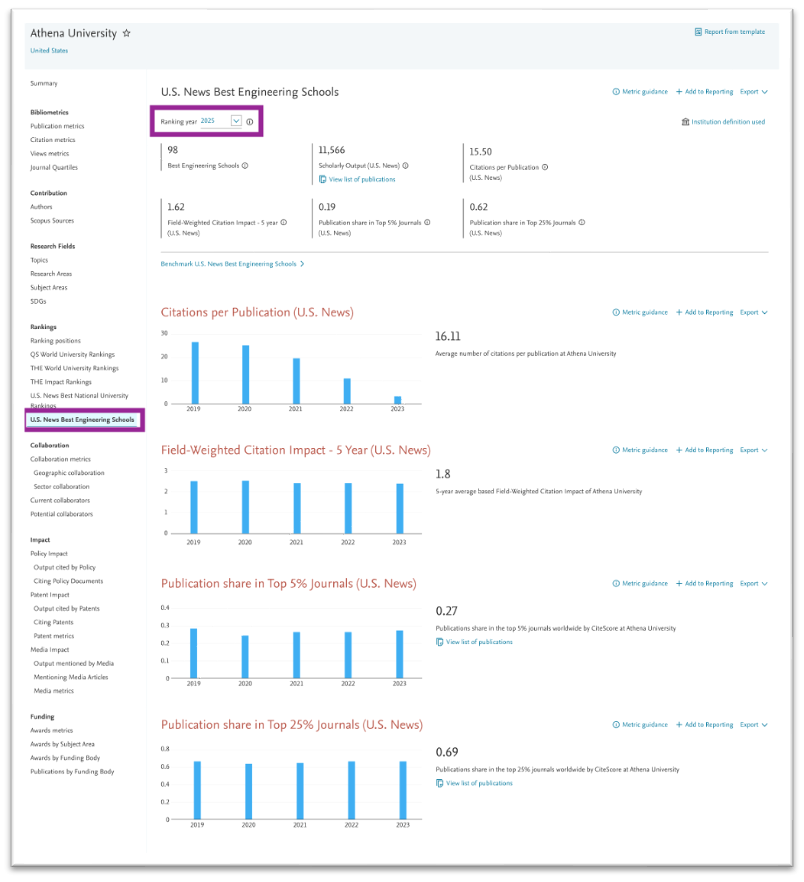
- U.S. News Best Engineering Schools 2025 – Generate insights using the actual bibliometric dataset behind this ranking
We are excited to launch access to the bibliometric datasets used in the 2025 U.S. News Best Engineering Schools rankings (part of the U.S. News Best Graduate Schools) in SciVal. Now, you can generate insights based on the actual bibliometrics considered by U.S. News & World Report for more than 200 colleges in the US, announced on April 8th, 2025. Analyze the drivers behind the U.S. News specific bibliometrics (Citations per Publication, FWCI, Publication shares in the top 5% and 25% of journals by CiteScore) that together contribute 10% to the overall ranking. Export the data and add to reporting to explore further or produce management-level summaries.
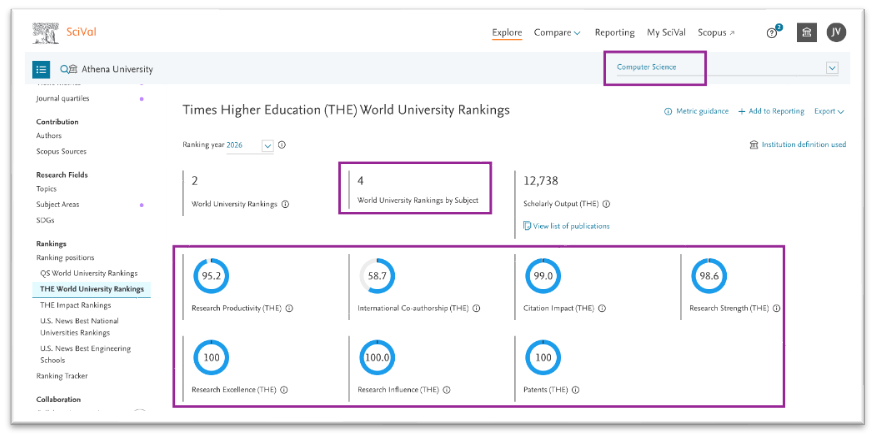
- Subject area-level ranks and scores are now available for the THE World University Rankings by Subject 2026
The THE World University Rankings now feature ranks and scores for individual subject areas (THE World University Rankings by Subject announced on January 21st, 2026). Analyze and understand the underlying bibliometric datasets and their contribution to these ranks and scores, helping you assess your institution’s performance across 11 major THE subject areas.
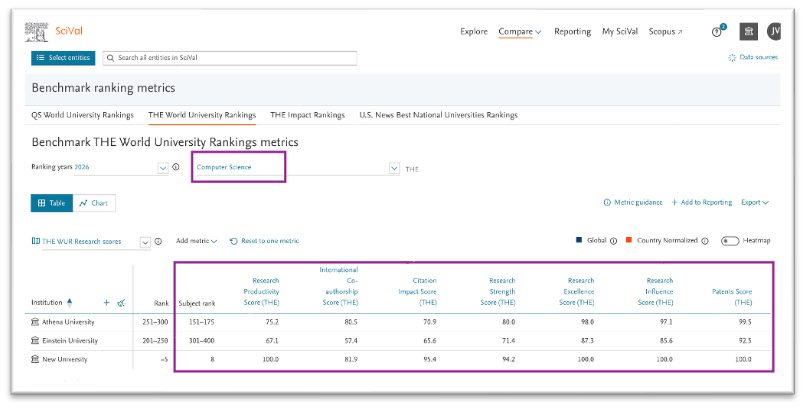
Compare and benchmark the performance of peer institutions using the Compare section in SciVal for subject ranking and easily export this data for comprehensive reporting and inform rankings strategies.
- US OSTP focus areas updated
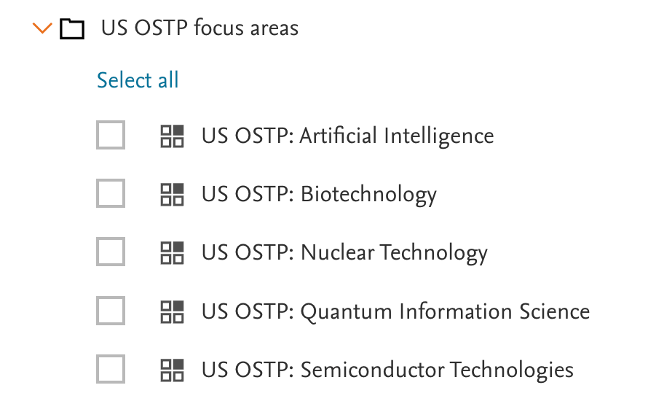
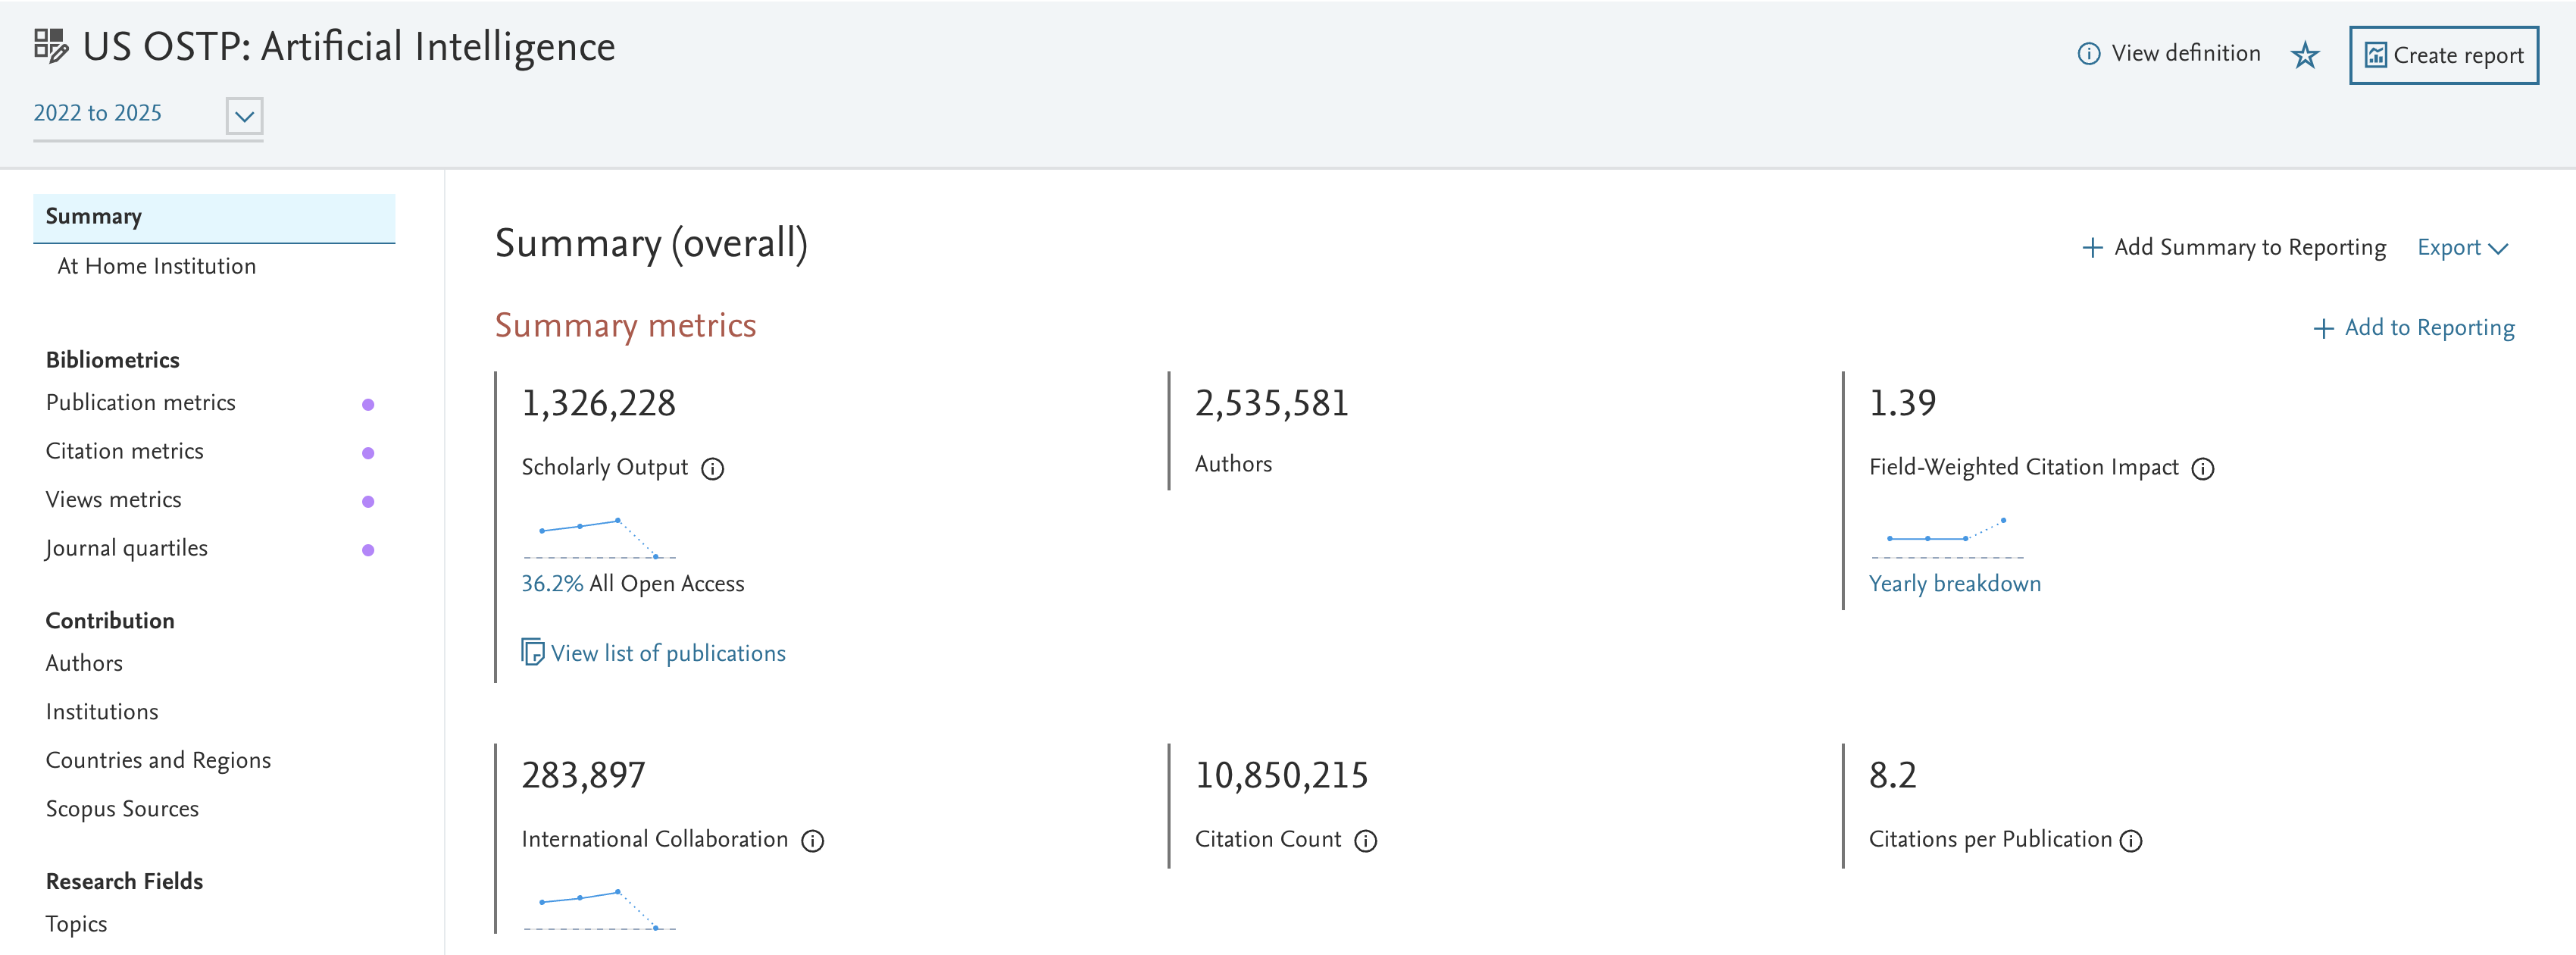
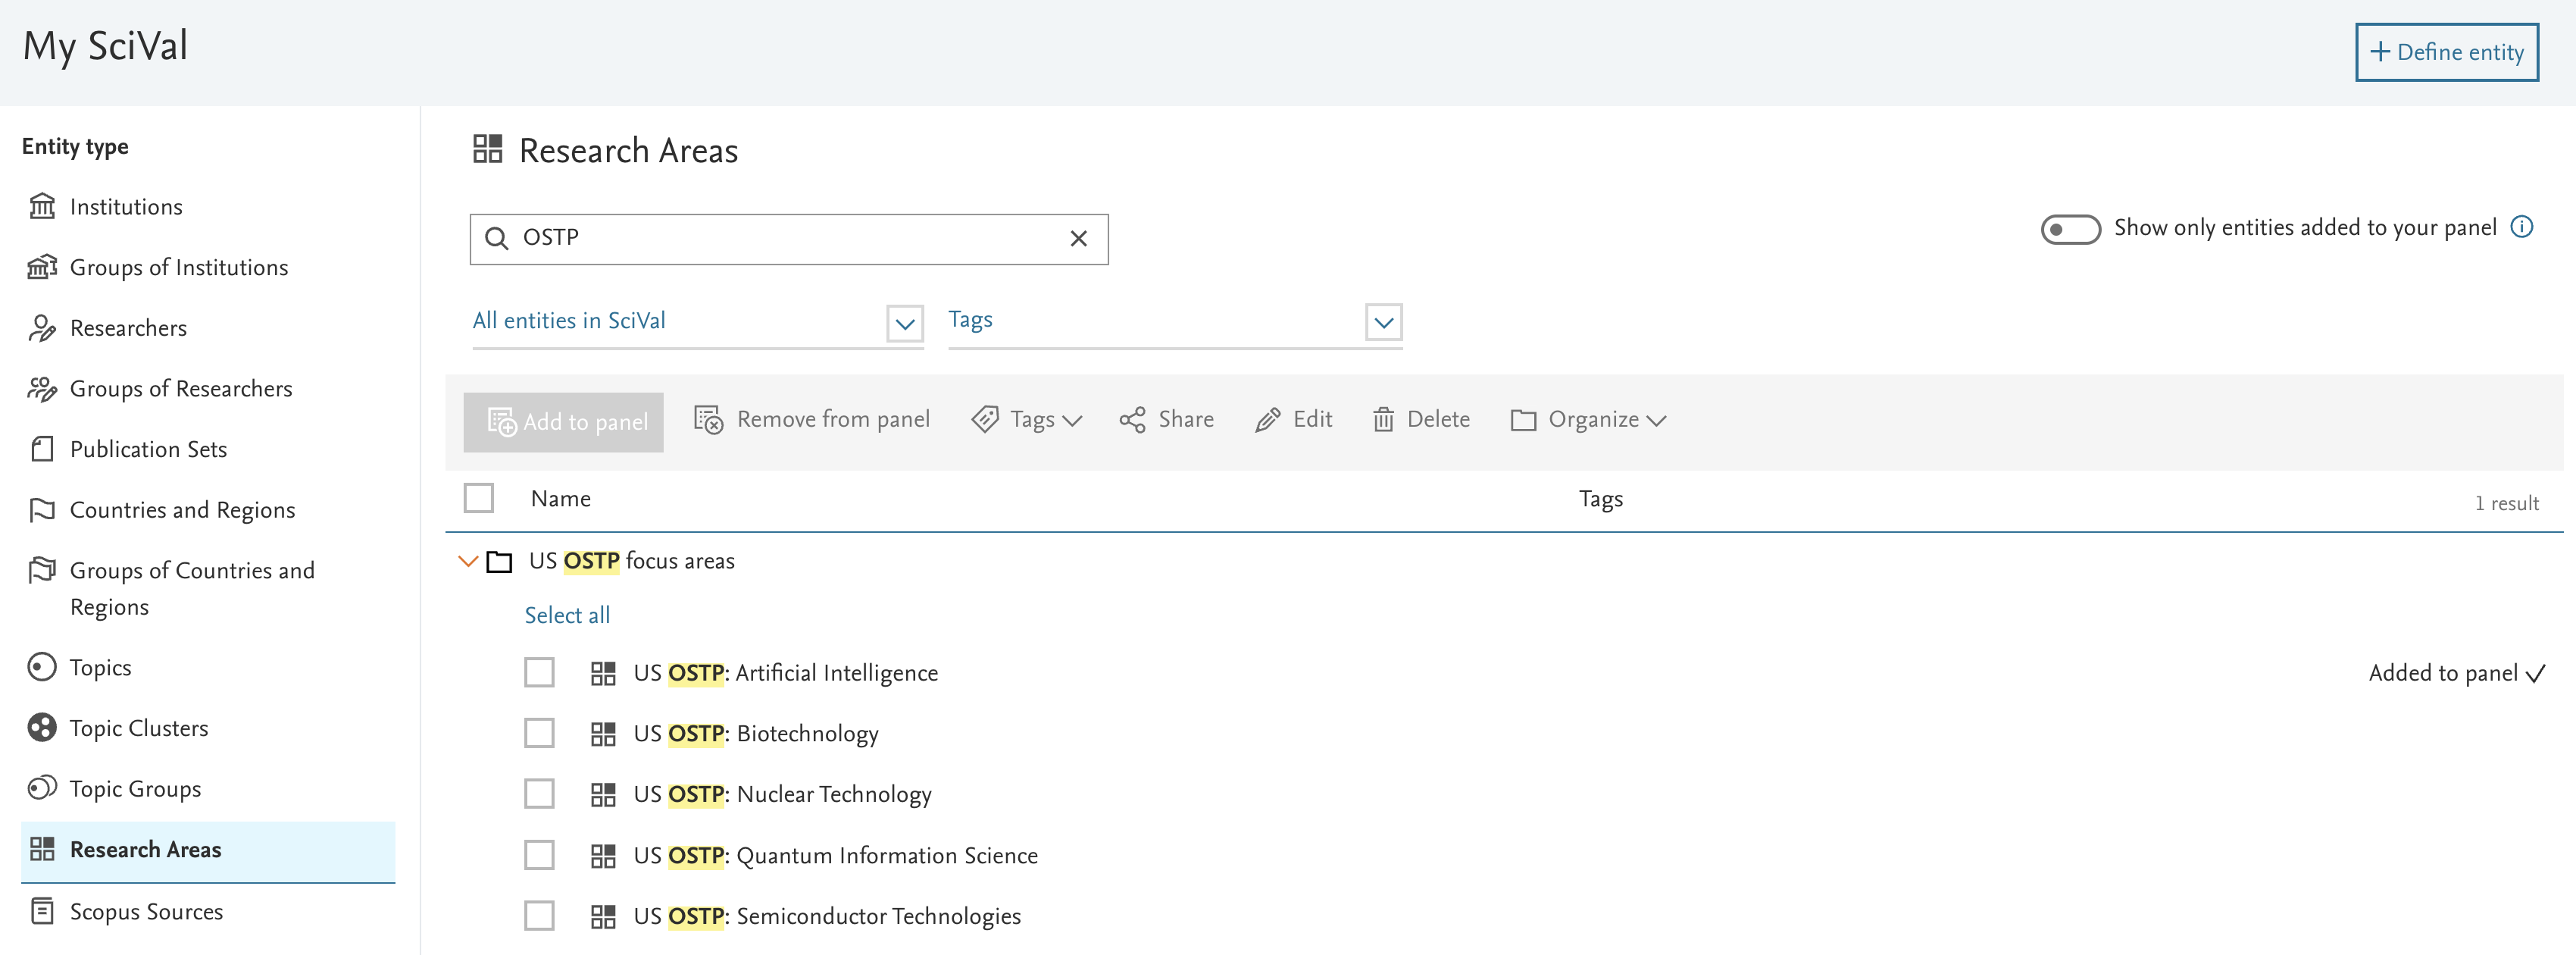
The OSTP Research Areas in SciVal represent 5 OSTP focus areas: Artificial Intelligence, Quantum Information Science, Nuclear Technology, Biotechnology, and Semiconductors. They’ve been updated and now contain data from 1996 to 2024, with a datacut from 9th Dec 2025.
The December 2025 release is dedicated to Glaciers. Glaciers are massive, slow-moving ice bodies formed from compacted snow, found in polar and mountainous regions. They shape landscapes, serve as vital freshwater sources, and act as key indicators of climate change. Recent research highlights the accelerated retreat of glaciers due to rising temperatures, contributing to sea-level rise and impacting ecosystems. Advances in satellite monitoring and modeling are enhancing predictions of glacier behavior, aiding climate policy and risk management for communities that depend on them.
The Glaciers release brings you “Smart Summaries” using Generative AI on the summary page, the Ranking tracker being updated for the upcoming THE WUR ranking edition, new fields added to the publication link modals and much more.
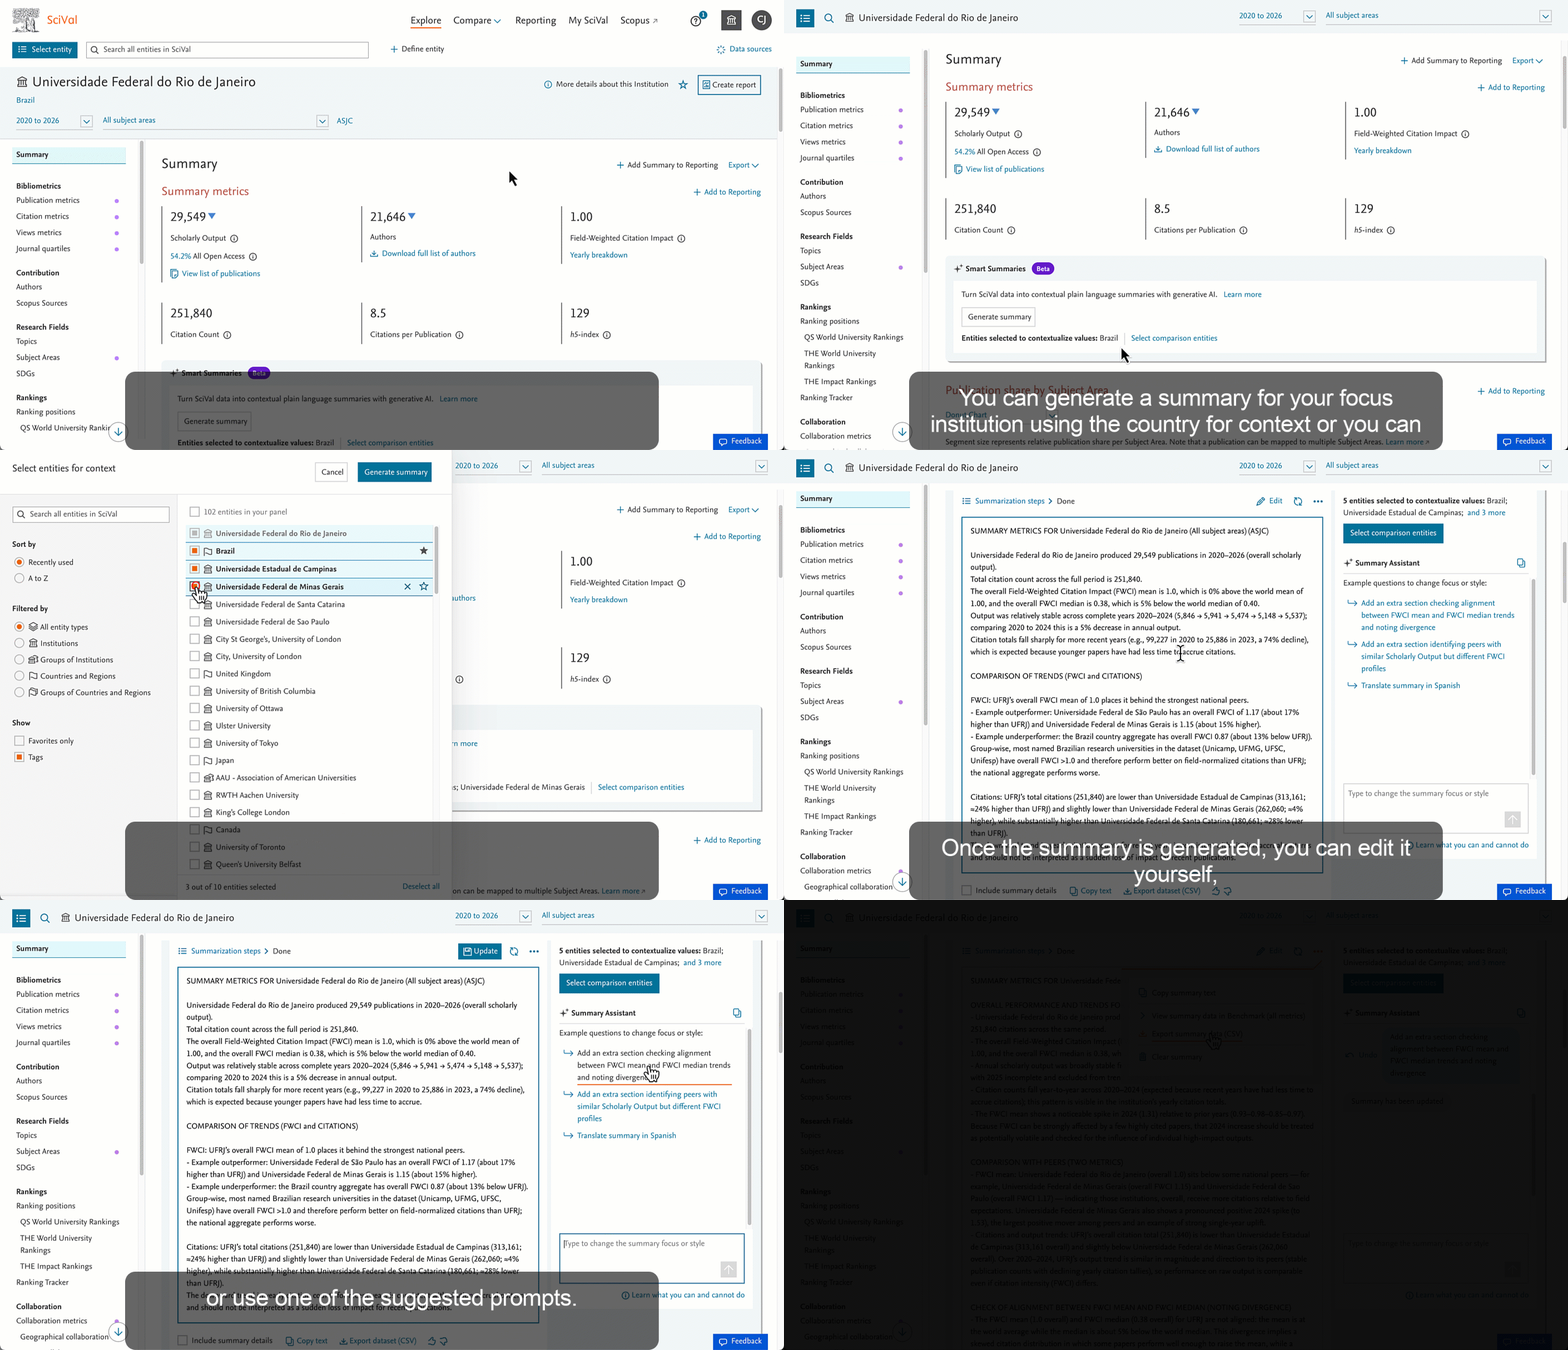
- Smart Summaries - Create contextualized plain language summaries of SciVal analyses using generative AI
Streamline report creation with clear, contextual overviews of SciVal analyses, making insights easy to understand for all team members, regardless of bibliometric expertise. An AI-driven natural-language interface lets you quickly refine summaries or translate them into other languages. Available on the Summary metrics page for Institutional entities and for customers with the core modules (legacy modules of Overview, Benchmarking, Collaboration and Trends). Try out Smart Summaries
- Ranking Tracker - track your progress across the bibliometrics used in the upcoming THE World University Rankings
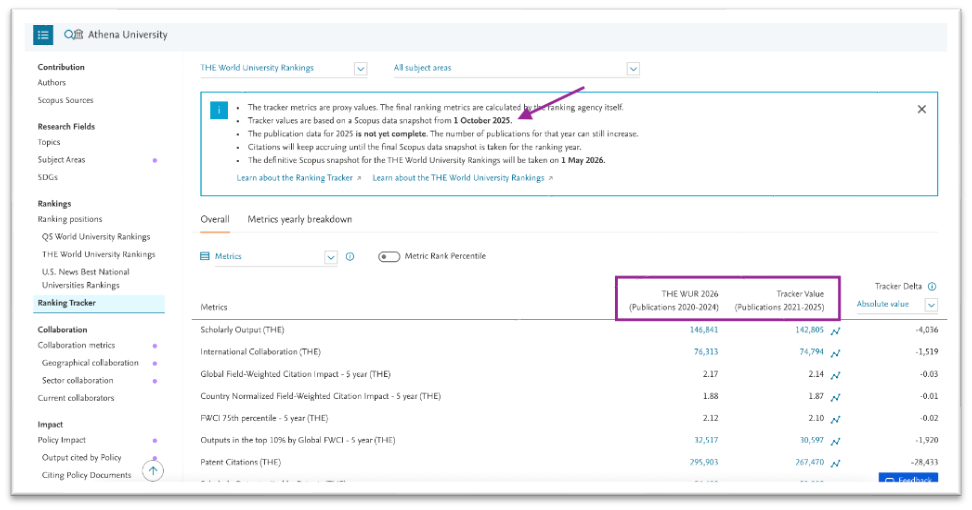
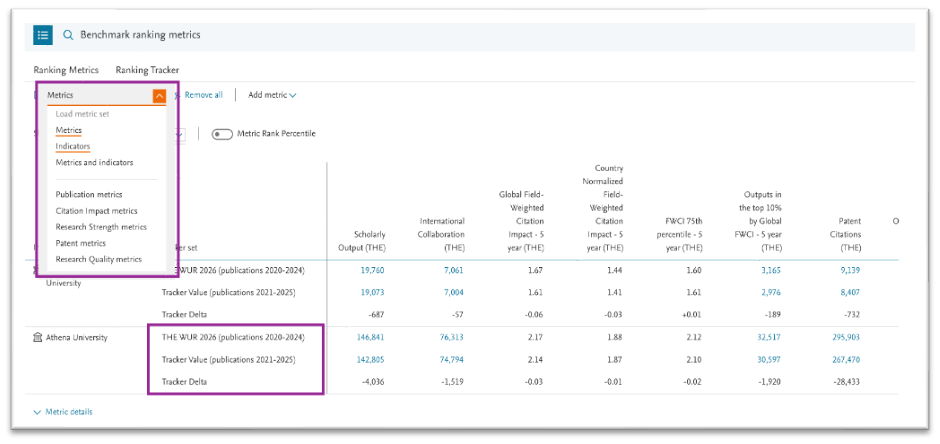
We are excited to announce that the “Ranking tracker” for THE World University Rankings are now updated with the latest Scopus Snapshot (1st October 2025), applying the same methodology outlined by THE for the final rankings (THE WUR 2027). This enables you to see your current performance across the bibliometric drivers and in comparison to the latest published ranking edition (THE WUR 2026). The insights are also provided per THE Subject Area, providing rich insights, within the ranking cycle, to inform plans and decision making.
You can compare and benchmark your performance to peer institutions in Compare and easily populate the comparison table using the predefined metric sets.
- Expansion of Export Fields in Publication Link Modals
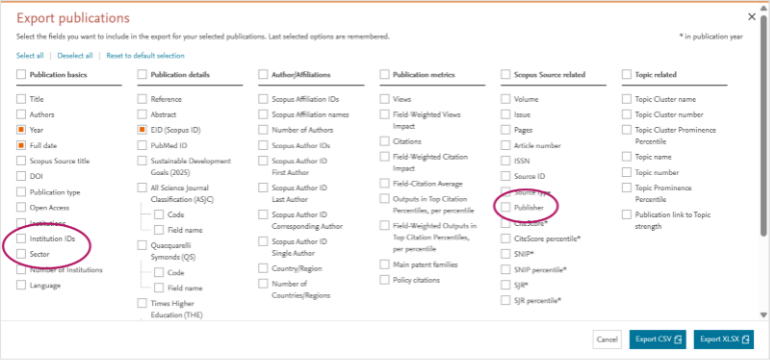
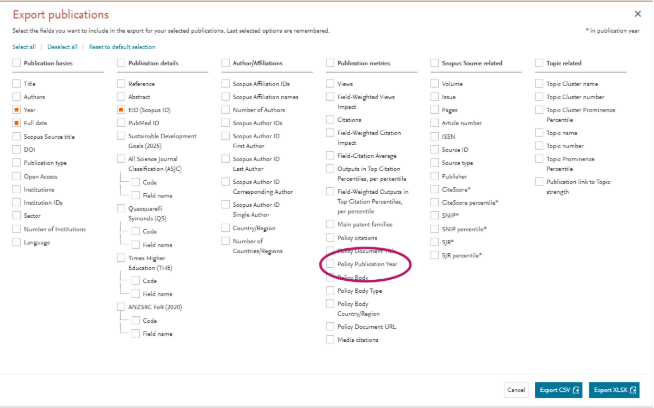
We’ve expanded the set of fields available when exporting data from the Publication Link modals. This enhancement gives you more context, greater analytical flexibility, and makes it easier to work with SciVal data across different export types. The following fields are now available in all Publication Link modal exports:
- Publisher name is now available for publications, enabling deeper insights into where your researchers publish and how publishing patterns evolve over time.
- Institution sectors help you explore collaboration structures beyond what the UI supports today. With exports, you can now:
- Identify “triangle collaborations” (e.g., Academic + Corporate + Medical).
- Detect collaborations without an academic starting point—such as Corporate + Government—which are not represented in the interface.
- Institution IDs make it easier to reconcile data when combining outputs from different exports.
- Year of publication for policy documents provides additional transparency when working with policy metrics (available on the Policy Impact page with the Impact subscription).
- Source ID and Source Type added to Scopus Sources Exports
We’ve added two additional fields to the Scopus source (Table view) export available in the Contribution page group (for all entity types except Institutions). Exports now include Source ID and Source Type, making it easier to match sources across different files and quickly identify the type of source (e.g., journal, conference proceeding, trade publication, book, etc.).
- Removal of Selected Pages Now Taking Effect
As shared in our previous release notes, some low-usage pages are being removed with this release so we can focus our development efforts on highly requested features and upcoming improvements. The following pages are now being sunset:
- Potential Collaborators – Institutions and Countries
Entities: Institutions, Countries
(The feedback survey for this page will remain available a bit longer if you would still like to share your input.) - Media Metrics
Entities: Institutions (in Explore and Compare) - Research Fields – Keyphrases – Top Contributors
Entities: Topics/Topic Clusters, Research Areas, Publication Sets - Collaboration – Current Collaborators (Institutions)
Entities: Researcher Groups
This page is being temporarily removed while we improve the underlying logic to deliver more accurate results. An enhanced version of the page will be re-released in Q1 2026.
If you previously relied on any of these pages and would like to provide feedback,
please feel free to reach out—we value your insights as we continue improving SciVal.
The November 2025 release is dedicated to fossil formation. Fossils are preserved remains or traces of ancient organisms, formed when they are rapidly buried and mineralized over time. These records provide valuable insights into the history of life, evolution, and past environments on Earth. Recent advances have revealed well-preserved soft tissues, molecular fossils, and rapid fossilization in extreme environments. Additionally, AI and 3D imaging technologies are revolutionizing fossil analysis, deepening our understanding of Earth’s history and evolution.
The Fossil release brings you the “Ranking Tracker” for QS World University Rankings, enhancements to the Impact pages, more pages with flexible year ranges, additional subject classifications and much more.
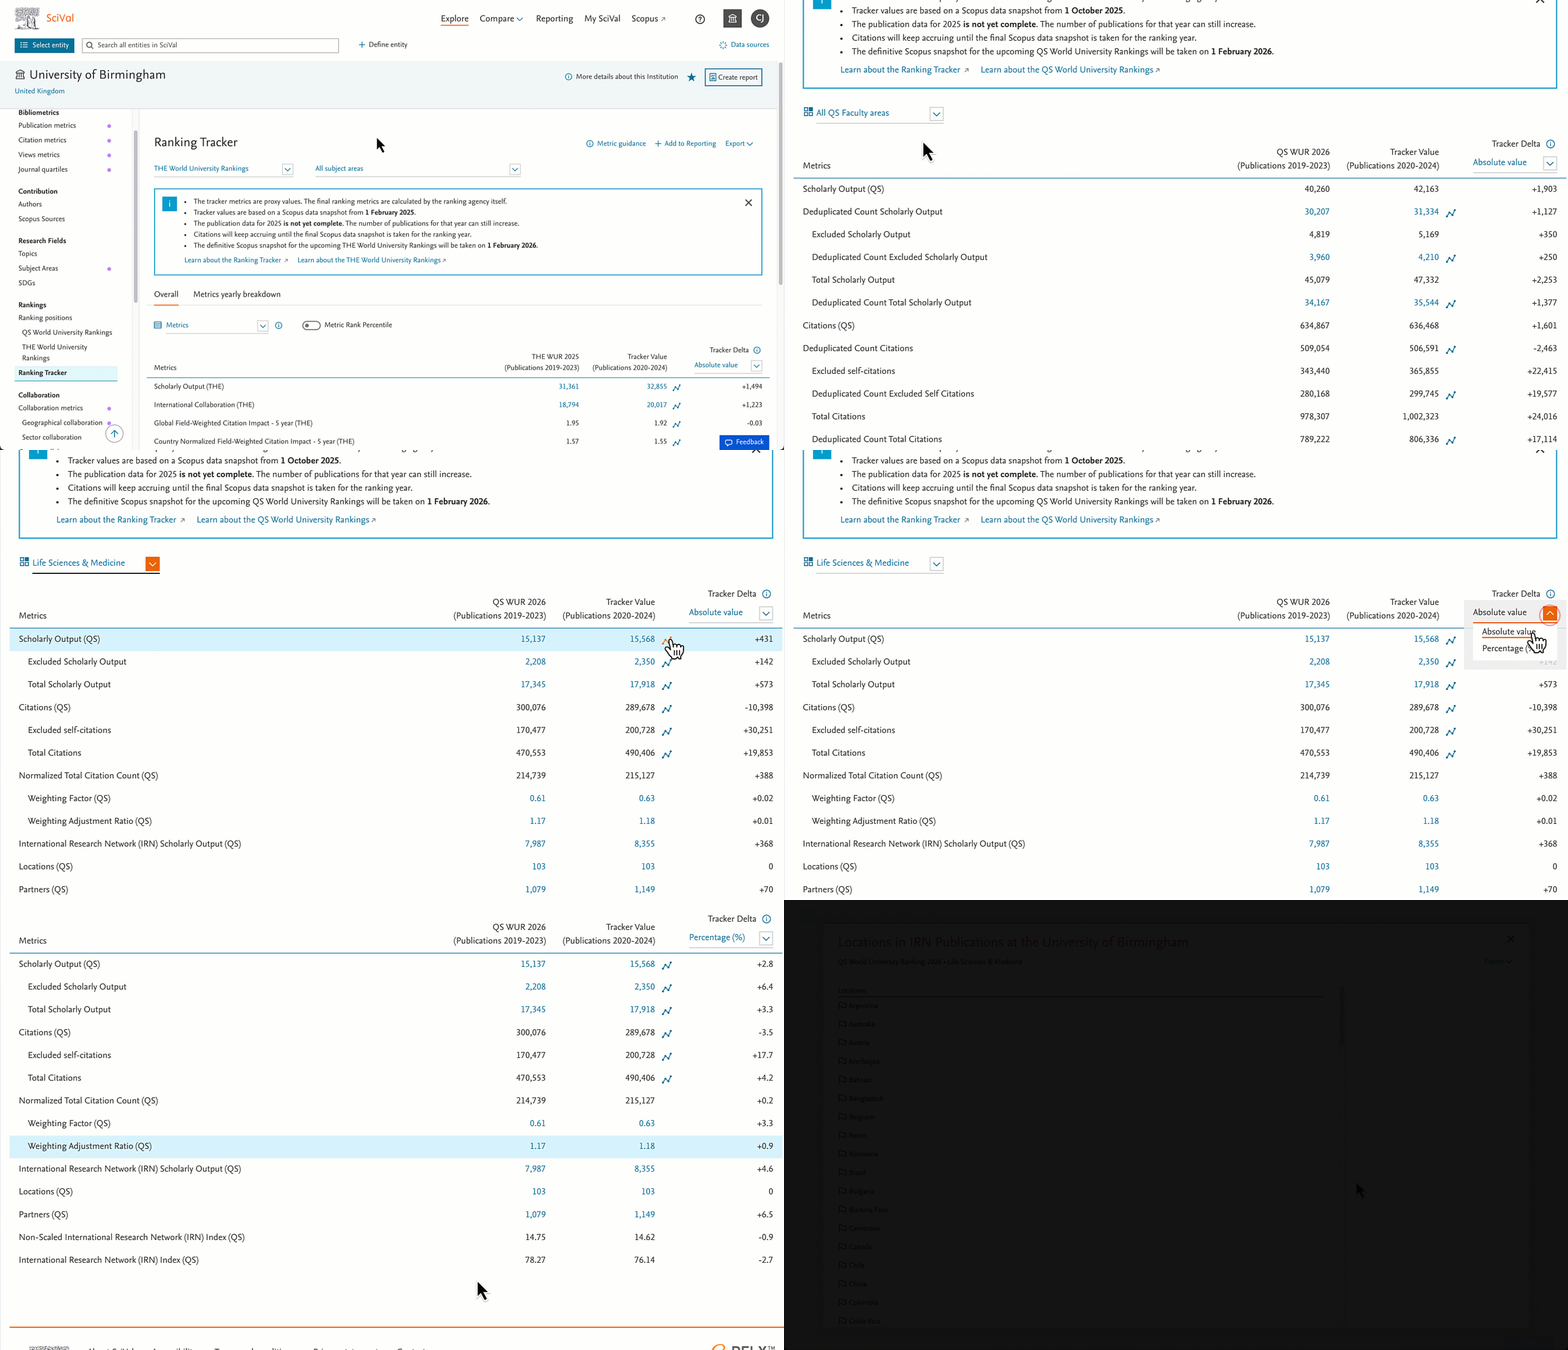
- “Ranking Tracker” for QS World University Rankings - track your progress in the bibliometrics for the upcoming QS World University Rankings in Explore
We are excited to launch the “QS World University rankings” within the “Ranking Tracker”, to enable you to assess your progress in the bibliometrics contributing to the upcoming ranking edition. Using an interim Scopus data snapshot (1st October 2025) and applying the same methodology outlined by QS for the final rankings (QS WUR 2027), you can understand your current performance across the bibliometric drivers and compare it to the latest published edition (QS WUR 2026).
Gain deeper insights into key metrics such as Normalized Total Citation Count (NTCC) and the International Research Network (IRN) index, overall and per QS faculty area. These rich insights enable you to make informed plans and decisions.
Want to know more about the Ranking tracker? Visit the Ranking tracker FAQ in the support center.
- Redesigned Impact pages for Policy and Patents
We’ve redesigned the Impact pages in SciVal to make key insights easier to find, improve consistency across data types, and create space for new functionality. The new page layout brings together analyses that were previously spread across multiple pages or hidden in pop-up modals.
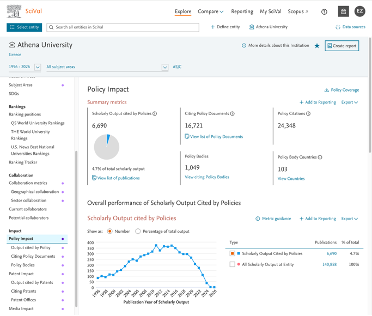
For Policy data, the Policy Impact and Policy Metrics pages, along with the “Analyze in more detail” modal content, have been combined into a single Policy Impact page. For Patent data, the Patent Impact and Patent Metrics pages have similarly been merged into one Patent Impact page.
Chart visualizations have also been enhanced — you can now choose which values to visualize when comparing total scholarly output with output cited by policies or patents.
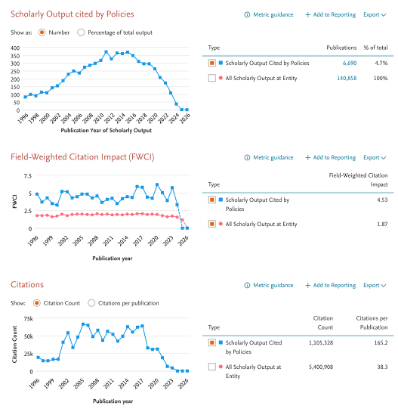
The Policy and Patent Impact pages are available for all entity types with a subscription to Impact but only for Institution entities without a subscription to Impact.
In addition, the former Geographical Spread sections for Policy and Patent Impact have been moved to their own dedicated pages to provide more space and detail. The new pages are called Policy Bodies and Patent Offices. For Policy data, the page now combines the geographical reach of your policy impact at country level with the list of citing policy bodies (previously available in a pop-up modal), in the table view. You can also switch between two views using the toggle at the top — a list of individual policy bodies or an aggregated country view that can be expanded to reveal the underlying policy bodies.
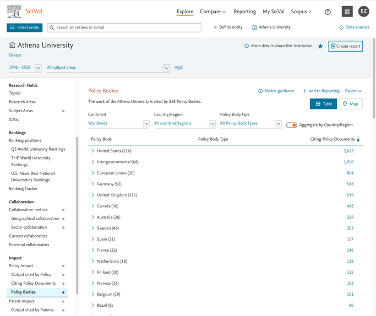
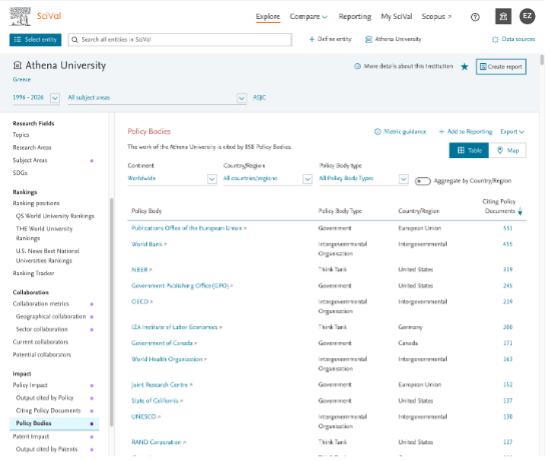
Both the Policy Bodies and Patent Offices pages now also support “Add to Reporting”, allowing you to add the analysis currently displayed to a report.
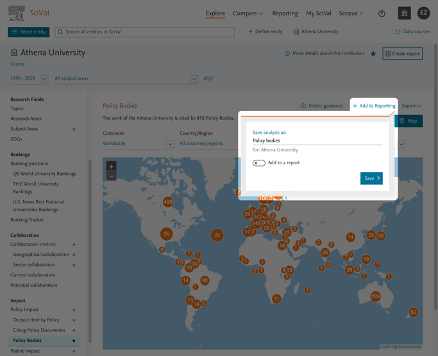
The Policy Bodies and Patent Offices pages are available for all entity types with an Impact subscription
- Flexible year ranges and additional subject classifications on Current Collaborators pages for Researcher entities
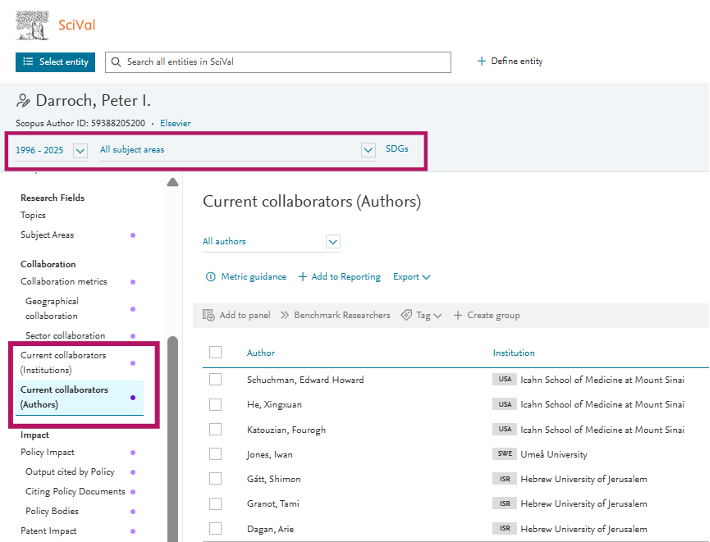
Two more pages have been migrated to the new technologies enabling additional flexibility: The “Current Collaborators (Authors)” and “Current Collaborators (Institutions)” pages available for Researcher entities now support flexible year range selection (1996 – present) and all subject classifications available in SciVal.
Pages that have been migrated are indicated with a purple dot in the page navigation.
- Removal of Selected Pages and Features
To focus our development efforts on the most valuable features and new functionality, we’re removing a few pages that served limited use cases and have seen low usage. This allows us to invest more in improving the parts of SciVal that deliver greatest value to our users. If you rely on any of these pages or would like to share feedback about their removal, please don’t hesitate to reach out to us by using the feedback button at the bottom of any SciVal page.
(a) Pages and features recently removed from SciVal
(1) Research Fields – Topics (by Group Member)
Entities: Groups of Institutions only
We have already received feedback from users about the importance of this feature, and we are working on bringing it back in the coming months.
(2) Collaboration – Current Collaborators – Details modal - Top co-authors of co-authors
Entities: Institutions and Countries
(b) Upcoming Removals
Pages that will become permanently unavailable on Dec 9th, 2025
(3) Research Fields - Keyphrases - Top Contributors
Entities: Topics/Topic Clusters, Research Areas, Publication Sets
You can still explore top contributor insights in the publication modals on the Keyphrases page, where you can view more than just the top five contributors. Learn more
(4) Collaboration - Potential Collaborators
Entities: Institutions and Countries
We are exploring more effective alternatives and would value your input — if you have suggestions, please share your thoughts through our short survey.
(5) Impact - Media Metrics
Entities: Institutions
Media mentions data has not been updated in SciVal since January 2024. We are working to
replace it with media citations data in 2026.
Pages that will become temporarily unavailable on Dec 9th, 2025
(6) Collaboration – Current Collaborators (Institutions)
Entities: Researcher Groups
This page will be temporarily hidden while we work on improved logic to deliver more accurate results. An enhanced version of this page is planned for re-release in Q1 2026.
The second phase of the Eclipses release brings you the bibliometric dataset for the THE World University Rankings 2026 and U.S. News Best National University Rankings 2026.
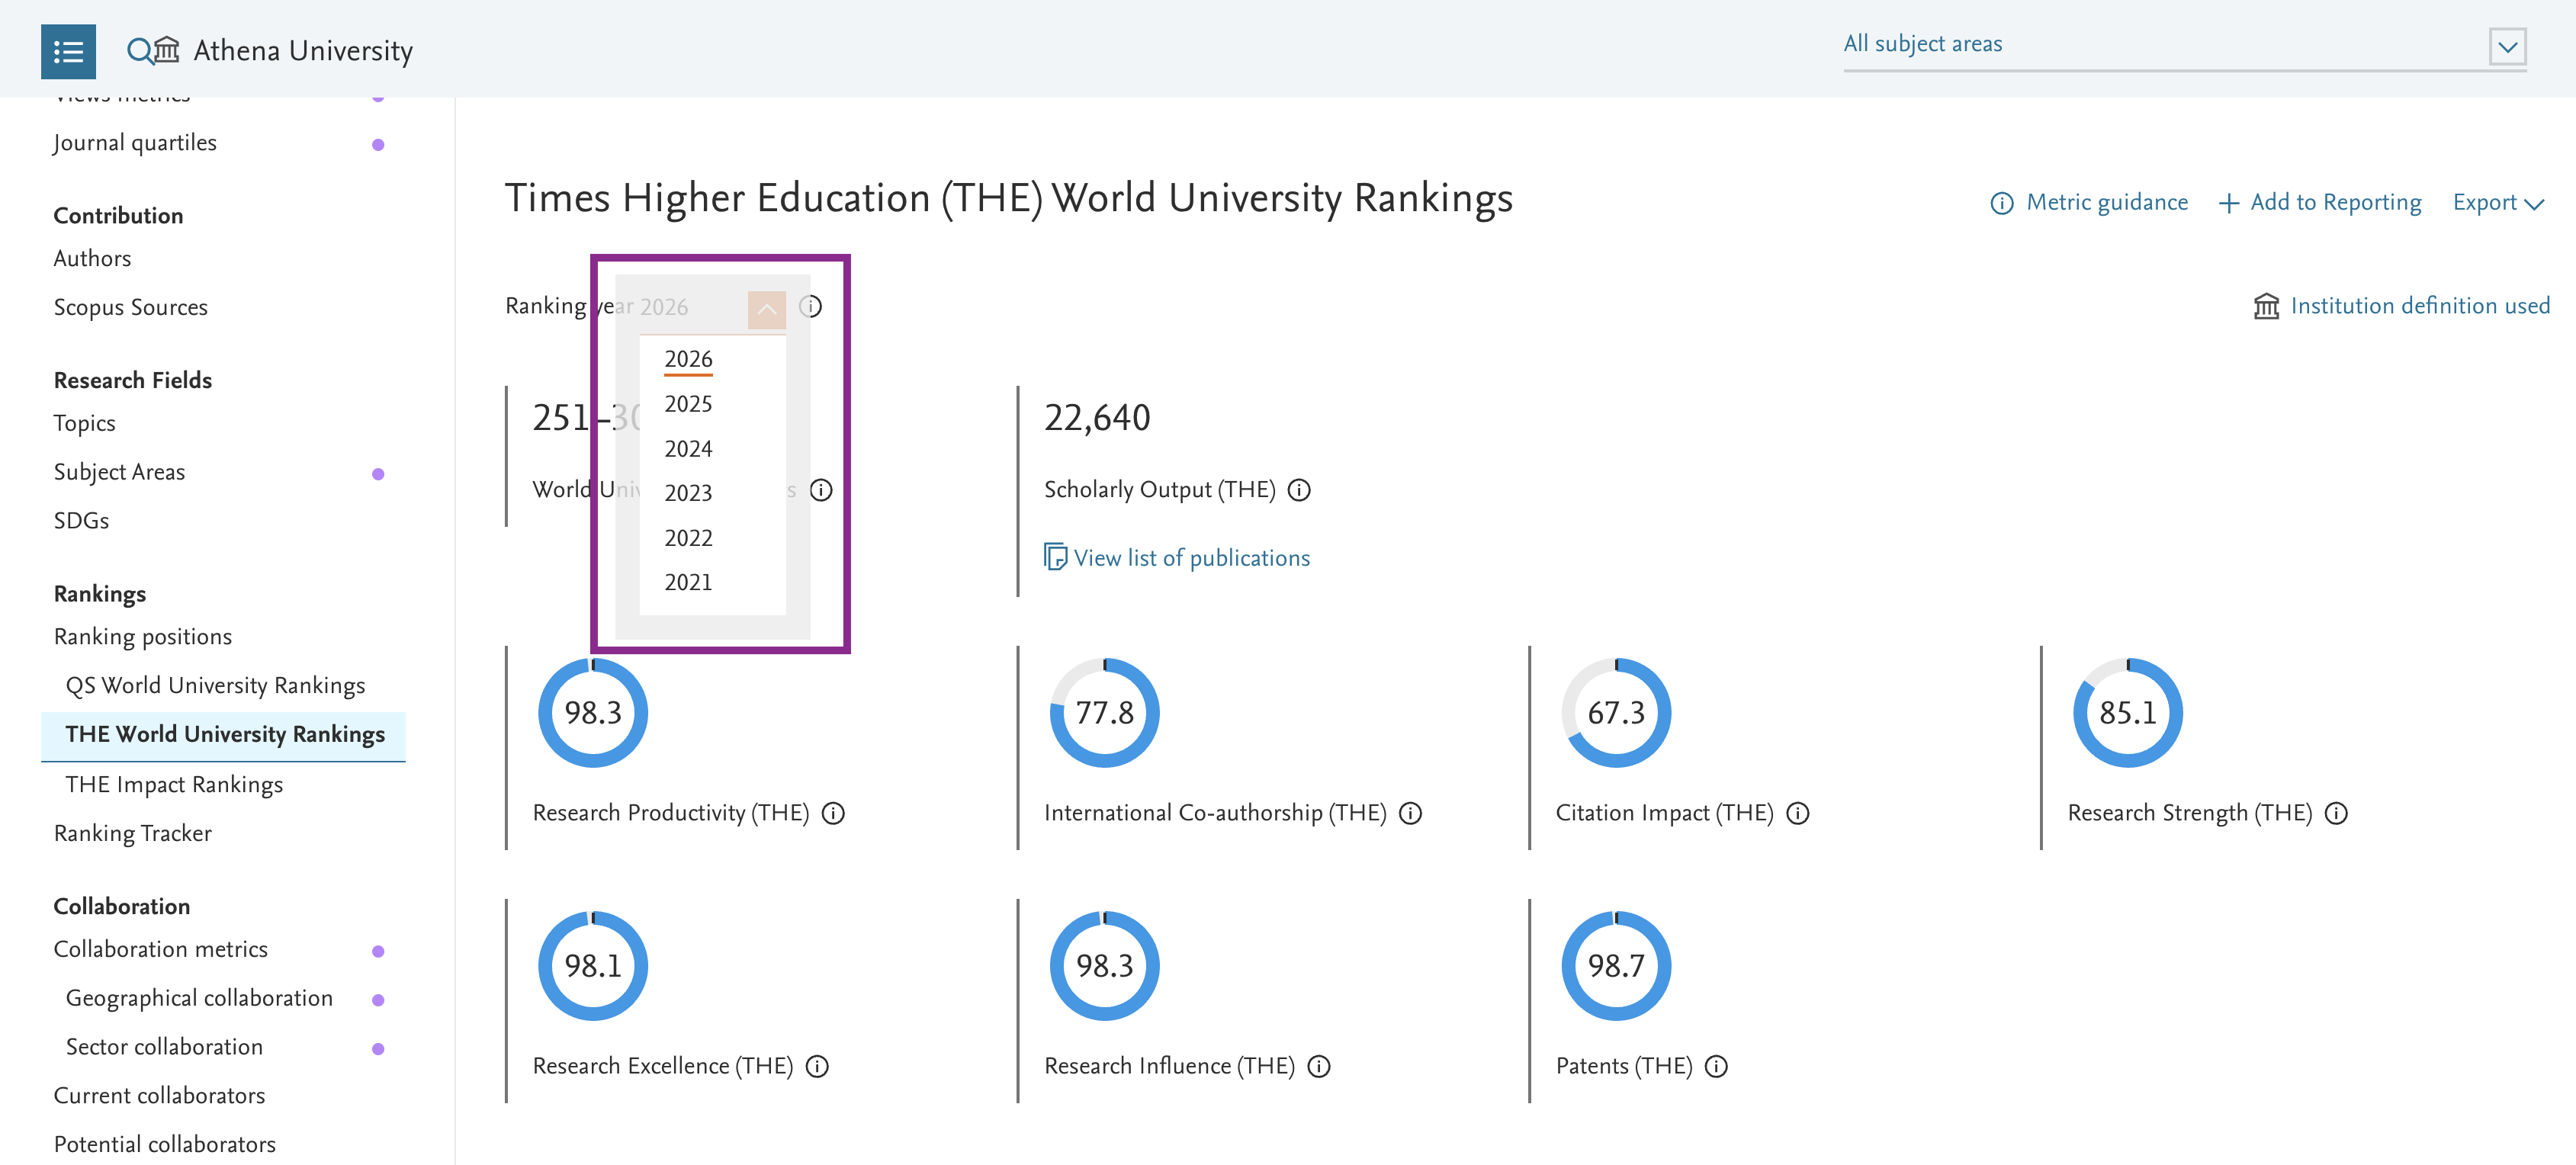
- THE World University Rankings 2026 bibliometric dataset is available for analysis and benchmarking
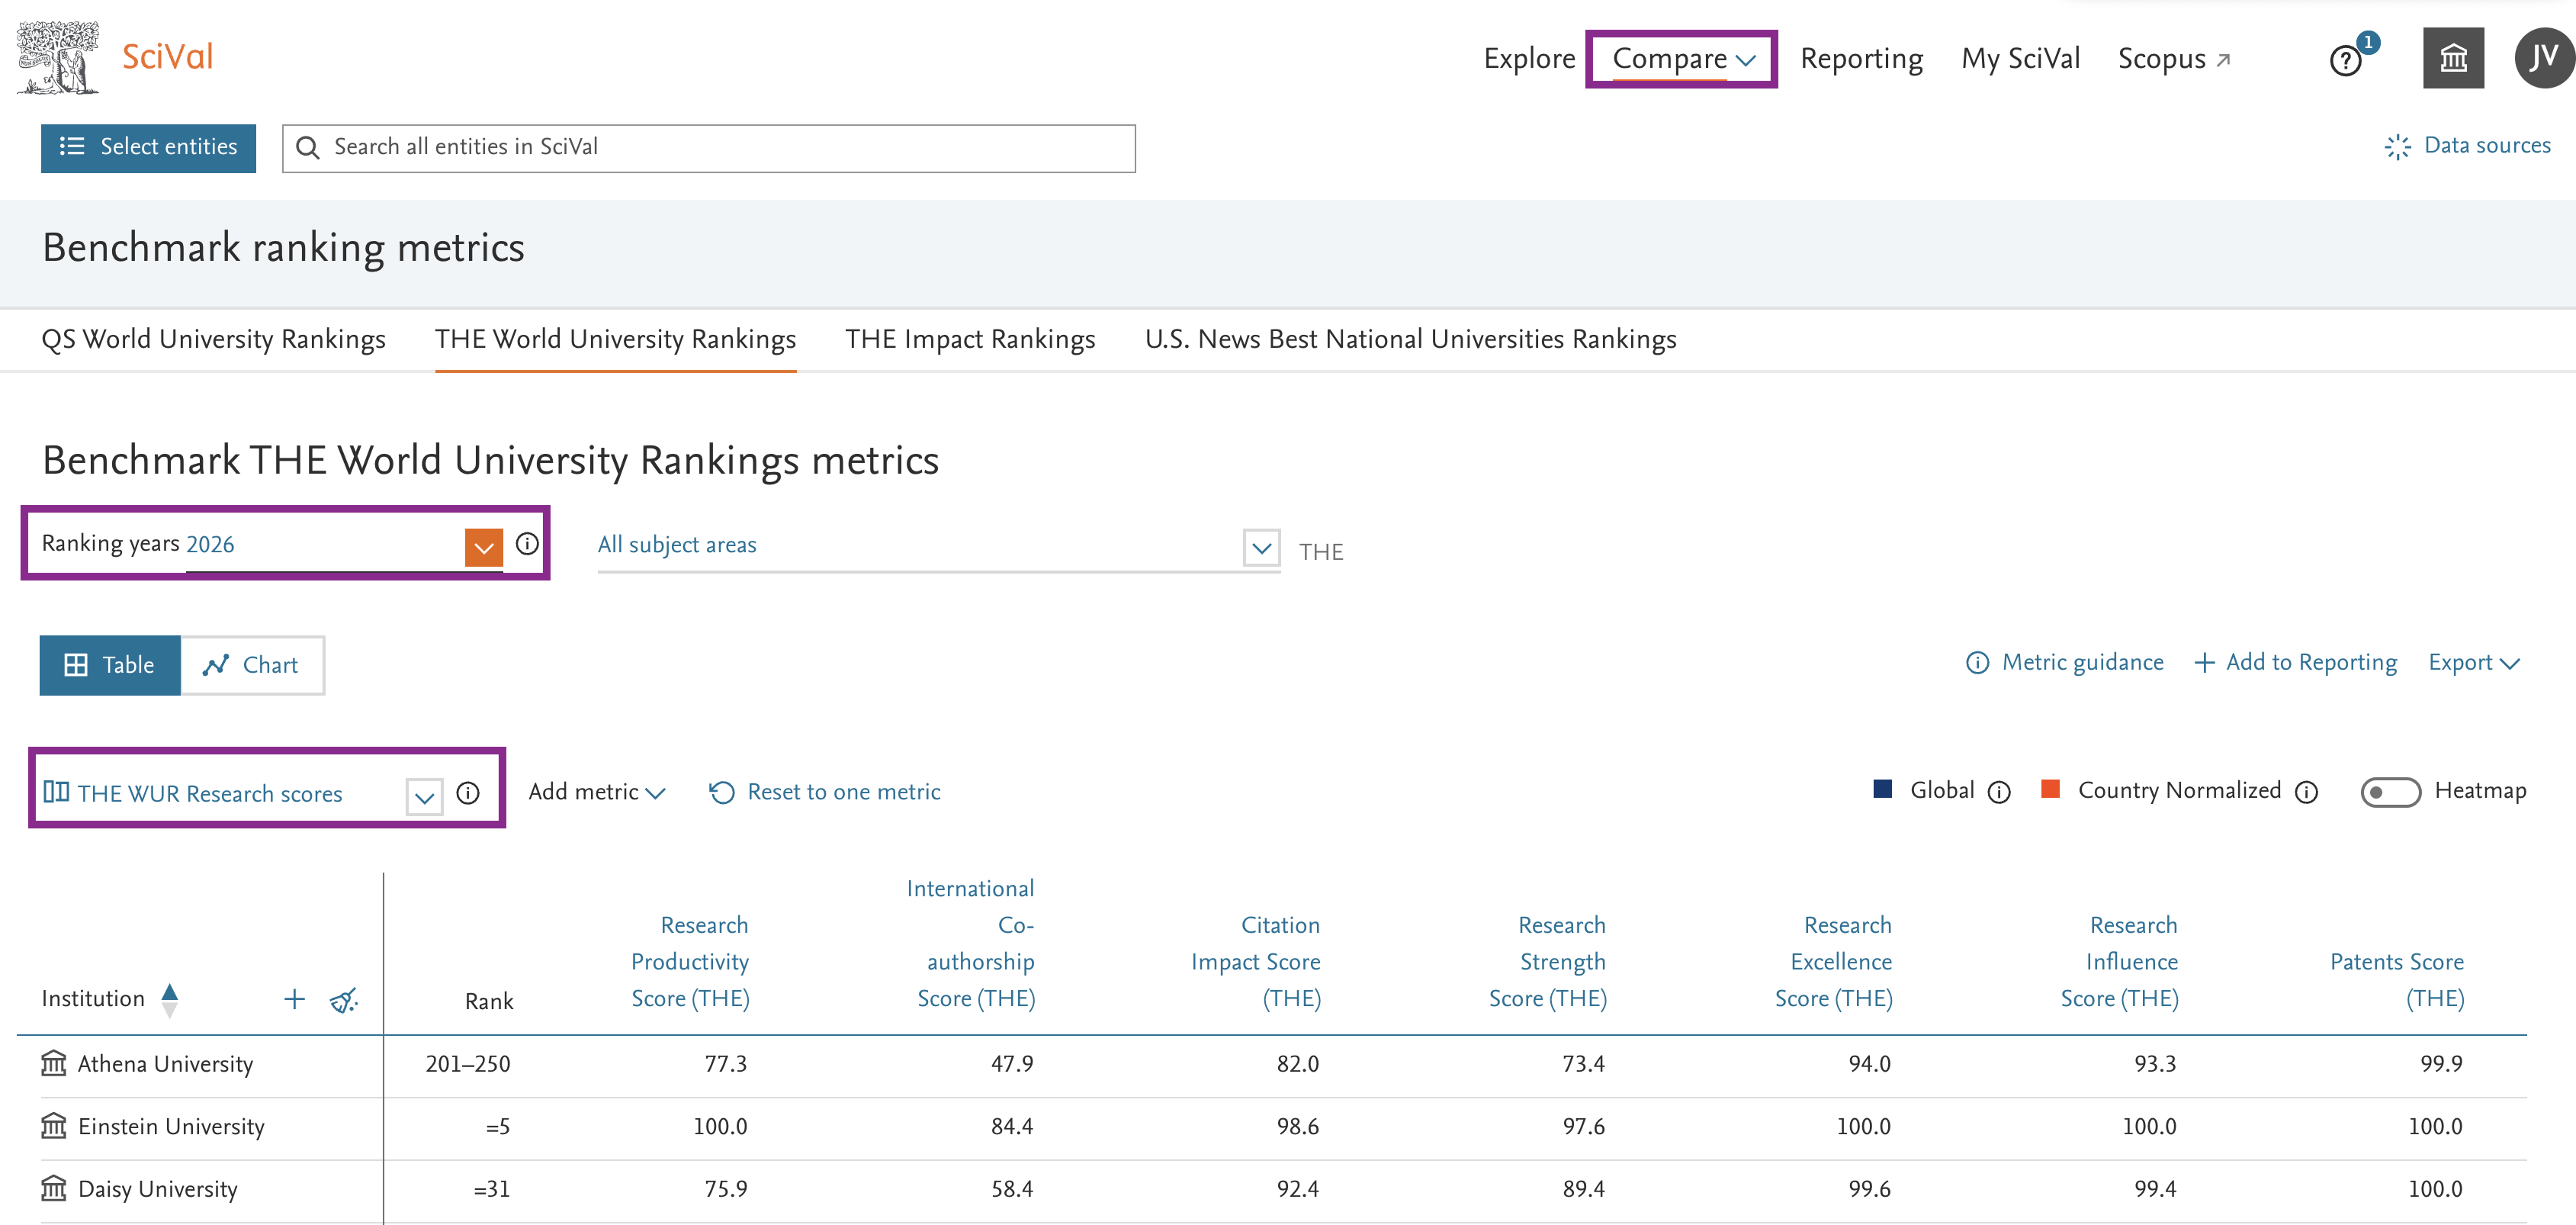
We are excited to provide access to the bibliometric dataset underpinning the THE World University Rankings 2026 (announced on October 9th, 2025) in SciVal. Gain insights into the bibliometric dataset underlying your institution’s rankings scores and analyze the factors that contribute to 40% of the overall ranking. Compare your performance to peer institutions in Compare across multiple ranking years (from 2021 to 2026) and easily populate the comparison table using the predefined metric sets.
- U.S. News Best National University Rankings 2026 bibliometric dataset is available to analyze
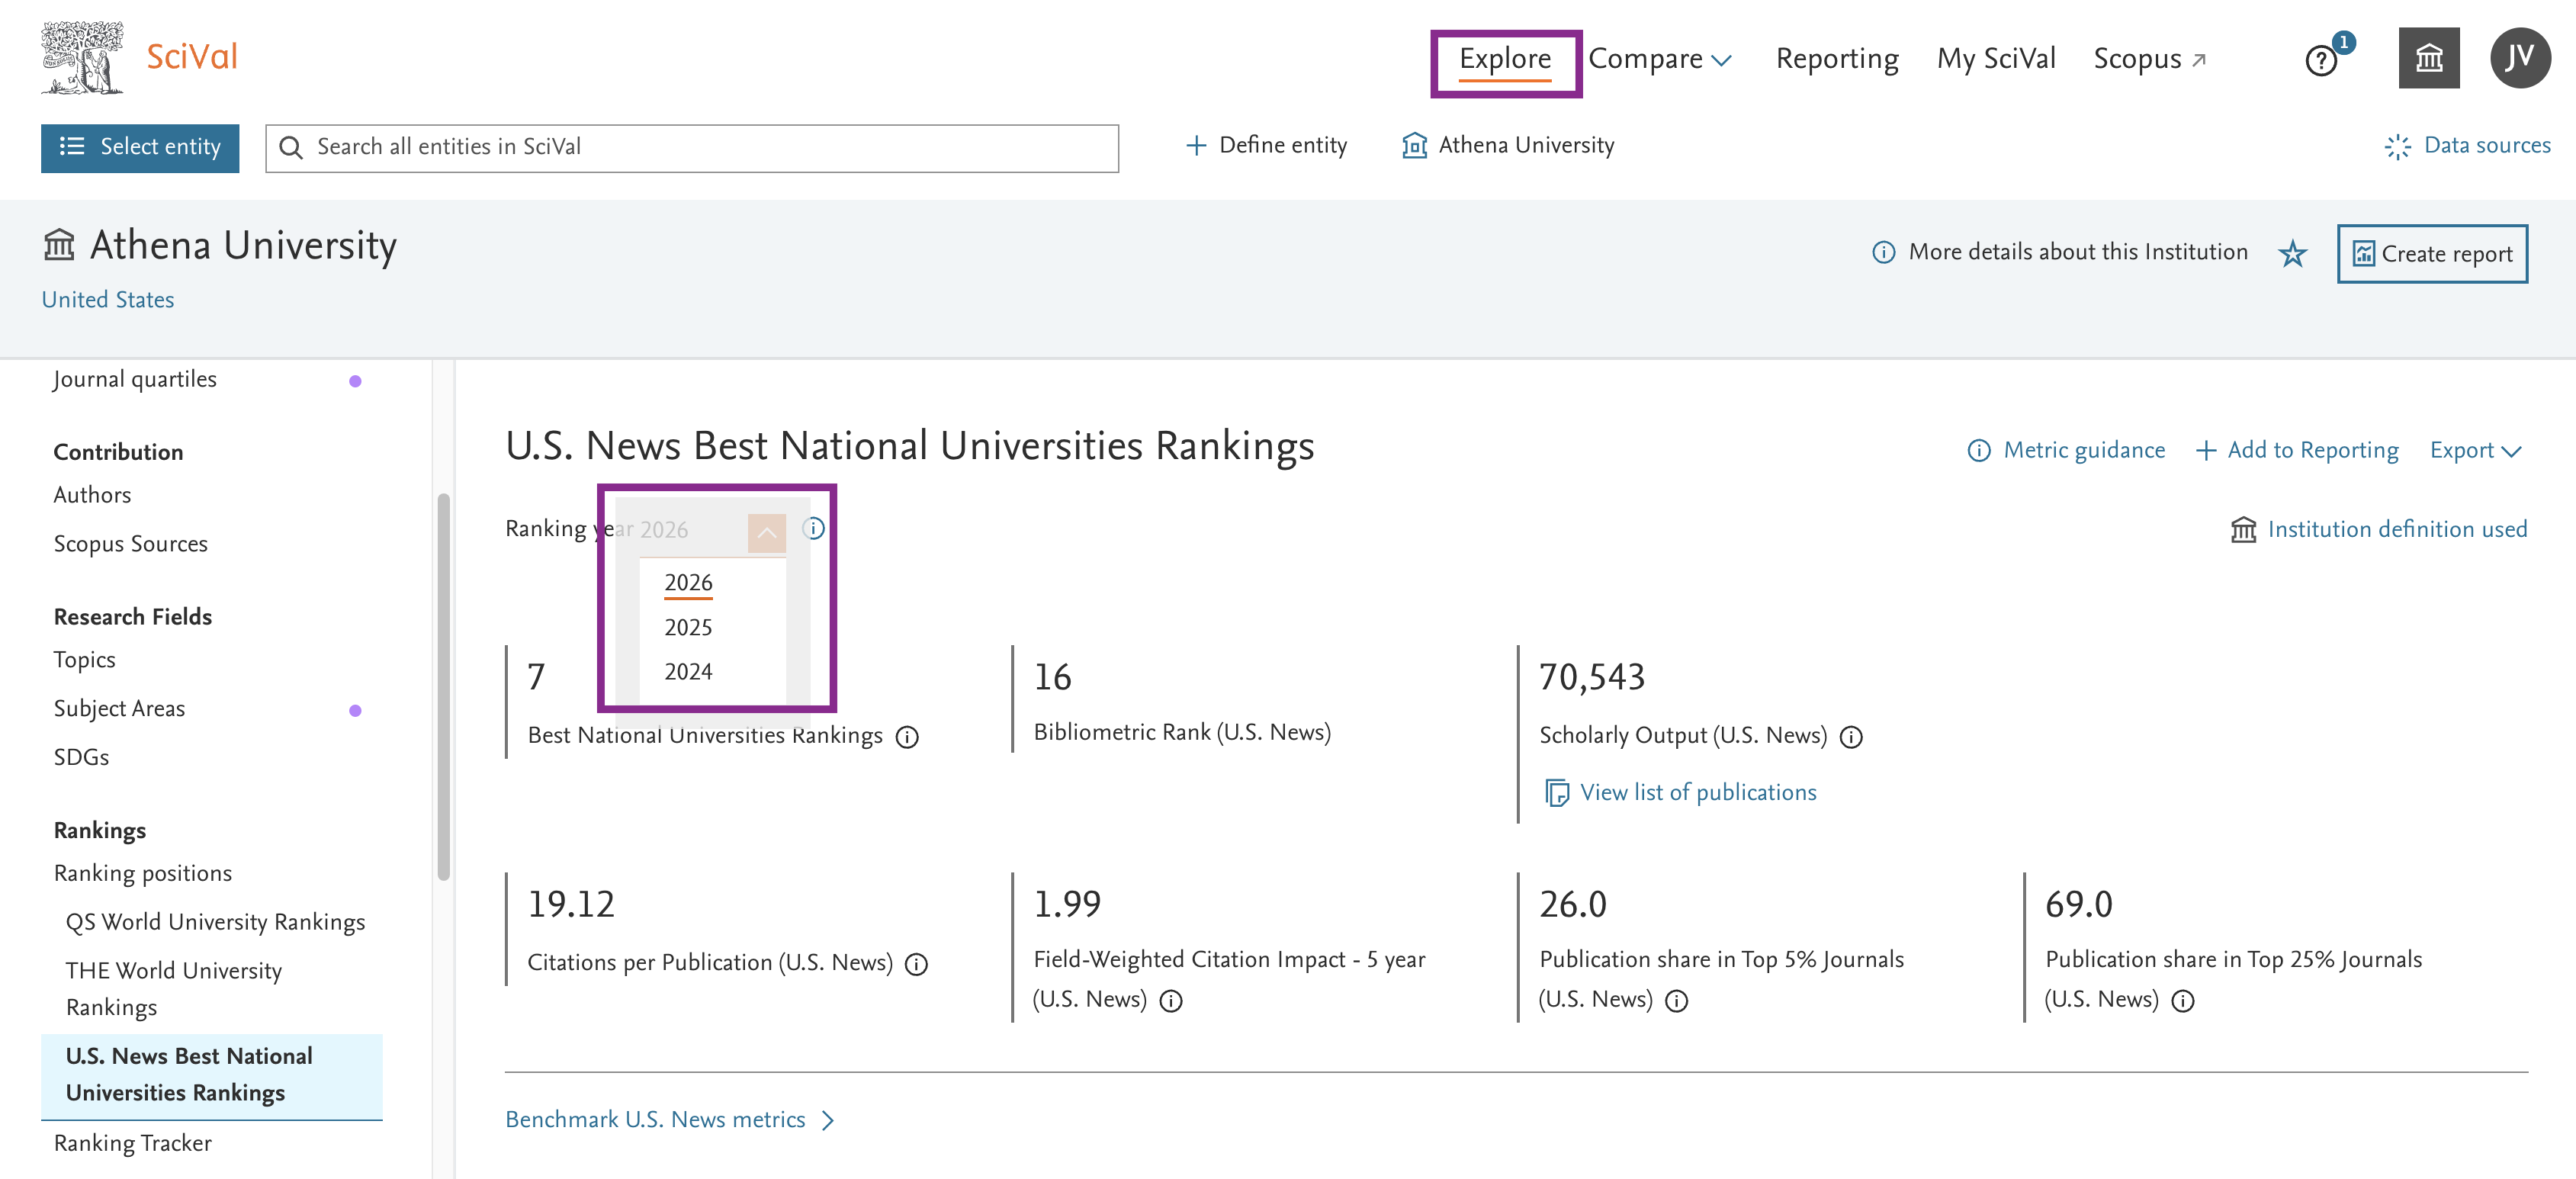
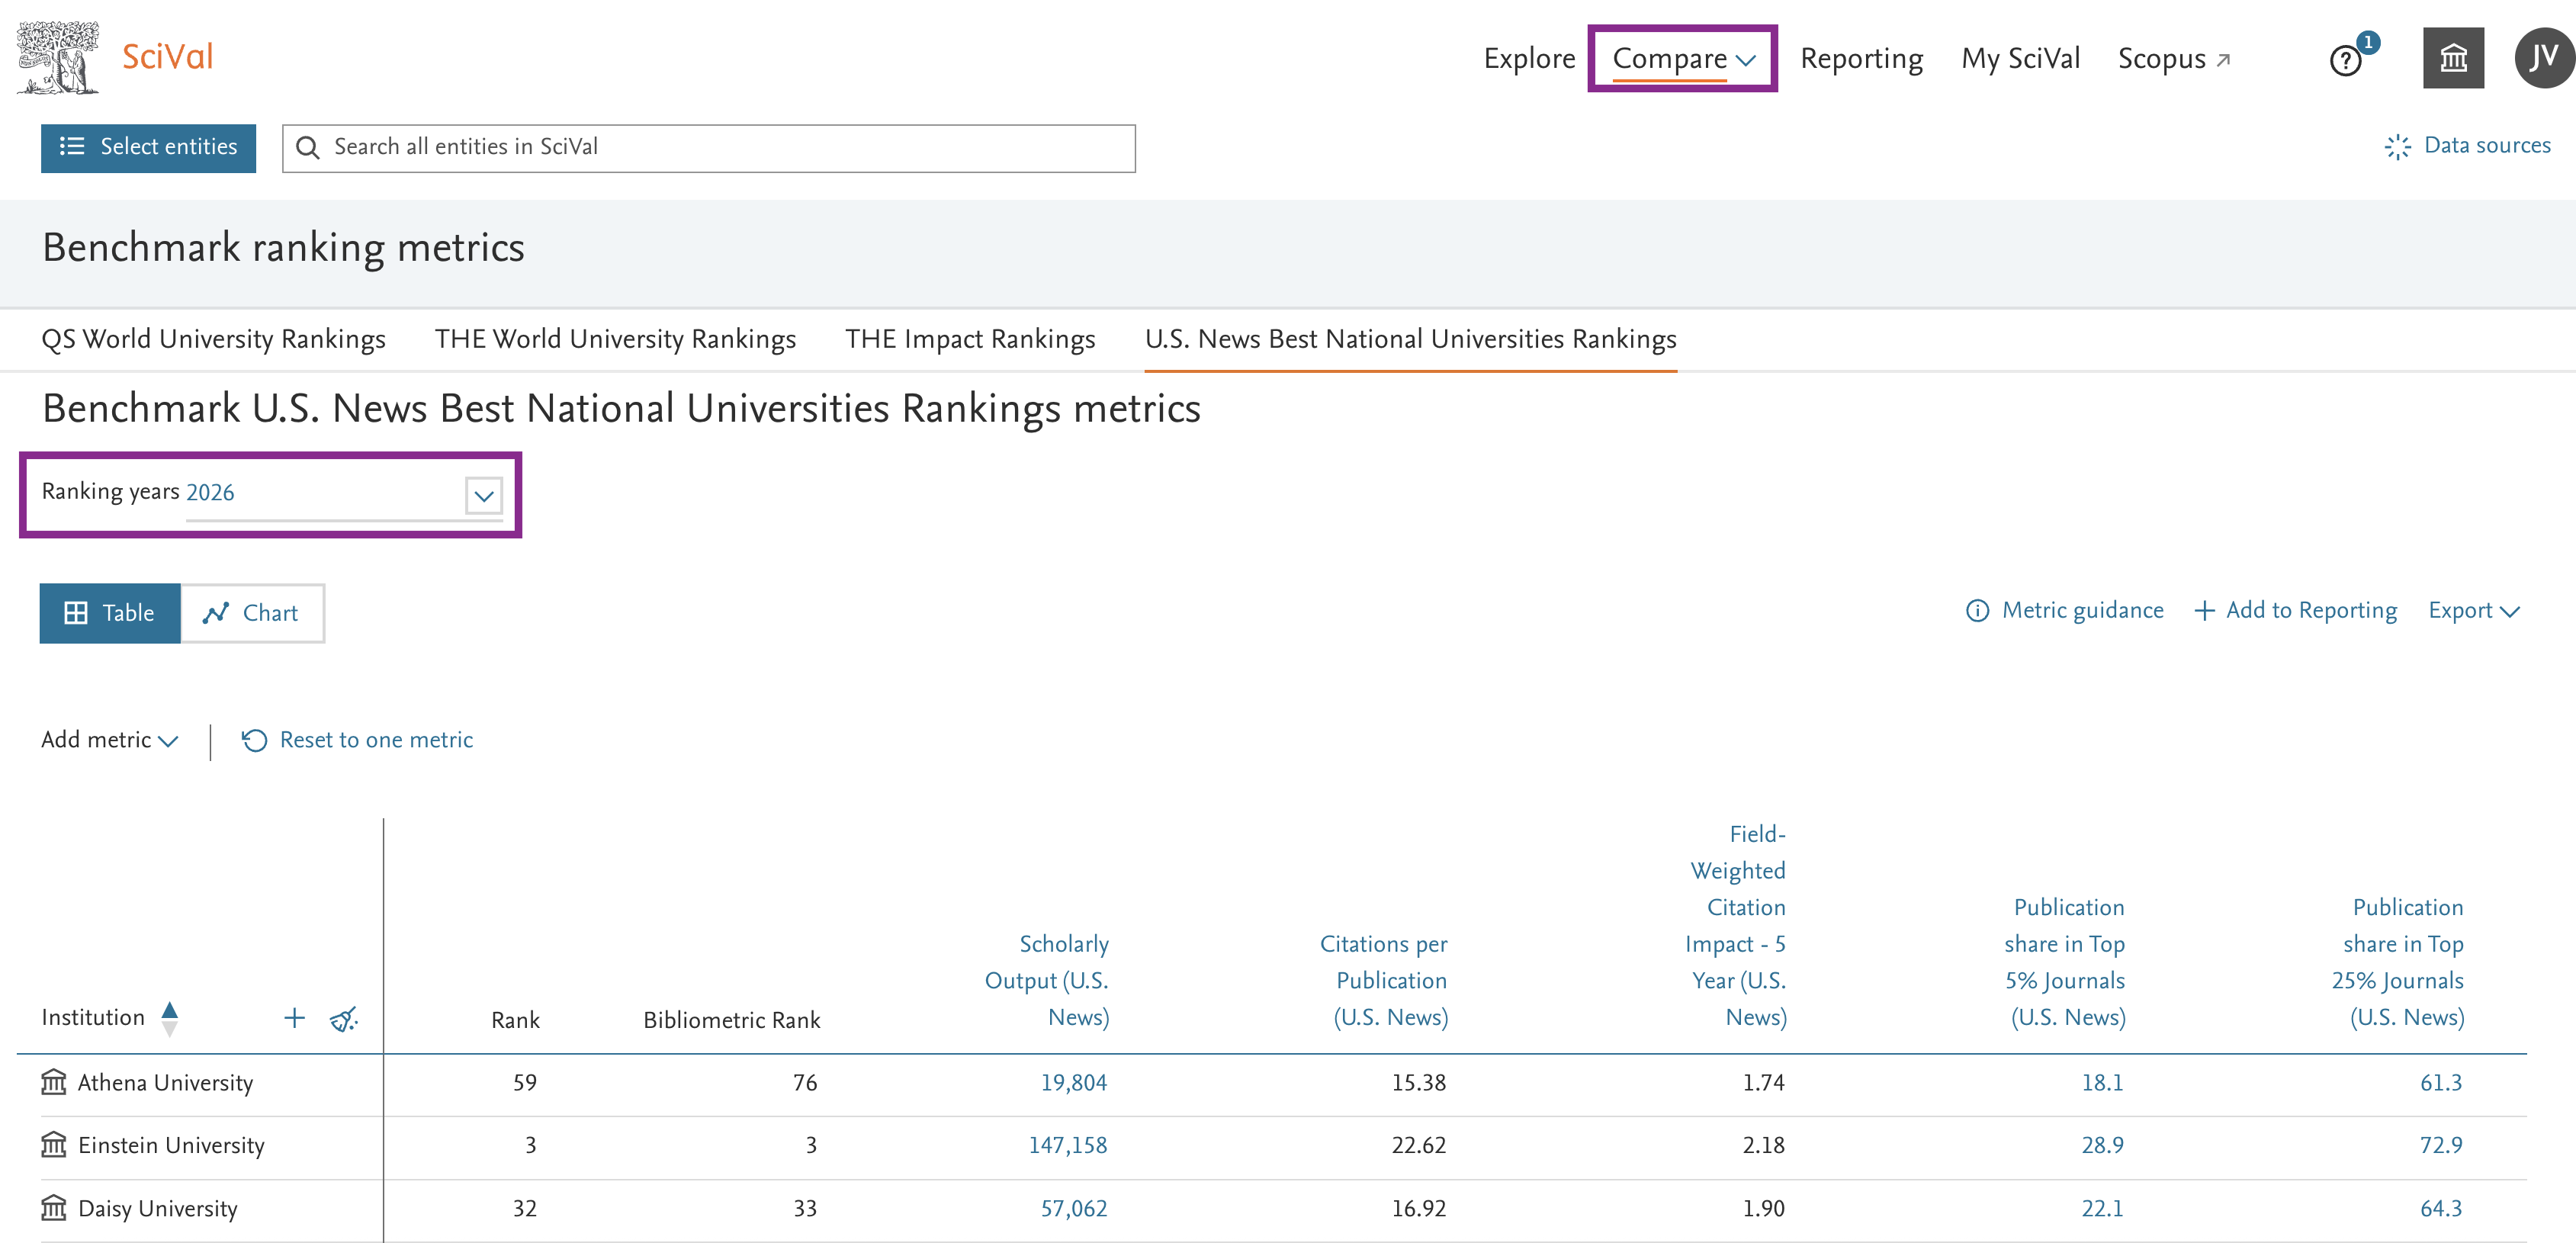
Building on the launch of the U.S. News Rankings in SciVal, you can now analyze the bibliometric dataset used in the U.S. News Best National University Rankings 2026 (released on September 23rd, 2025). Get a deeper understanding of the drivers behind the U.S. News specific bibliometrics (Citations per Publication, FWCI, Publication shares in top 5% and 25% journals by CiteScore), contributing 4% to the overall ranking.
The September 2025 release is dedicated to eclipses. An eclipse occurs when one celestial body moves into the shadow of another, causing temporary partial or complete obscuration. These awe-inspiring events have fascinated humanity for centuries and provide valuable opportunities for scientific study, such as observing the Sun’s corona and Earth’s atmosphere. In 2025, there were four eclipses. The recent lunar eclipse featured a striking "Blood Moon," a reddish hue caused by Earth’s atmospheric filtering, highlighting the dynamic nature of our solar system.
The Eclipses release brings you several benefits, including enhancements in My SciVal and Impact pages, update on the open access changes, Research Areas, and much more.
- Improved Search Results for Researcher Groups in My SciVal
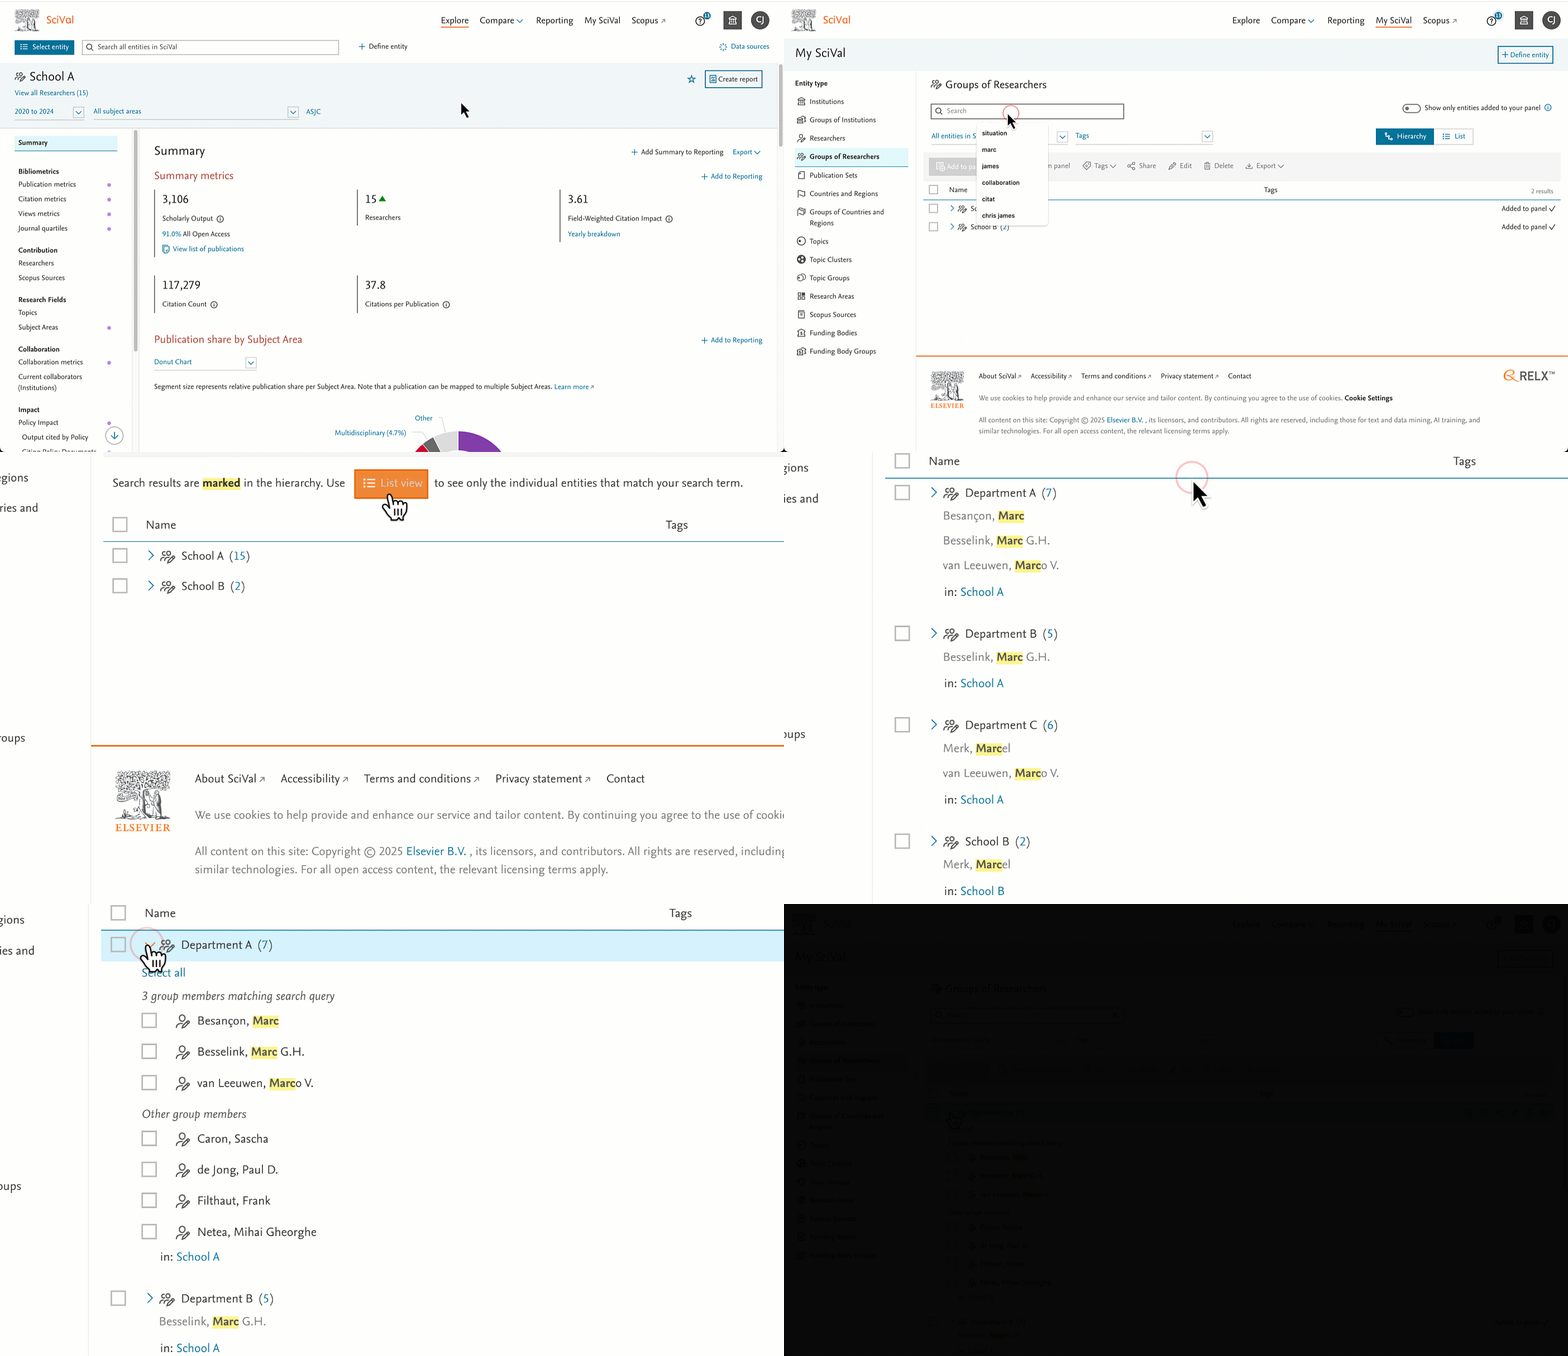
We’ve improved the search results and how they are displayed in My SciVal, making it easier to find Researchers and nested Groups within Researcher Groups and Hierarchies. In list view, search now only returns entities that directly match your query, with clear breadcrumbs to show group and hierarchy context. You’ll also see a breakdown of which individual Researchers match your search term, helping you quickly locate the right results.
- Consistent and expanded sorting options across listings for Impact pages
We’ve aligned sort options across all Impact data types to make the user experience more consistent. You can now sort Policy and Patent records by publication date in both ascending and descending order, using the full date (not just the year) for greater accuracy.
.png)
- Upcoming changes to Open Access status
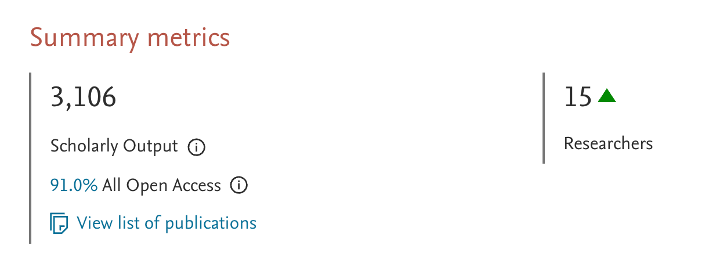
Starting the 8th of September and running for 6-8 weeks, we have been updating the Open Access data in SciVal to reflect the latest improvements in the Unpaywall database. Learn more.
- New and updated Research Areas provided by SciVal
We’ve added 5 new Research Areas aligned with the U.S. Office of Science and Technology Policy (OSTP) focus areas: Artificial Intelligence, Quantum Information Science, Nuclear Technology, Biotechnology, and Semiconductors.
- The Net Zero and Artificial Intelligence - based on Elsevier AI Report methodology Curated Research Areas have been updated with July 2025 data
- The 5 Quantum Curated Research Areas – Quantum Computing, Metrology, Sensing, Simulation and Technologies, have been updated with data from the 27th of August 2025.
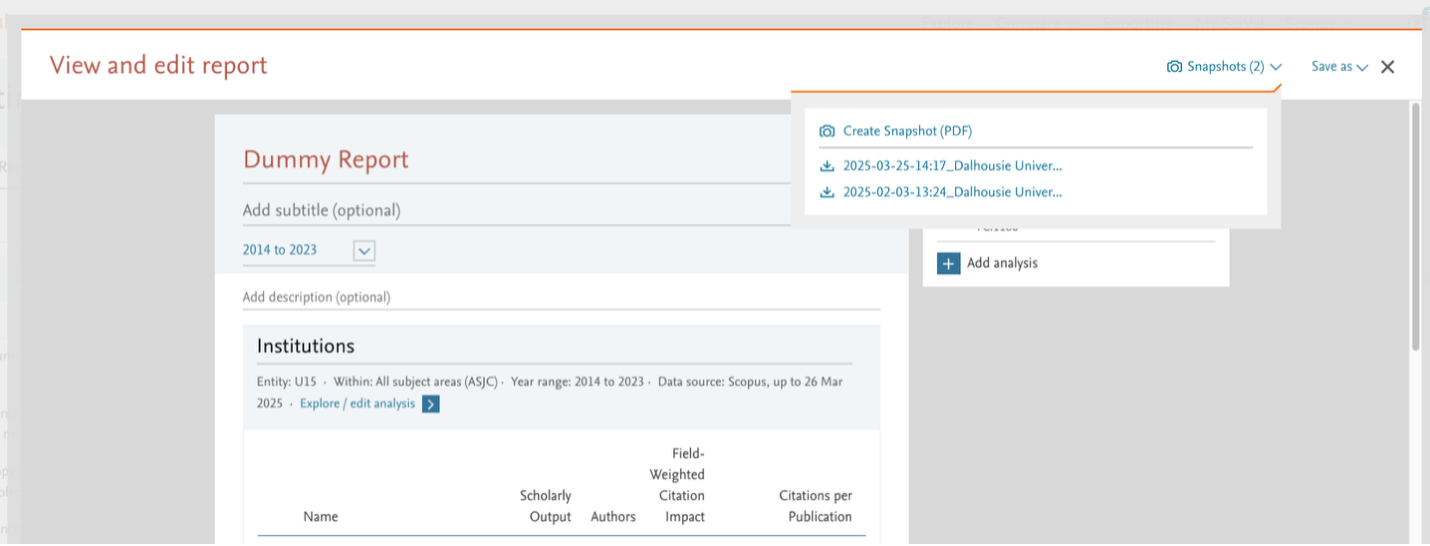
- Reporting – making saved snapshots more visible
To make it easier to view and save snapshots, we’ve made the snapshot functionality more visible in Reporting.
- Reintroduction of co-author counts for Institution Collaboration
Earlier this year, co-author counts were removed from the Current Collaborators page so we could focus development efforts on the most widely used data points. Based on customer feedback highlighting their importance for institutional collaboration, these counts have now been re-introduced.
- Compare functionality now included in the Impact subscription
Impact subscribers now have access to Benchmarking functionality without needing a separate Benchmarking subscription through the Compare (All metrics) section. This includes full access to Impact metrics within Benchmarking, along with limited bibliometric data for additional context.
.png)
- Flexible year ranges and additional subject classifications on the Subject Areas and Related Topics pages
Following the migration to new technologies, the Subject Areas page (available for all entities) now offers flexible year ranges and additional subject classifications.
Flexible year ranges are also available for the Related Topics page within the Topics entity. These pages are indicated by a purple dot in the left-hand navigation panel.
.png)
.png)
The second phase of the Coral reefs release introduces updates and enhancements to the Rankings features, now including the bibliometric datasets underlying the THE Impact Rankings 2025 and QS World University Rankings 2026.
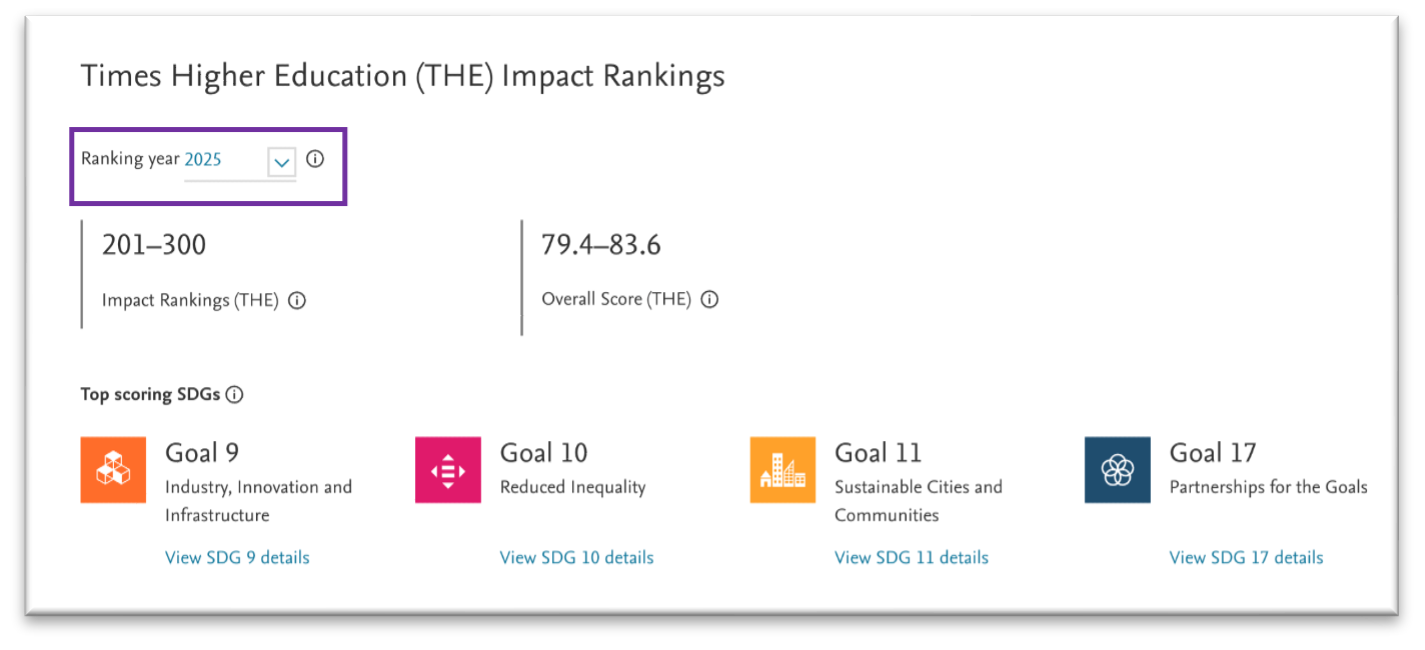
- Analyze the bibliometric dataset underlying the THE Impact Rankings 2025
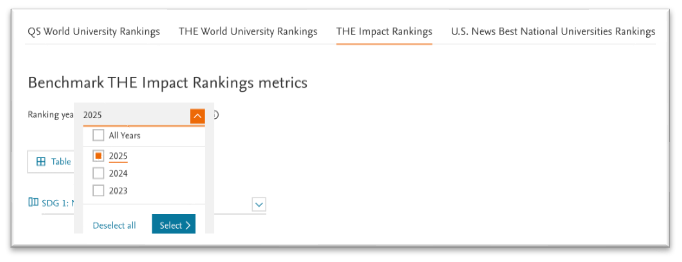
Gain insights into the THE Impact Rankings 2025 focusing on the UN Sustainable Development Goals (released June 19th, 2025). Analyze research metrics and the underlying publication sets for each SDG. Use Compare, to analyze and benchmark your institution's performance against peers across the bibliometric indicators used in the THE Impact Rankings.
- Analyze the bibliometric dataset underlying the QS World University Rankings 2026
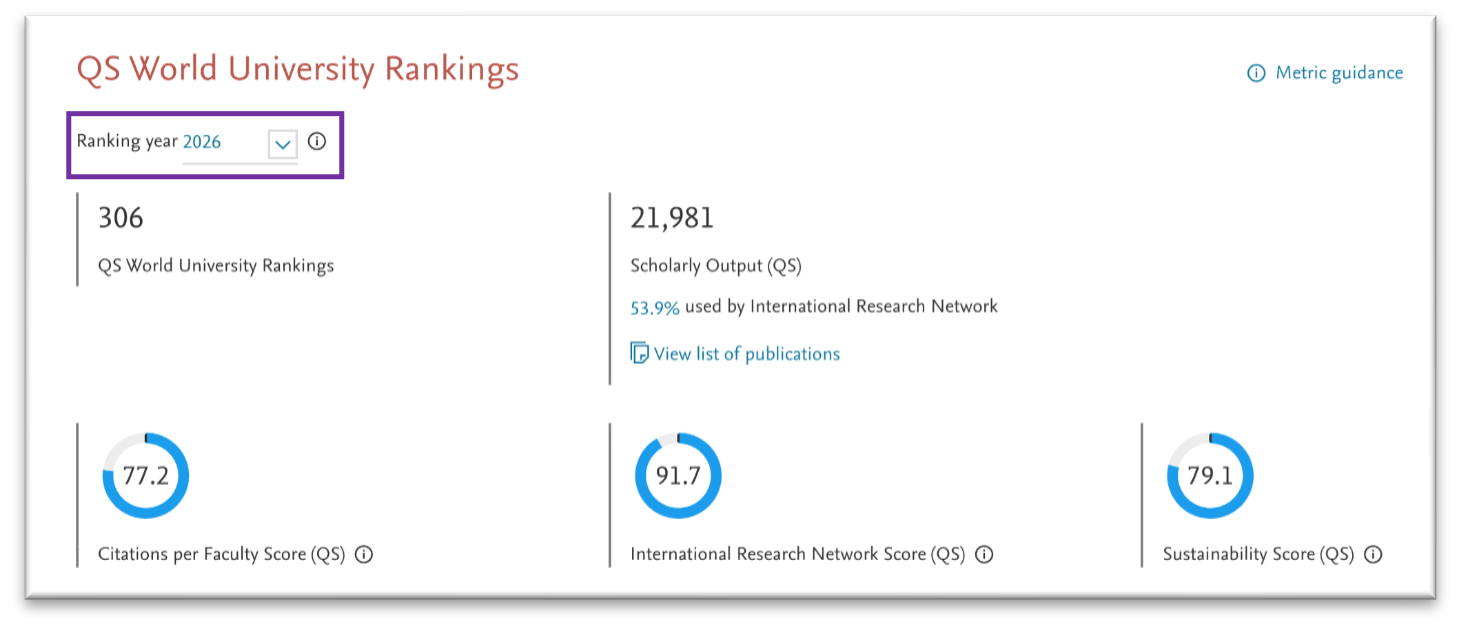
Analyze the bibliometric data used in the recently published QS World University Rankings 2026 (released June 19th, 2025). Gain insights into key indicators like the Citations per Faculty and International Research Network which contribute 25% to the overall ranking. Use Benchmarking to compare peer institutions’ performance and easily populate the comparison tables with predefined metric sets.
- Highly Cited Chinese Researchers now has ‘Add to reporting’ and export functionality
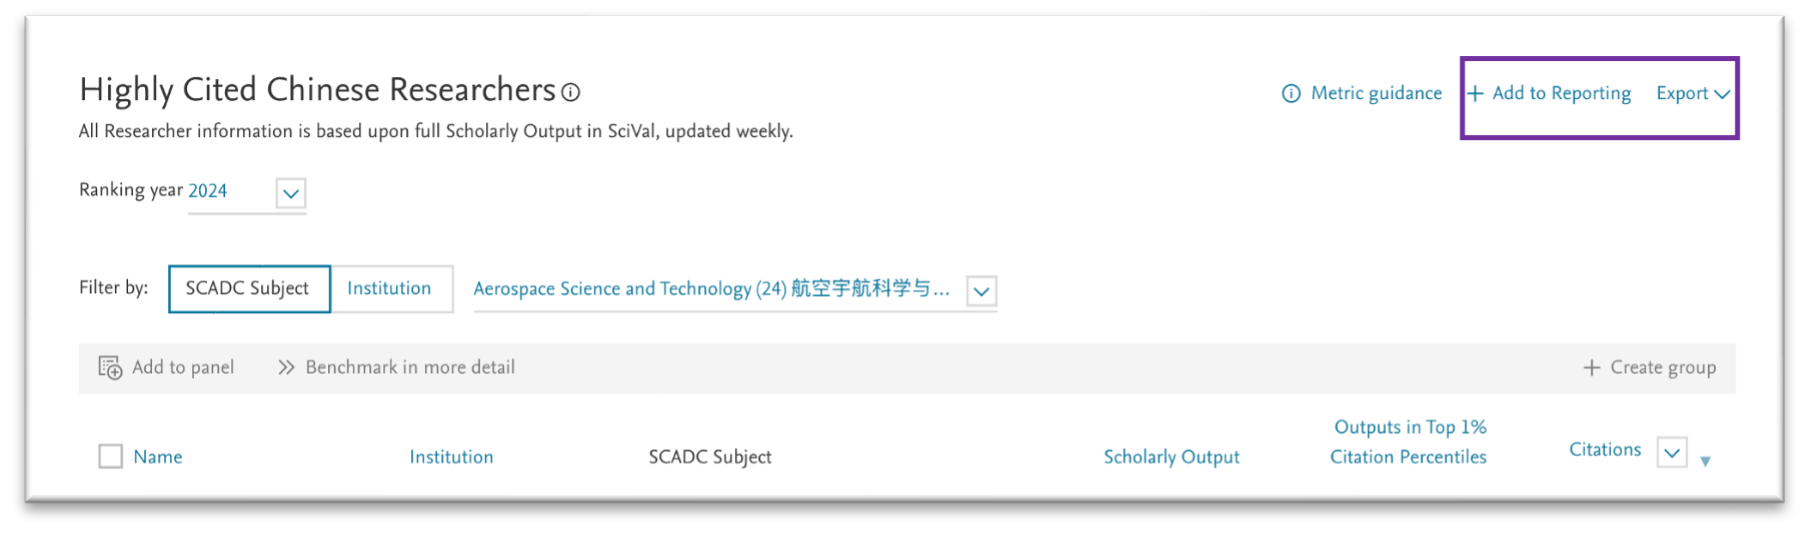
The Highly Cited Chinese Researchers now includes "Add to Reporting" and export functionality, allowing you to save your analyses for use in custom reports. This enhancement enables you to easily share your analyses and reports with other users.
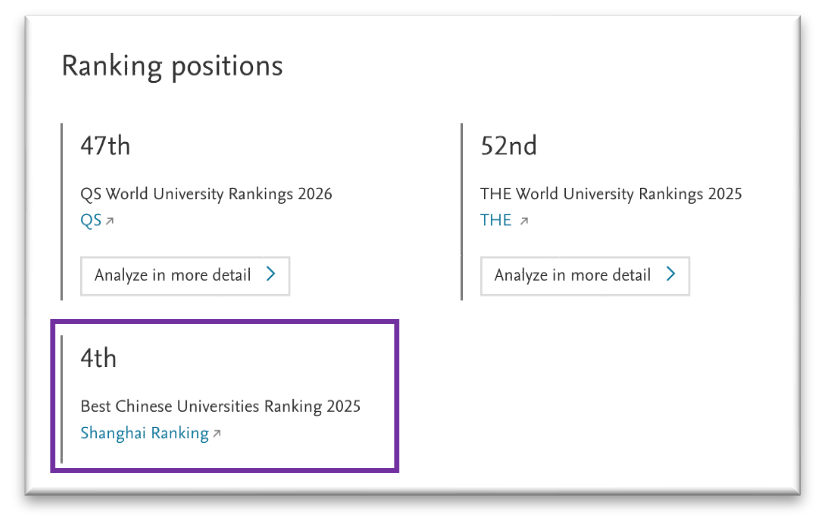
- Check the Best Chinese University Rankings (BCUR) 2025
For Chinese institutions, you can now see their ranking in the 2025 Best Chinese University Ranking by Shanghai Ranking Consultancy in the Rankings positions. You can easily navigate to the official rankings page using the link under the rankings.
The June 2025 release is dedicated to one of the world’s most extraordinary natural wonders: coral reefs. These vibrant underwater ecosystems are built by tiny coral polyps that secrete calcium carbonate, forming intricate and colorful reef structures. Often called the "rainforests of the sea," coral reefs support vast marine biodiversity by providing shelter, food, and breeding grounds for thousands of species. Beyond their ecological importance, they also protect coastlines from erosion and storms.
The Coral reefs release brings you the redesigned entity panel, GenAI powered Topic titles, Ranking tracker in Compare and much more.
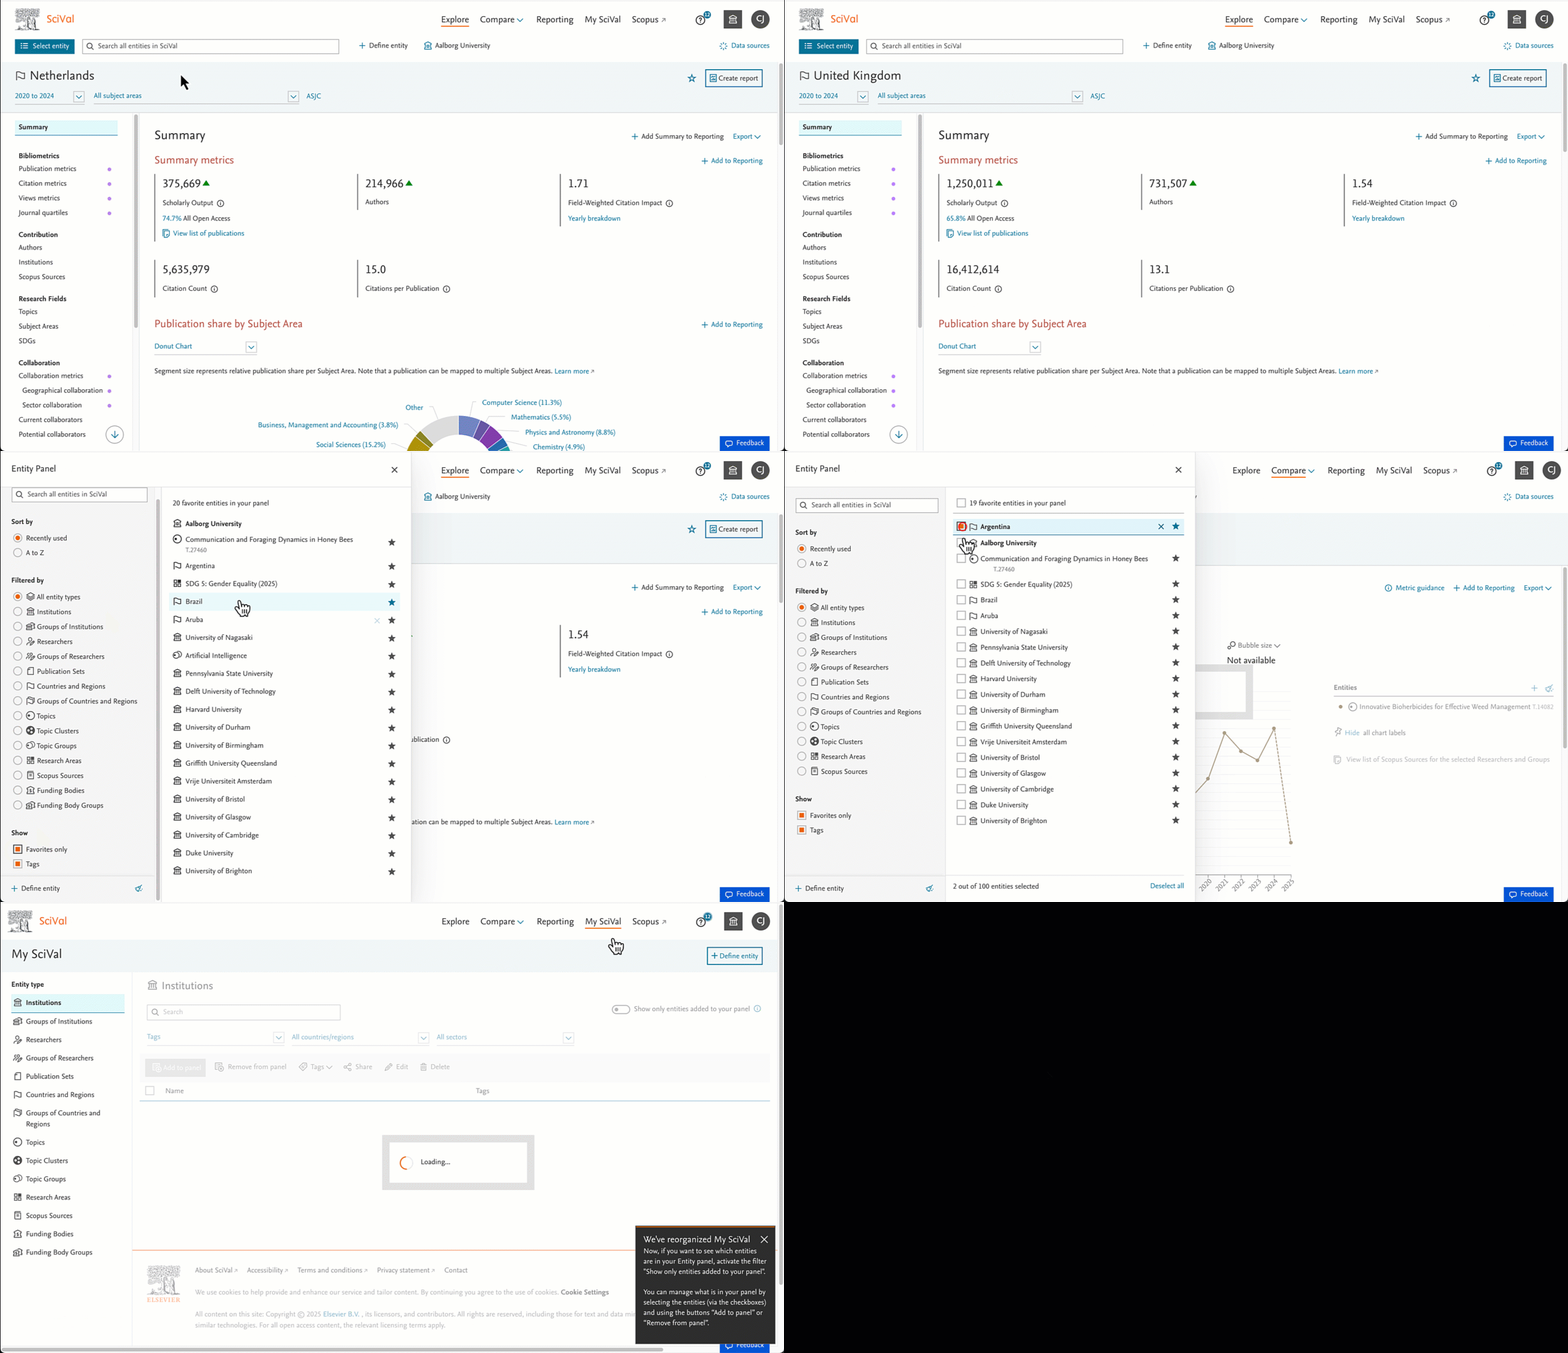
- Redesigned entity panel and reorganization of My SciVal
To make entity selection across SciVal more efficient and more accessible, we redesigned the SciVal entity panel with a new look and additional functionality.
The main changes to the panel include:
- The addition of a "Recently used" sorting option: Sort your entities in chronological order, based on when you have created or used them in SciVal. This provides a fast and simple way to quickly revert to recently used entities without searching through your entity lists.
- The ability to view all entity types in one list, in addition to filtering specific entity types: The "All entity types" filter option gives you a list of all entities on your panel, irrespective of the entity type. We’ve improved filtering precision by clearly separating individual entities from group entities.
- Incorporation of Global Search into the entity panel: it is now possible to search for additional entities to add to your panel across all entity types.
- Alignment across Explore and Compare: The redesigned entity panel is available across both analysis sections. For Compare, this means that the entity panel is now collapsed, instead of expanded on the left, making more space for your analyses on the main page.
Experience a more consistent and powerful My SciVal, now aligned with the entity panel and enhanced with improved functionality to help you manage your entities more effectively.
- With improved filtering precision, navigate through the different entity types on the left where individual entities are clearly separated from group entities.
- With the “Only show entities added to your panel” toggle in the top right-hand corner of the page, you can switch between 2 different views of My SciVal:
- If the toggle is turned off, you will see all entities that are available to you, regardless of whether they have been added to your panel or not.
- If the toggle is turned on, the entities in My SciVal will be filtered on the ones that you have previously added to your entity panel.
- You can now quickly filter, tag and share your panel entities – such as institutions by sector - using the full range of My SciVal filters and functionality in the new page layout.
- Generative AI (GenAI) powered titles for Topics and Topic Clusters
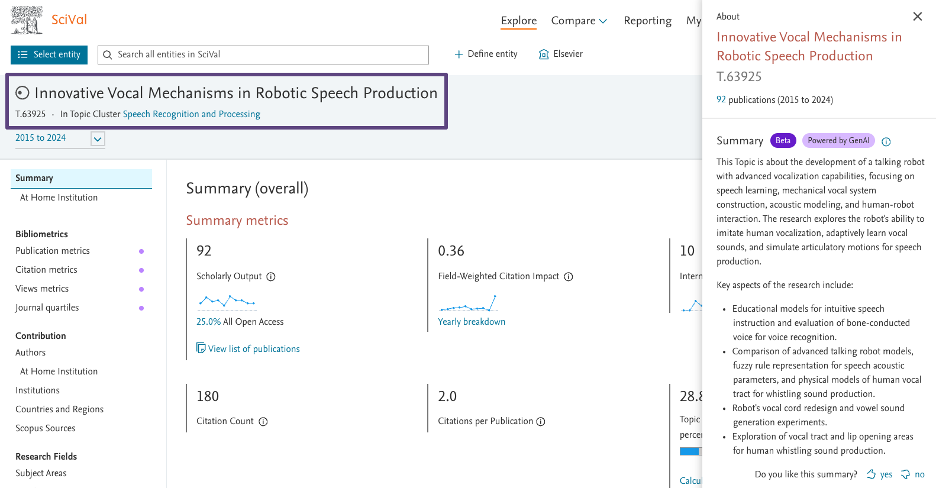
Quickly understand the core question(s) being addressed in each Topic or Topic Cluster with new GenAI powered titles. Tested since December 2024 and refined based on your feedback, these titles replace the old keyphrase-based names, offering greater clarity alongside already available GenAI summaries.
Learn more about how titles and summaries are created
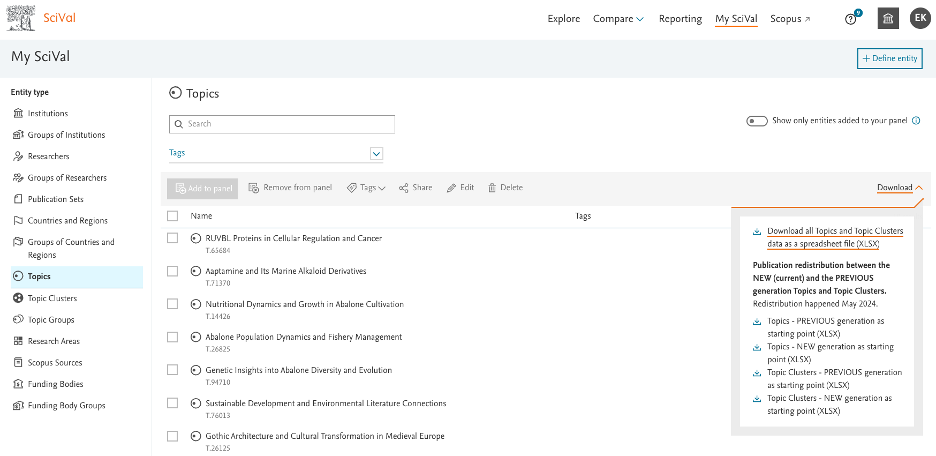
The old names are available for reference in “All Topics and Topic Clusters data” file, which can be downloaded in My SciVal.
- Benchmark to peers across the Ranking Tracker metrics in Compare
Assess your institution’s progress and benchmark against peers using the Ranking Tracker, now available in Compare, covering the bibliometrics behind the upcoming THE World University Ranking. Using an interim Scopus data snapshot (1st February 2025) and applying the same methodology outlined by THE as the final rankings (THE WUR 2026), it enables you to see your current performance across the bibliometric drivers as well as in comparison to the latest published rankings edition (THE WUR 2025).
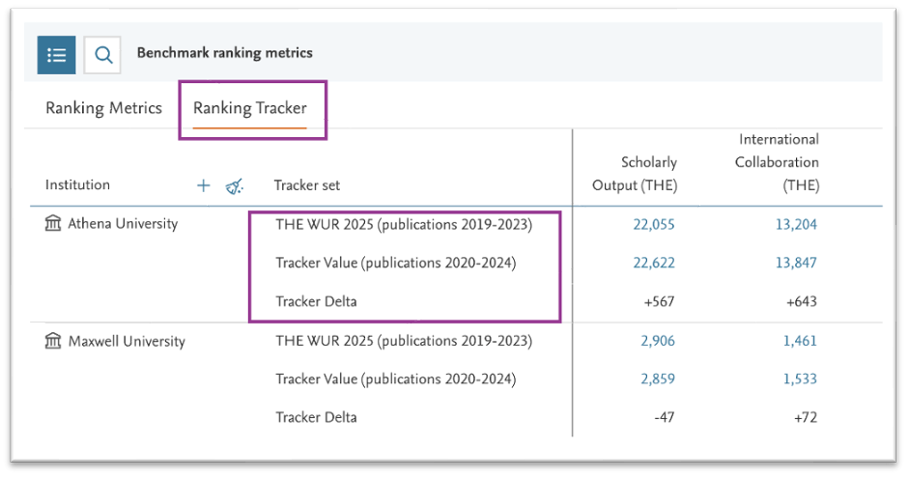
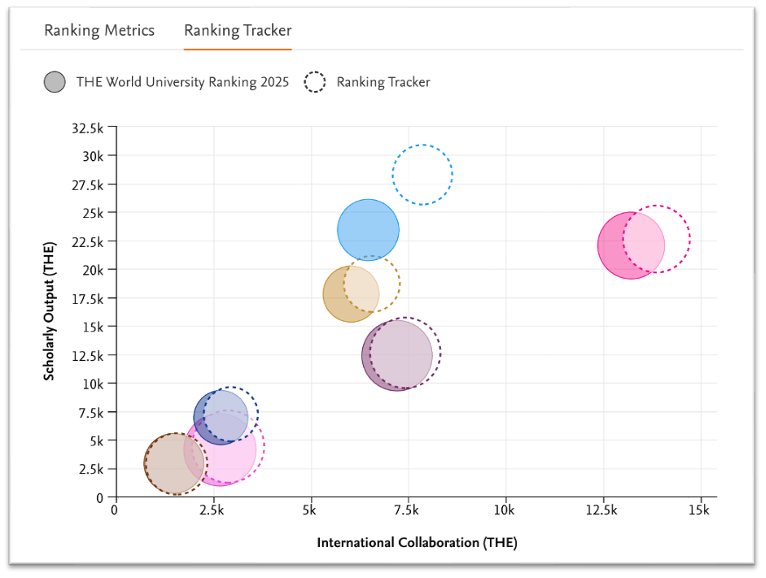
Ranking tabs restructured
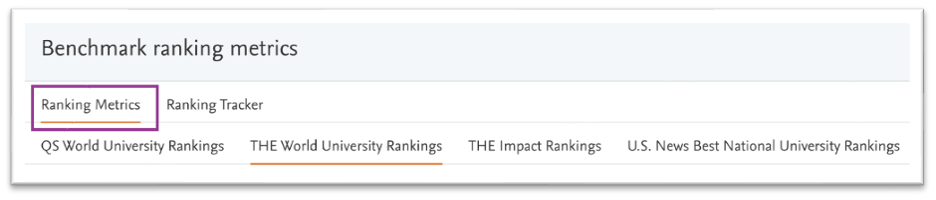
Access ranking data more efficiently with the restructured Rankings tabs – quickly find published rankings along with metric analysis under “Ranking Metrics”, and track upcoming ranking analysis in the new “Ranking Tracker” tab.
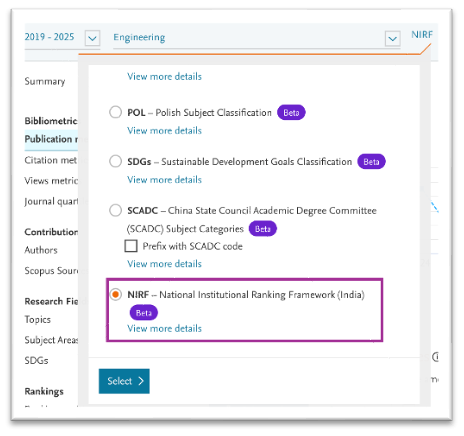
- Analyze any entity’s contribution to the NIRF with the new subject classification
Analyze the publication output and metrics using the National Institutional Ranking Framework (NIRF, India) now available for any entity linked to NIRF-assigned publications.
The NIRF is an initiative by the Ministry of Education, Government of India, aimed at ranking higher education institutions across various categories and disciplines. You can analyze the 8 broad categories of the NIRF subject classification on the indicated Explore pages (purple dots), in Benchmark (all metrics), and the Collaboration matrix.
New publications will be assigned to their respective subject categories within the classification on a weekly basis.
- Patent metrics page – expansion of patent office coverage and improved filtering
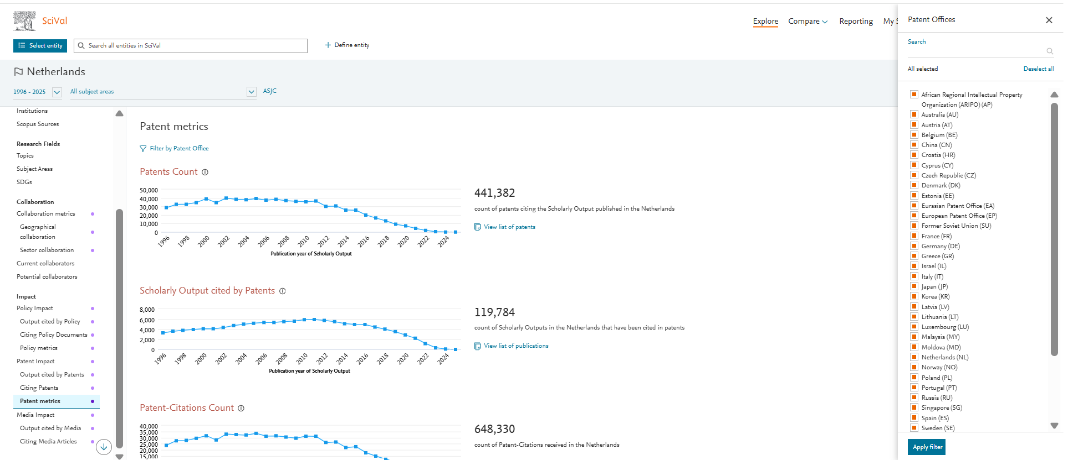
You can now gain a more comprehensive view of patent citations for your selected entity with the Patent metrics page in Explore, now using data from all 43 patent offices instead of just 5.
Filtering is now easier with patent office filters, moved from a drop down to a slide-in panel, which also allows you to search and select specific patent offices.
- Policy and Patent metrics – changes to availability on Overview / Benchmarking subscription
Policy data is now available for Institution entities in the Overview and Benchmarking subscriptions, making it possible to analyze an Institution’s Output Cited by Policy as well as the Citing Policy Documents and Citation Counts received from Policy.
In Explore, the metrics can be accessed on the Policy metrics page, while in Compare, they can be accessed in Benchmark (All metrics).
The Patent metrics page will be available for Institution entities only and will no longer be accessible for other entity types. As a result, the page has been removed from the Explore navigation, and Patent metrics will no longer be supported for non-institution entities in Benchmarking.
- Yearly rollover
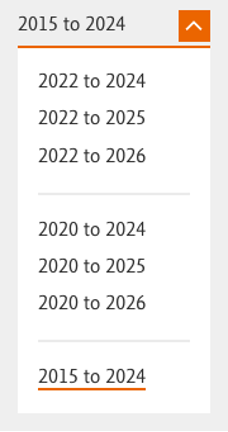
Each year in June, the Scopus content for the previous year (i.e. 2024) is considered over 95% complete. This is the point we make it a “complete year” in SciVal and move our pre-defined time ranges forward by one year. The new ranges are used to calculate the latest metric values and make some changes to the Topics and Topic Clusters as below:
- Recalculate the Prominence Percentiles for all Topics and Topic Clusters using the 2024 CiteScore metrics
- Reallocate papers published in 2022 from their current Topic to a more dominant Topic where applicable
Learn more about yearly rollover
- ORCID details available in full Author export
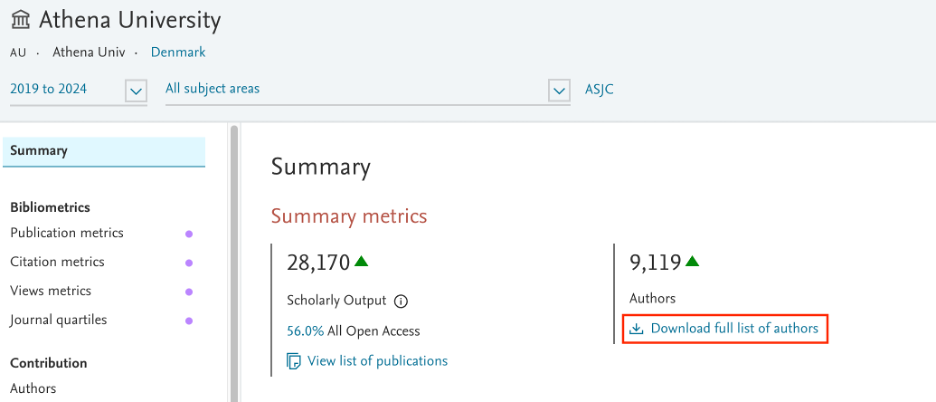
Easily identify and track if your researchers have linked their ORCID to their Scopus author profile. Any ORCIDs linked to Scopus author profiles will now be available in the full author export spreadsheet.
- Release of SciVal Accessibility statement
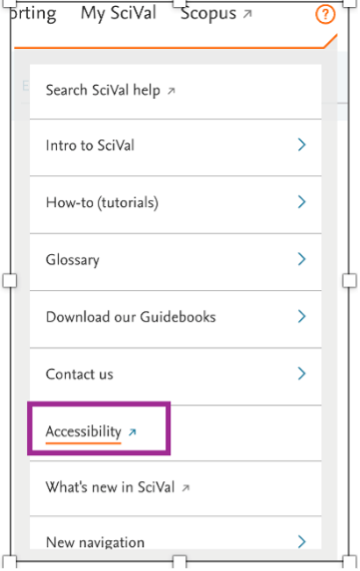
We are pleased to announce the release of the SciVal Accessibility Statement, affirming our commitment to making SciVal accessible to all users, including those with disabilities. This statement includes our Voluntary Product Accessibility Template (VPAT), recently updated in April 2025, which details how SciVal complies with the Web Content Accessibility Guidelines (WCAG) 2.1 and the U.S. Section 508 Standards.
The statement outlines our accessibility features and ongoing efforts to provide an inclusive user experience. It is available in the footer and the help section.
- SCADC as a subject classification (released on May 20th)
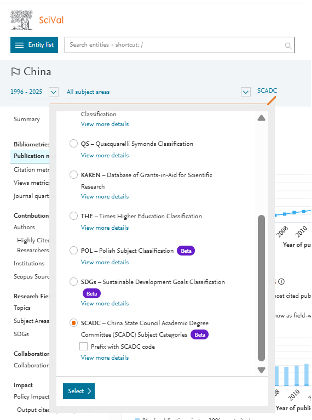
Analyze the output and metrics of any entity related to publications assigned to the State Council Academic Degree Committee (SCADC). This analysis utilizes the SCADC subject classification system, allowing you to filter data on both parent and child subject categories.
The SCADC classification is available in the subject classification dropdown in Compare: Benchmark (All metrics), Intersect (Collaboration matrix), and in Explore pages indicated with a purple dot.
- “Publications with datasets indexed in Data Monitor” Research Area is no longer available
The Data Monitor feature has been discontinued by Elsevier. Consequently, the Research Area “Publications with datasets indexed in Data Monitor” has been removed from SciVal, and any reports containing this analysis will no longer include this data.
April 2025 release highlights bioluminescence, a natural phenomenon where living organisms emit light through chemical reactions. This phenomenon is often observed in marine environments, resulting in blue and green displays in the ocean, particularly seen in organisms such as jellyfish and plankton. The best locations to experience this magical light show include coastal regions like Puerto Rico, the Maldives, and Japan.
The Bioluminescence release brings you the recently released Highly Cited Chinese Researchers 2024, the imminent launch of the State Council Academic Degree Committee (SCADC) subject classification, insights into how closely an entity's publications are linked to the Topic they are assigned through publication centrality, and much more.
- Highly Cited Chinese Researchers 2024 list and the imminent launch of the State Council Academic Degree Committee (SCADC) subject classification
Highly Cited Chinese Researchers 2024 now available
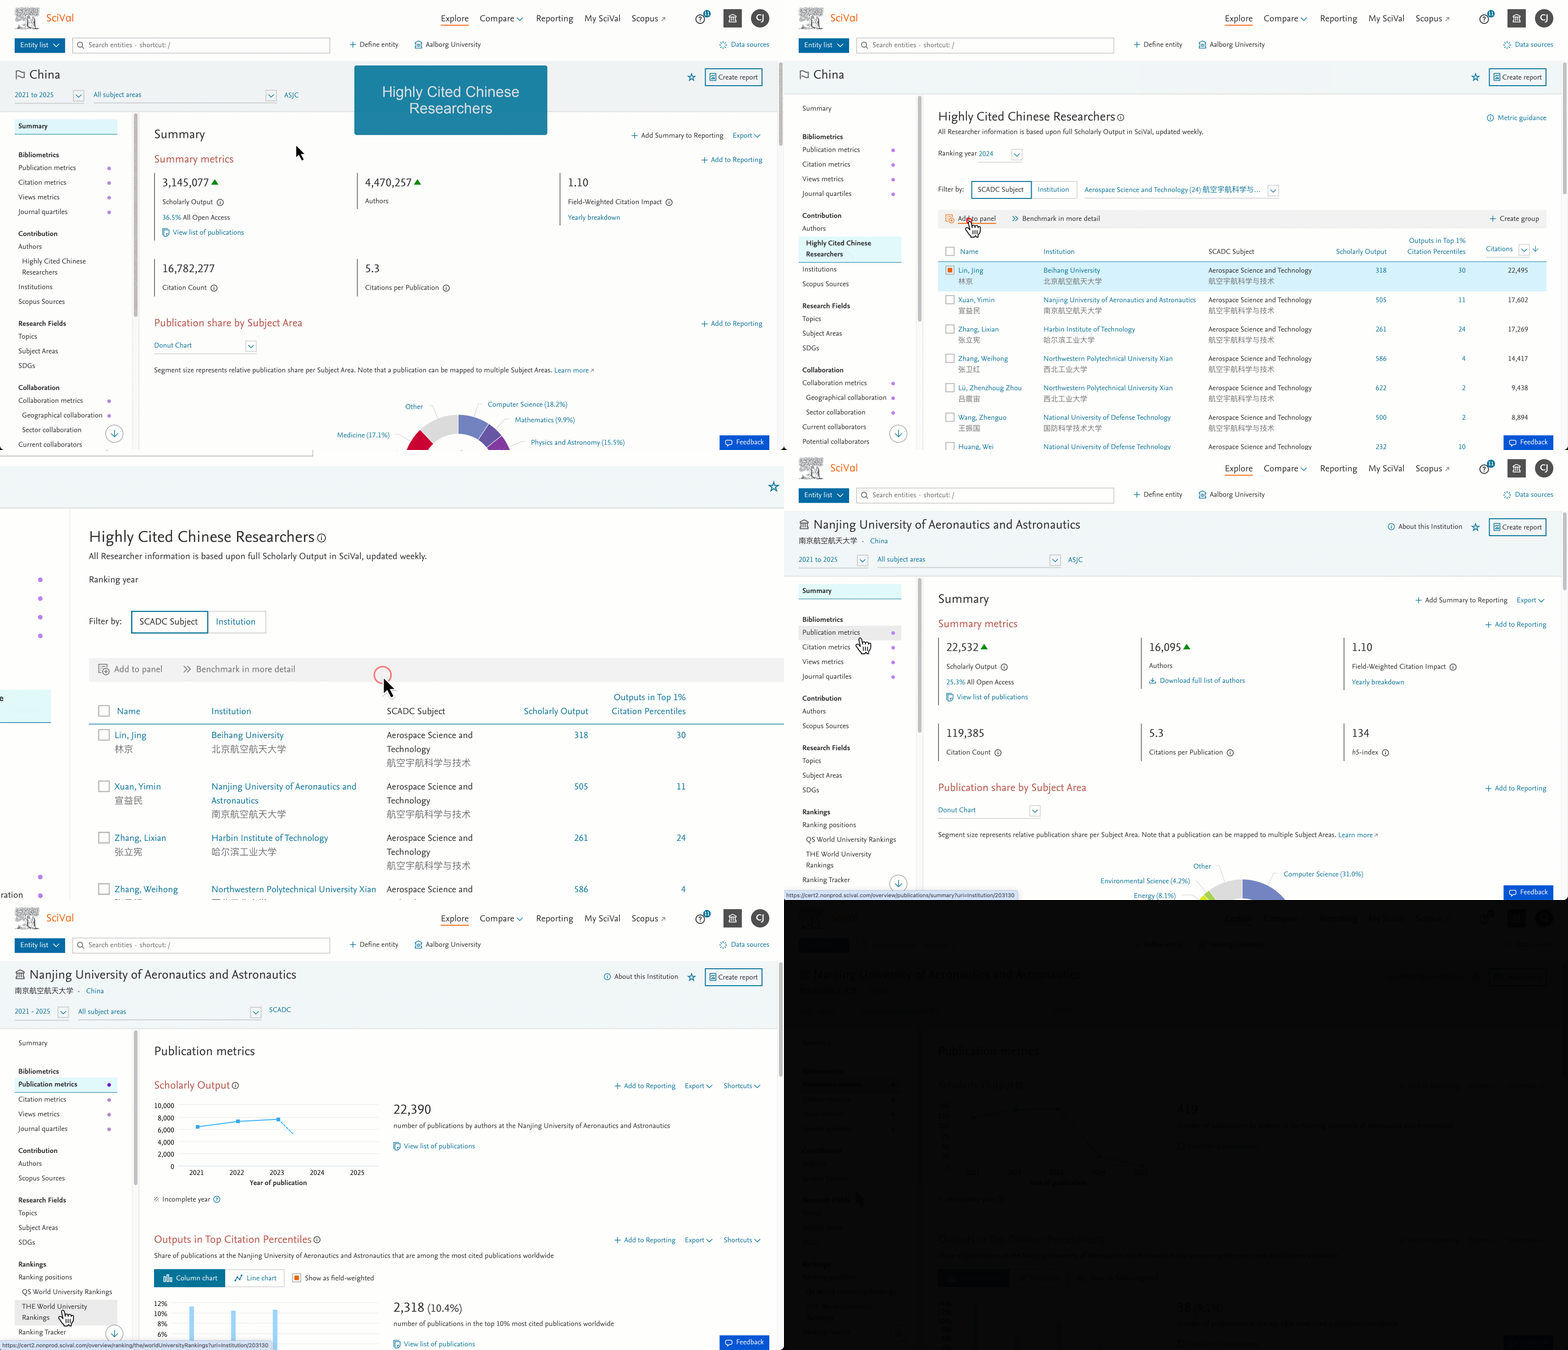
Check out the recently announced list of Highly Cited Chinese Researchers for 2024, categorized by subject area and institution and updated weekly. This list, released on March 25, 2025, is a collaboration between Elsevier and ShanghaiRanking consultancy.
Coming soon: Analyze any entity's contribution to the SCADCs with the new subject classification
In a few weeks, you will be able to analyze the output and metrics of any entity related to publications assigned to the SCADCs. This analysis will utilize the SCADC subject classification system, allowing you to filter data on both parent and child subject categories.
The SCADC subject classification is based on the degree-granting and academic training directory as announced and published by the State Council Academic Degree Committee (SCADC) and Ministry of Education of the People’s Republic of China.
The 13 parent categories and 111 subcategories are mapped at publication level, using machine learning techniques. New publications will be assigned to the respective subject categories of the subject classification on a weekly basis.
The SCADC Research Areas, which are available in SciVal, will remain accessible for the time being but will no longer be updated with new publications.
- Identify how strongly linked an entity’s publications are to their SciVal Topics
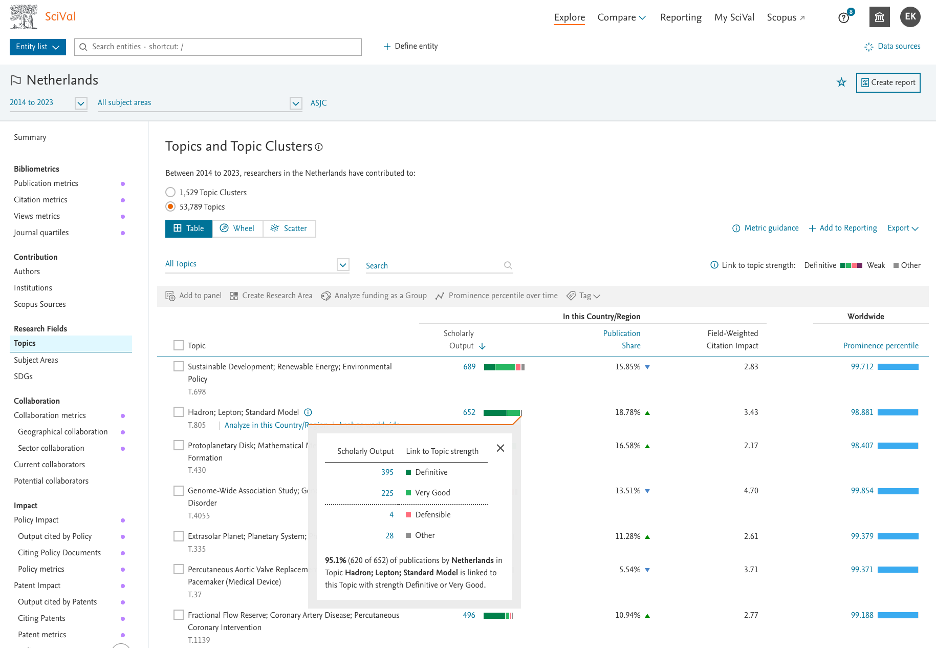
Gain insights in to how closely an entity's publications are linked to the Topic they are assigned. You can categorize these publications into core (more central) or peripheral (less central) based on the strength of their links to the Topic. This detailed breakdown is now available on Topics page allowing for a clearer understanding of publication centrality within each Topic.
Learn more about publication centrality
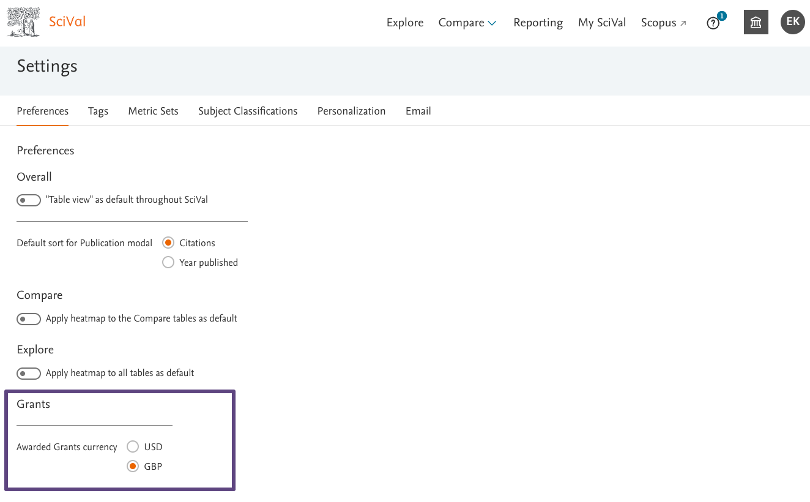
- Introducing the British Pound as a currency option for metrics in SciVal Grants
The British Pound currency, GBP, is now available for Awarded Grants Value metrics if you subscribe to SciVal Grants. While the default currency is set to USD (U.S. Dollar), users can switch to GBP in Settings using the Preferences tab.
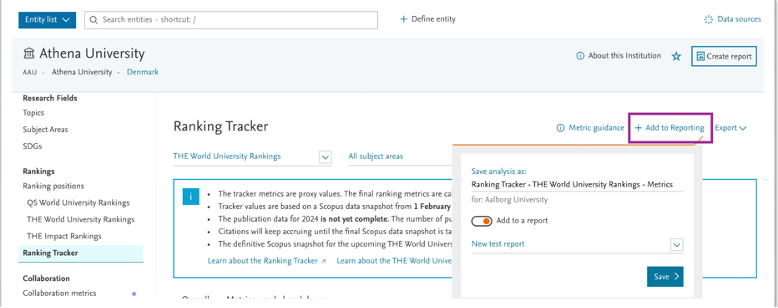
- Rankings Tracker – “Add to Reporting” now available to save and share your analyses
The Rankings Tracker now features the "Add to Reporting" functionality, allowing you to save your analyses for use in custom reports. This enhancement enables you to easily share your analyses and reports with other users.
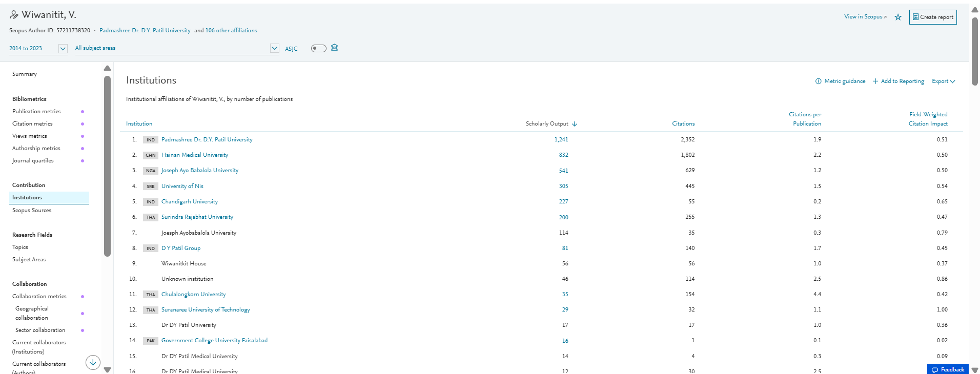
- View comprehensive affiliation histories for Researchers
We have removed the limit of 10 Institutions on the Institutions page for Researcher entities. You can now see all Institutional affiliations that a researcher has published with during the selected year range, providing a complete view of their scholarly output.
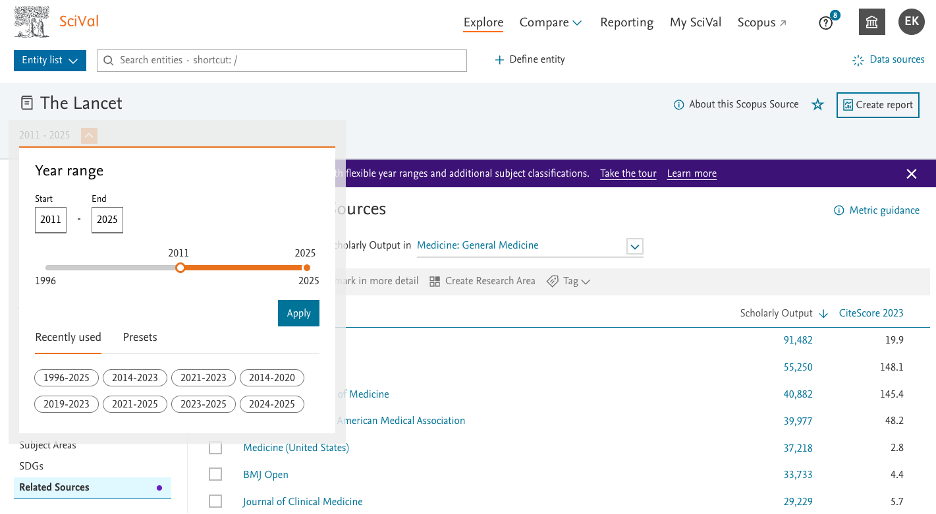
- Flexible year ranges now available for Related Sources within the Scopus Source entity
Flexible year ranges are now available for the Related Sources page available in the Scopus Source entity. This update is available following the migration to new technologies and is indicated by a purple dot in the left-hand navigation panel.
- Updates to entity headers in Explore
We have made minor visual adjustments to the entity headers in Explore to reduce their size and create more space for main page content. While some options may have moved slightly, all information remains available.
- Removal of Publications with datasets indexed in Data Monitor
The product Data Monitor is being decomissioned at the end of June 2025. As a result, we will be removing the Research Area in SciVal called "Publications with datasets indexed in Data Monitor." This removal will take place with our June release. Any analyses in reports that have been created using the Research Area, will automatically have the analyses removed. If you would like access to this data after the removal process has taken place, please ensure you save the reports and export any relevant analyses before the June release.
We are happy to announce a shift in our release themes. After successfully wrapping up our series on climate change, our new theme, natural wonders and phenomena, will celebrate extraordinary spectacles of nature.
The March 2025 release is dedicated to the Aurora Borealis, or Northern Lights. This stunning display occurs when charged particles from the sun are captured by the Earth’s magnetic field and collide with Earth’s atmosphere, heating the gases and creating shimmering colors—mainly green, but also red, purple, or blue. Best viewed in the polar regions like Norway, Canada, Iceland, Finland, and Alaska, it’s nature’s celestial light show!
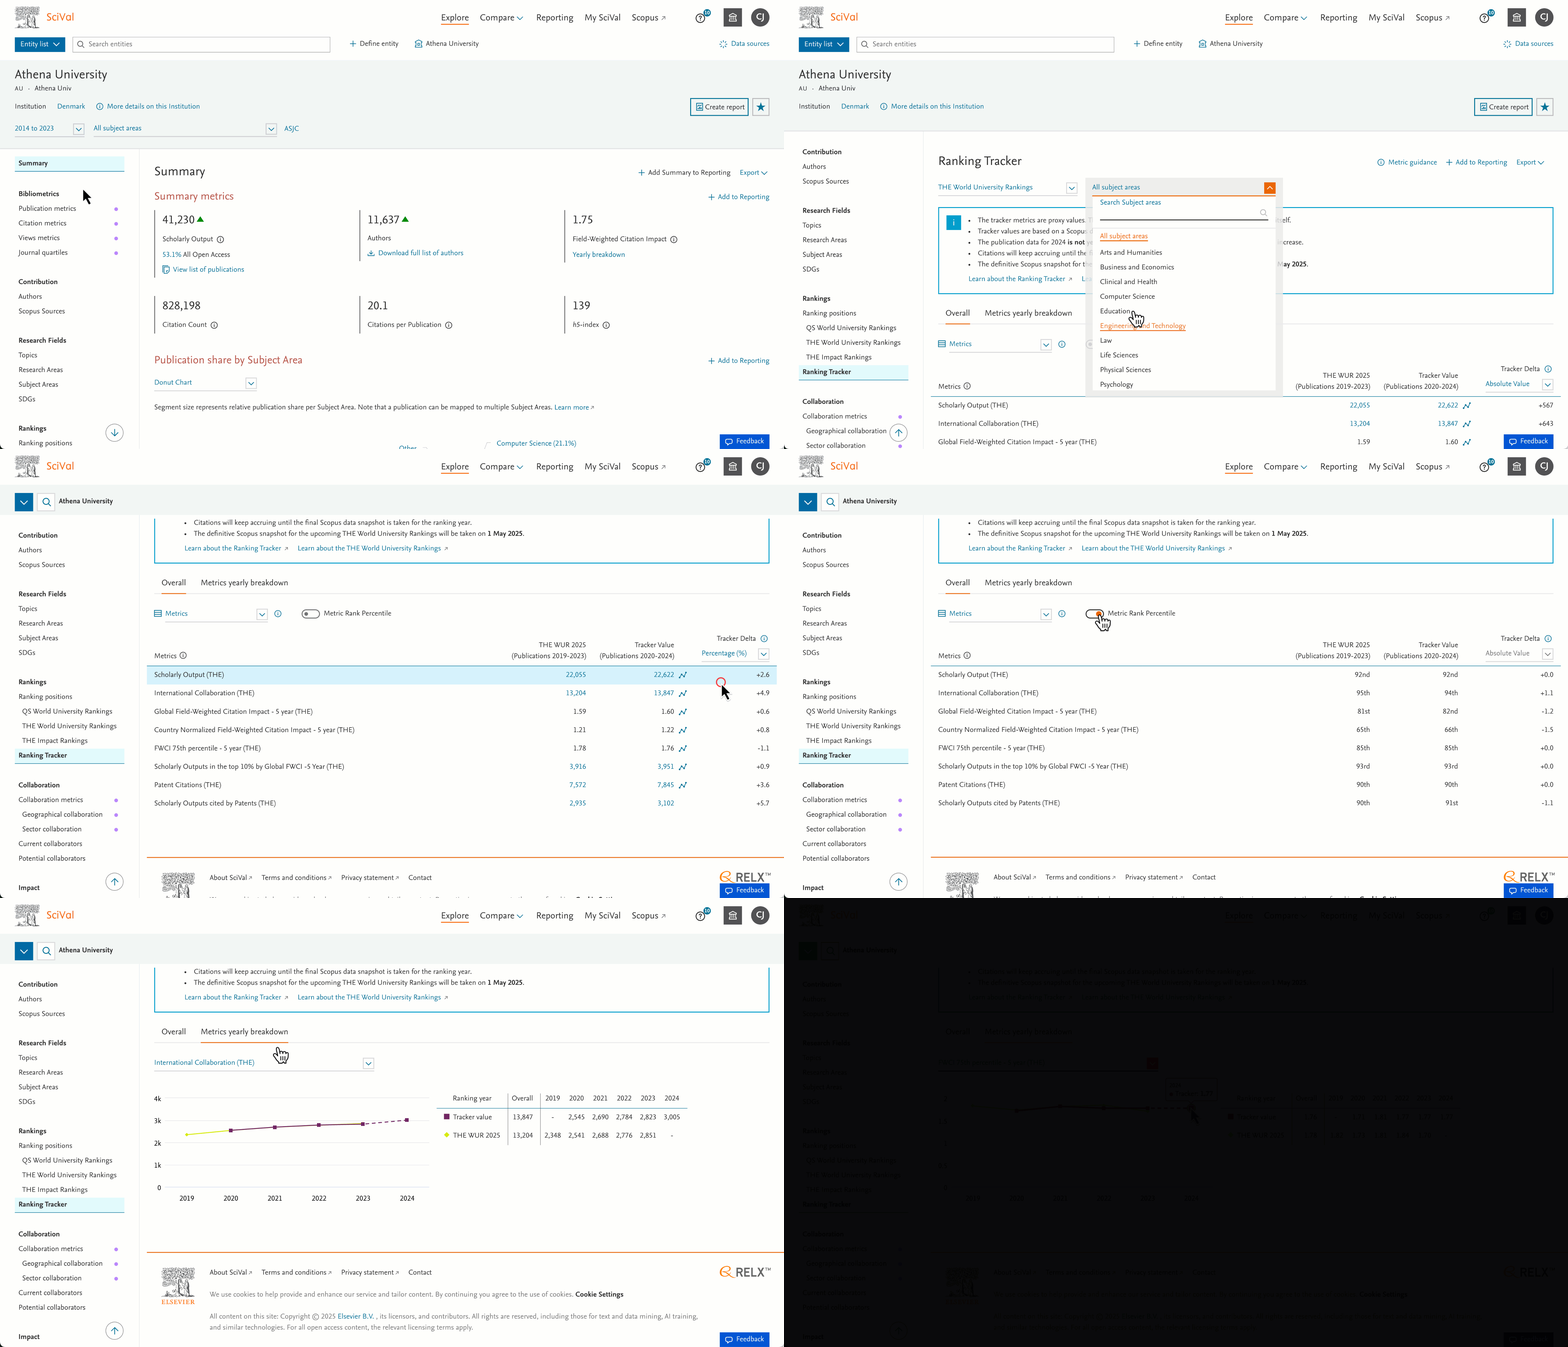
The Aurora release brings you the “Rankings Tracker” feature for the upcoming THE WUR, Grants matrix expansion, additional reporting options in Policy Impact and more.
- “Rankings Tracker” - track your progress in the bibliometrics for the upcoming THE World University Rankings in Explore
We are excited to introduce “Rankings Tracker”, a dynamic new feature to help you assess progress in the bibliometrics contributing to the THE World University Rankings. Using an interim Scopus data snapshot (1st February 2025) and applying the same methodology outlined by THE as the final rankings (THE WUR 2026), it enables you to see your current performance across the bibliometric drivers as well as in comparison to the latest published rankings edition (THE WUR 2025). The insights are also provided per THE Subject Area, providing rich insights, within the ranking cycle, to inform plans and decision making.
Want to know more about the Ranking tracker? Visit the Ranking tracker FAQ in the support center.
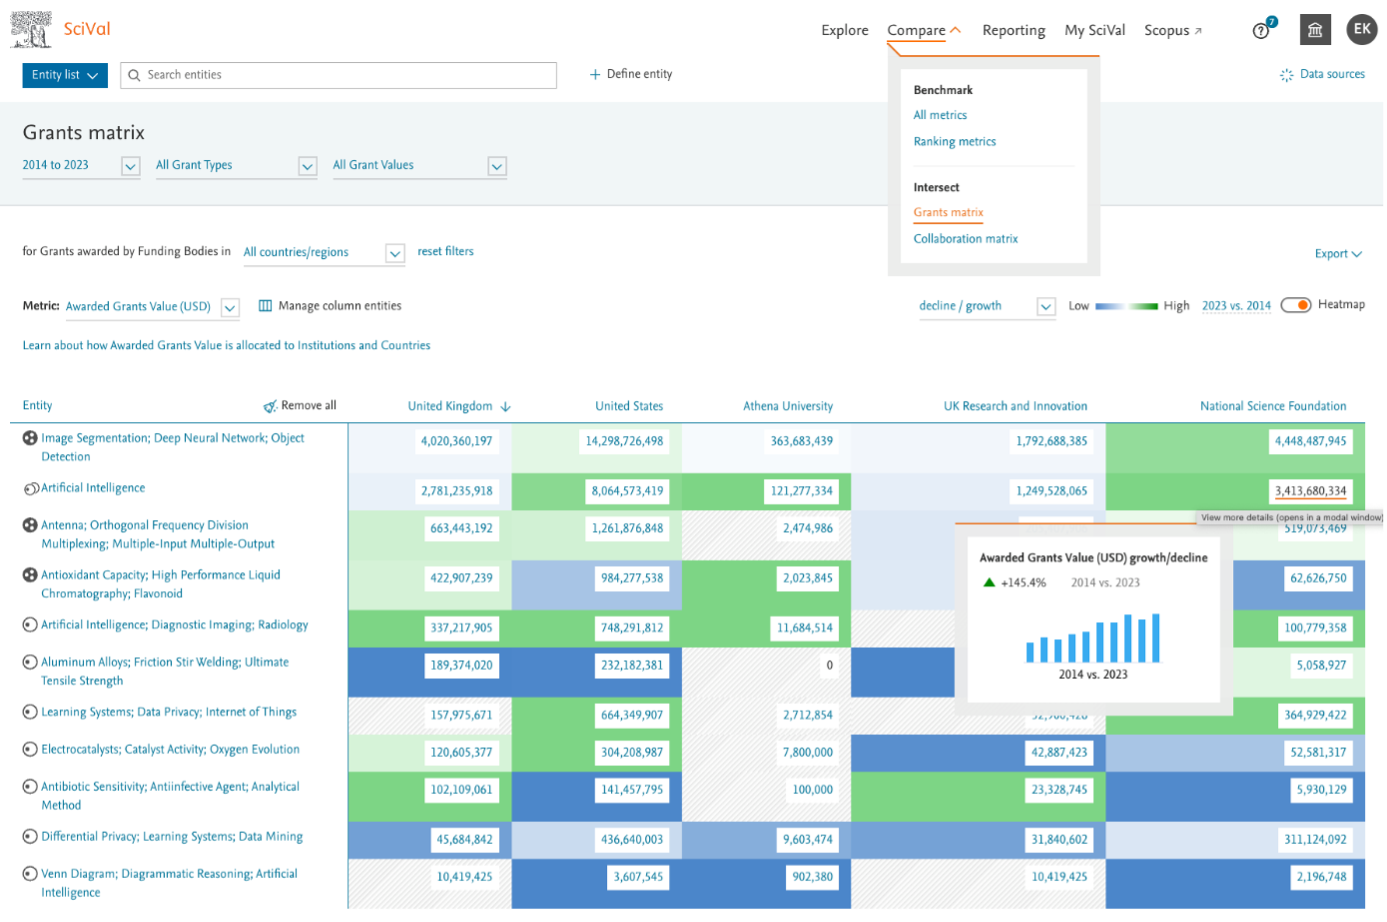
- Grants matrix expansion to simultaneous analysis of 5 entities.
You can now analyze up to 5 entities simultaneously, an increase from the previous limit of 2. Populate the matrix columns with any combination of Institutions, Countries or Funding Bodies and explore their funding insights in your priority fields of research by populating the matrix rows with SciVal Topic Clusters, Topics and/or Groups of Topics which you can create yourself.
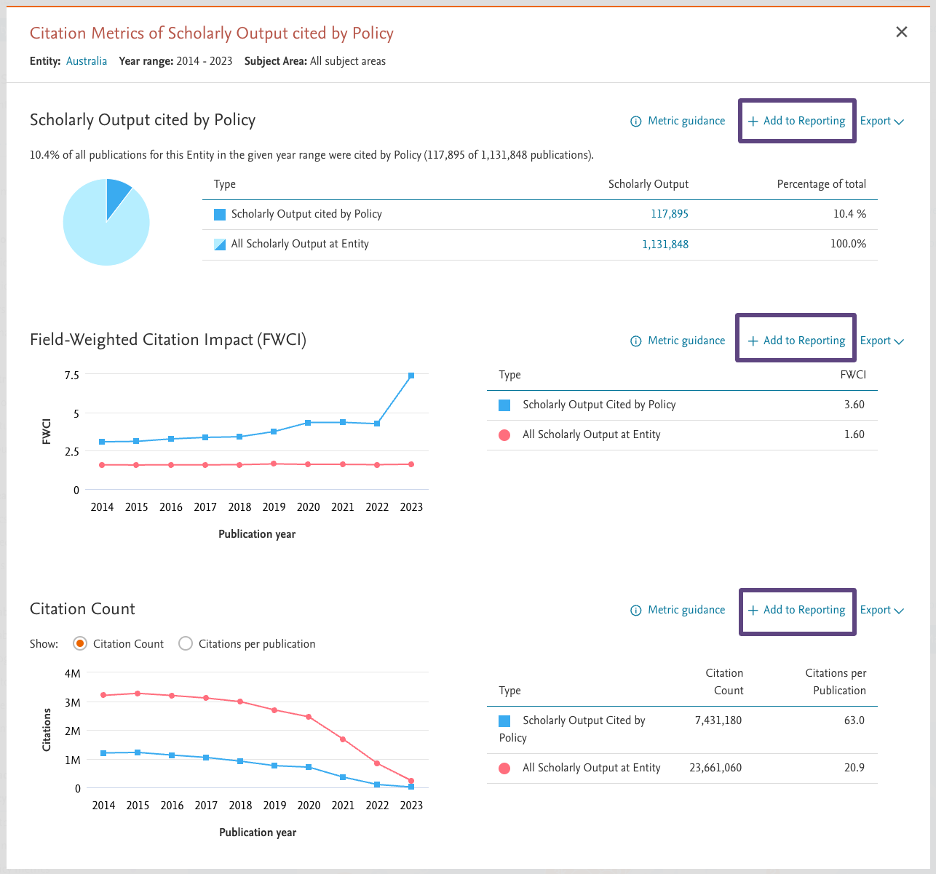
- Impact – add to reporting now available for all analyses in Policy “Analyze in more detail’
Share details of how your Policy-cited publications are performing compared to all your publications and include them in external analyses, with ‘Add to reporting’ links now available for all analyses in the ‘Analyze in more detail’ section of the Policy Impact page.
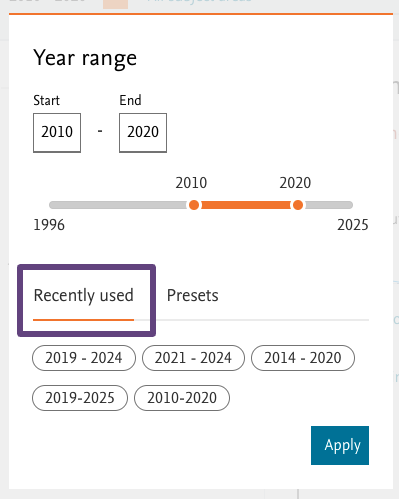
- Quick access to your recently used year ranges
Easily re-select any of your five most recently used year ranges. This 'Recently used’ feature enhances your experience on pages marked with a purple dot in the left-hand navigation panel, including Explore, Benchmark (All Metrics), and the Collaboration Matrix.
With the February 2025 release we aim to highlight zero waste principles that help combat climate change and promote environmental sustainability. By refusing single-use packaging, reducing consumption, and focusing on reusing and recycling, we can conserve natural resources, reduce greenhouse gas emissions, and support sustainable ecosystems.
The Zero release brings you the ability to benchmark your institution's performance to peers across the bibliometrics used in the THE Impact Rankings, THE World University Rankings by subject 2025, improved entity search and more.
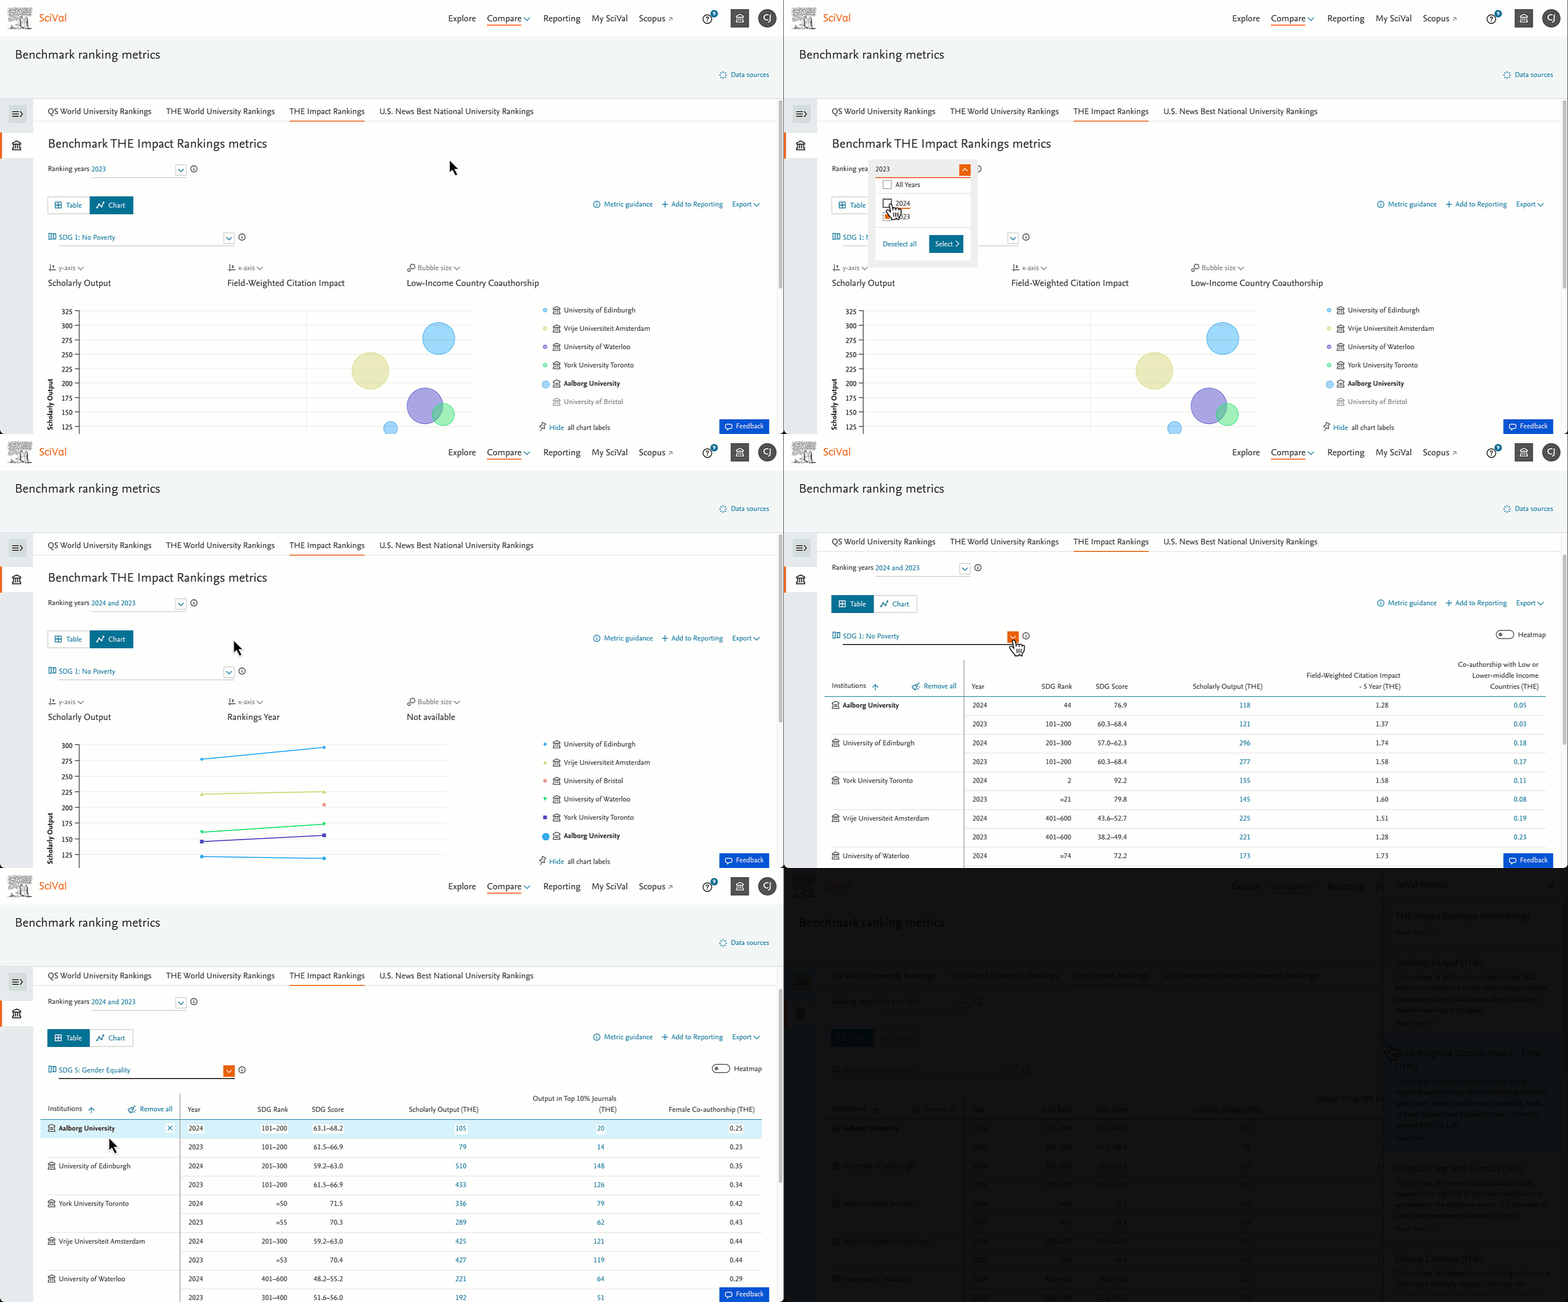
- Benchmark to peers across the THE Impact Rankings bibliometrics in Compare
Analyze and benchmark your institution's performance to peers across the bibliometrics used in the THE Impact Rankings in Compare. THE Impact Rankings evaluate university performance and success against the UN Sustainable Development Goals (SDGs). You can now choose any single SDG and compare to multiple peers across all research metrics in the rankings for that SDG, enabling you to identify and highlight your strengths and assess performance against peers through the lens of the SDGs.
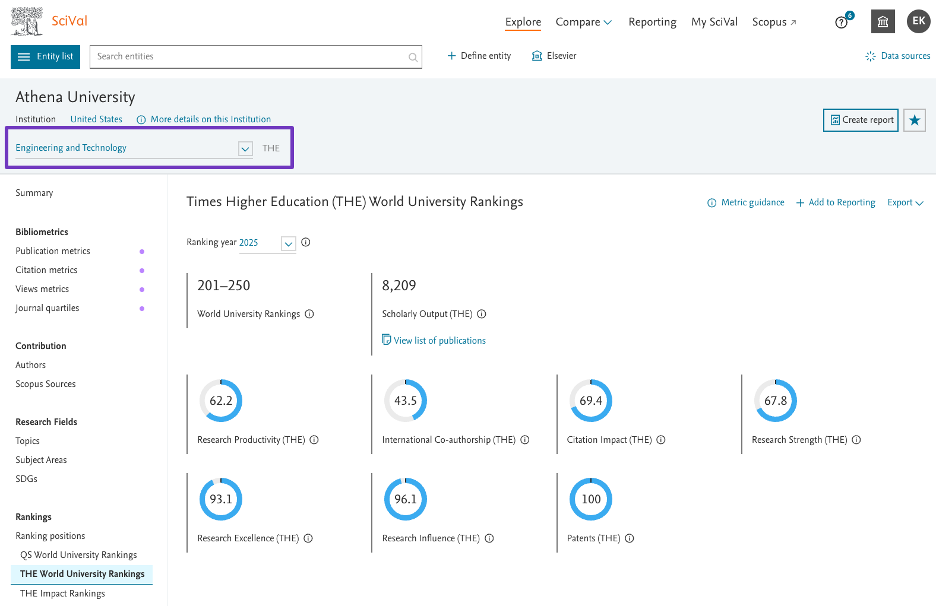
- THE subject area level Scores are now available for the THE World University Rankings by subject 2025
The THE World University Rankings now feature scores for subject areas (THE World University Rankings by Subject announced on January 22nd, 2025). Analyze and understand the underlying bibliometric datasets and how they contributed to the scores, helping to assess the performance of your institution across the THE Subject areas.
- Find entities more easily with more flexible search results in the Advanced Search and My SciVal
The improved search methodology previously introduced in the Global search and entity panel, is now also available in the Advanced entity search and My SciVal. In addition to exact matches, the search will return partial and non-sequential matches, facilitating finding entities without the need to know or spell their exact names. These flexible results can be combined with any of the entity filters in the Advanced Search and My SciVal, allowing for additional granularity and ease in finding entities of interest.
The improvements apply to Institutions and Groups, Researchers and Groups, Country Groups, Publication Sets, user-defined Research Areas, and Topic Groups.
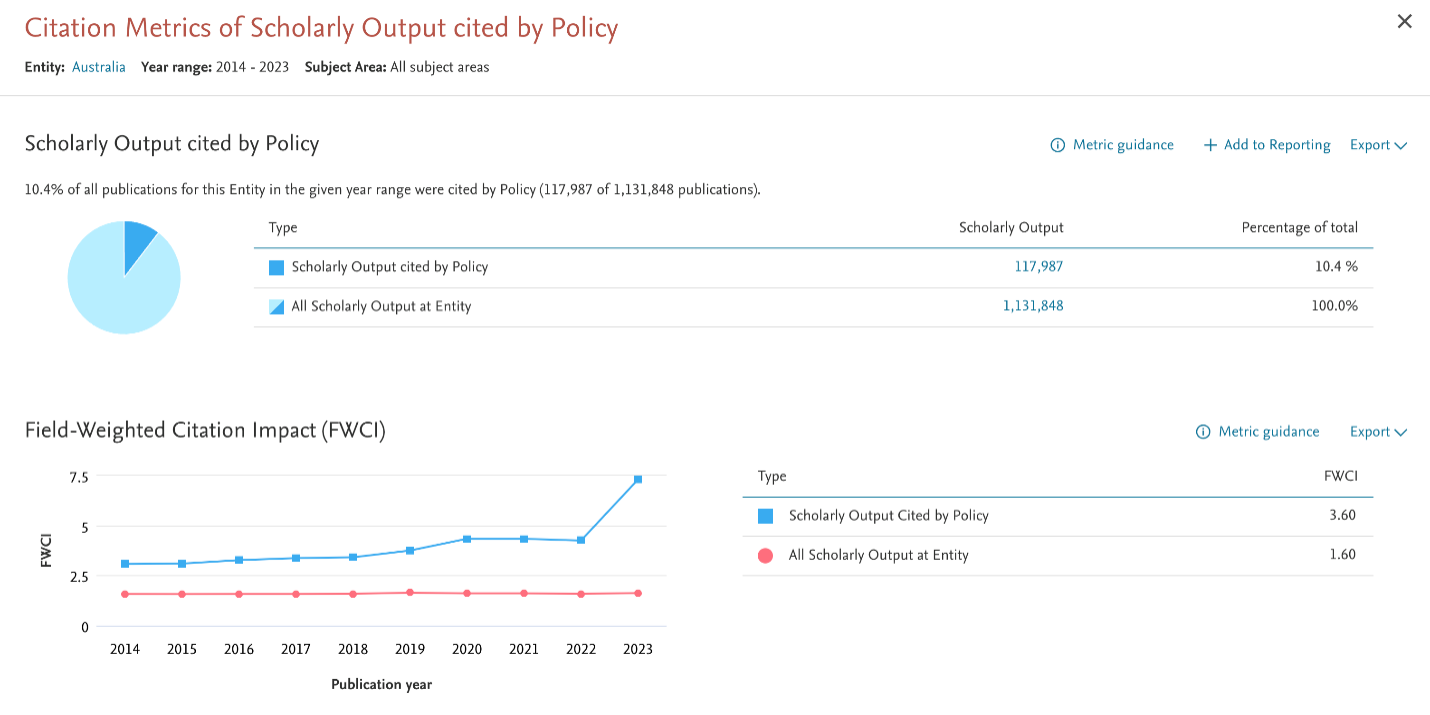
- Impact – add to reporting, exporting and metric guidance in Policy ‘Analyze in more detail’
Share details of how your Policy-cited publications are performing compared to all of your publications and include them in external analyses, via the new reporting and exporting links in the ‘Analyze in more detail’ of the Policy Impact page. Additionally, new ‘Add to Reporting’ links have also been included in the policy metrics page to enhance Reporting further.
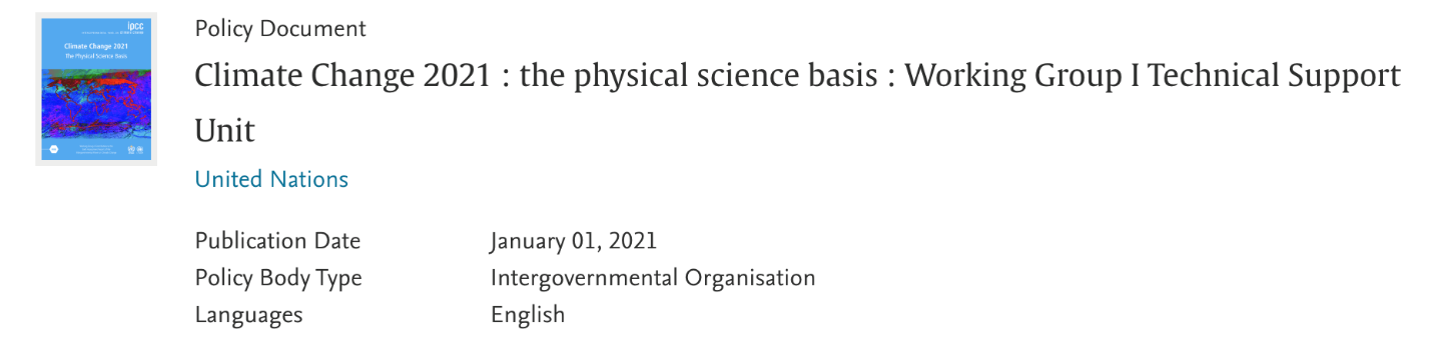
- Impact – we can now process very large policy documents
There were 5 policy documents in our database that were so large, due to the number of Scholarly Outputs they cited, that we were not able to process their metrics. We have now overcome the issue and where applicable, you will see them again in SciVal. The 5 policy documents were:
- Climate Change 2021: The Physical Science Basis
- AR5 Climate Change 2014: Impacts, Adaptation, and Vulnerability
- AR6 Climate Change 2021: The Physical Science Basis
- Climate Change 2022 : Impacts, Adaptation and Vulnerability
- Carbon Tetrachloride (CASRN : 56‐23‐5) Bibliography : Supplemental File for the TSCA Scope Document
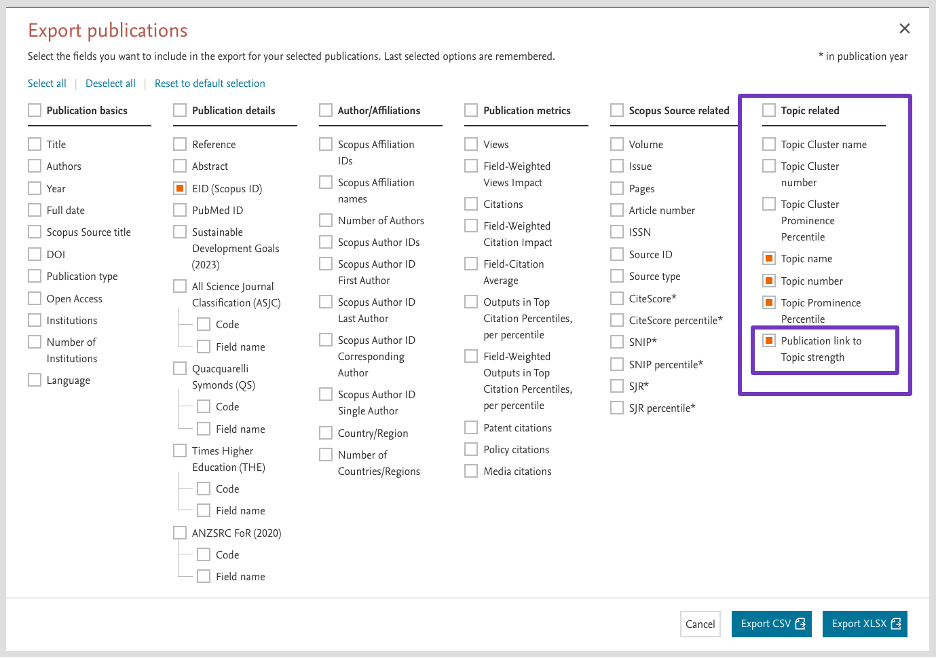
- Use publications Export to analyze how strongly publications are linked to their SciVal Topics
You can now include ’Publication link to Topic strength’ (or publication centrality) information in your publications Export to analyze how central or more peripheral the publications are to their Topics.
Learn more about publication centrality
- Retirement of Topics transition functionality
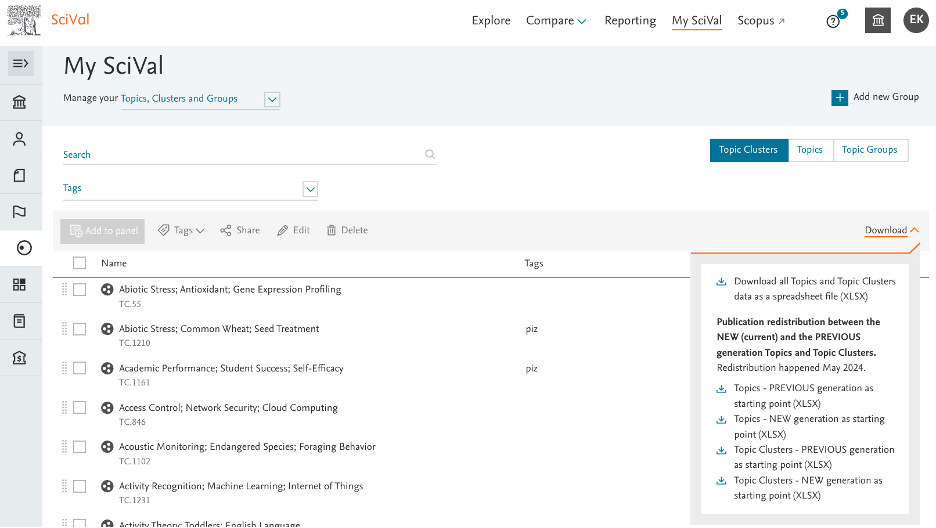
Eight months after the launch of the Next Generation of SciVal Topics – in May 2024, the old to new Topics transition functionality is now retired. You can analyze the publication redistribution from previous generation Topics and Topic Clusters to new generation Topics and Topic Cluster through the Topics download files in My SciVal.
 Release Notes 2023-2024 Release Notes 2021-2022 Release Notes 2019-2020 Release Notes 2017-2018
Did we answer your question?
Related answers
Recently viewed answers
Functionality disabled due to your cookie preferences