
View by category
The December release is dedicated to Hydroelectricity which is a form of renewable energy that uses the power of moving water to generate electricity. Hydroelectricity can provide large amounts of low-carbon electricity, making it a key element for creating secure and clean electricity supply systems.
The Hydroelectricity release brings you a new export option for maps in the Collaboration module, the ability to retrieve SDG information in the Publication Lookup API, and the top 5 publications by FWCI for any entity in the Overview module.
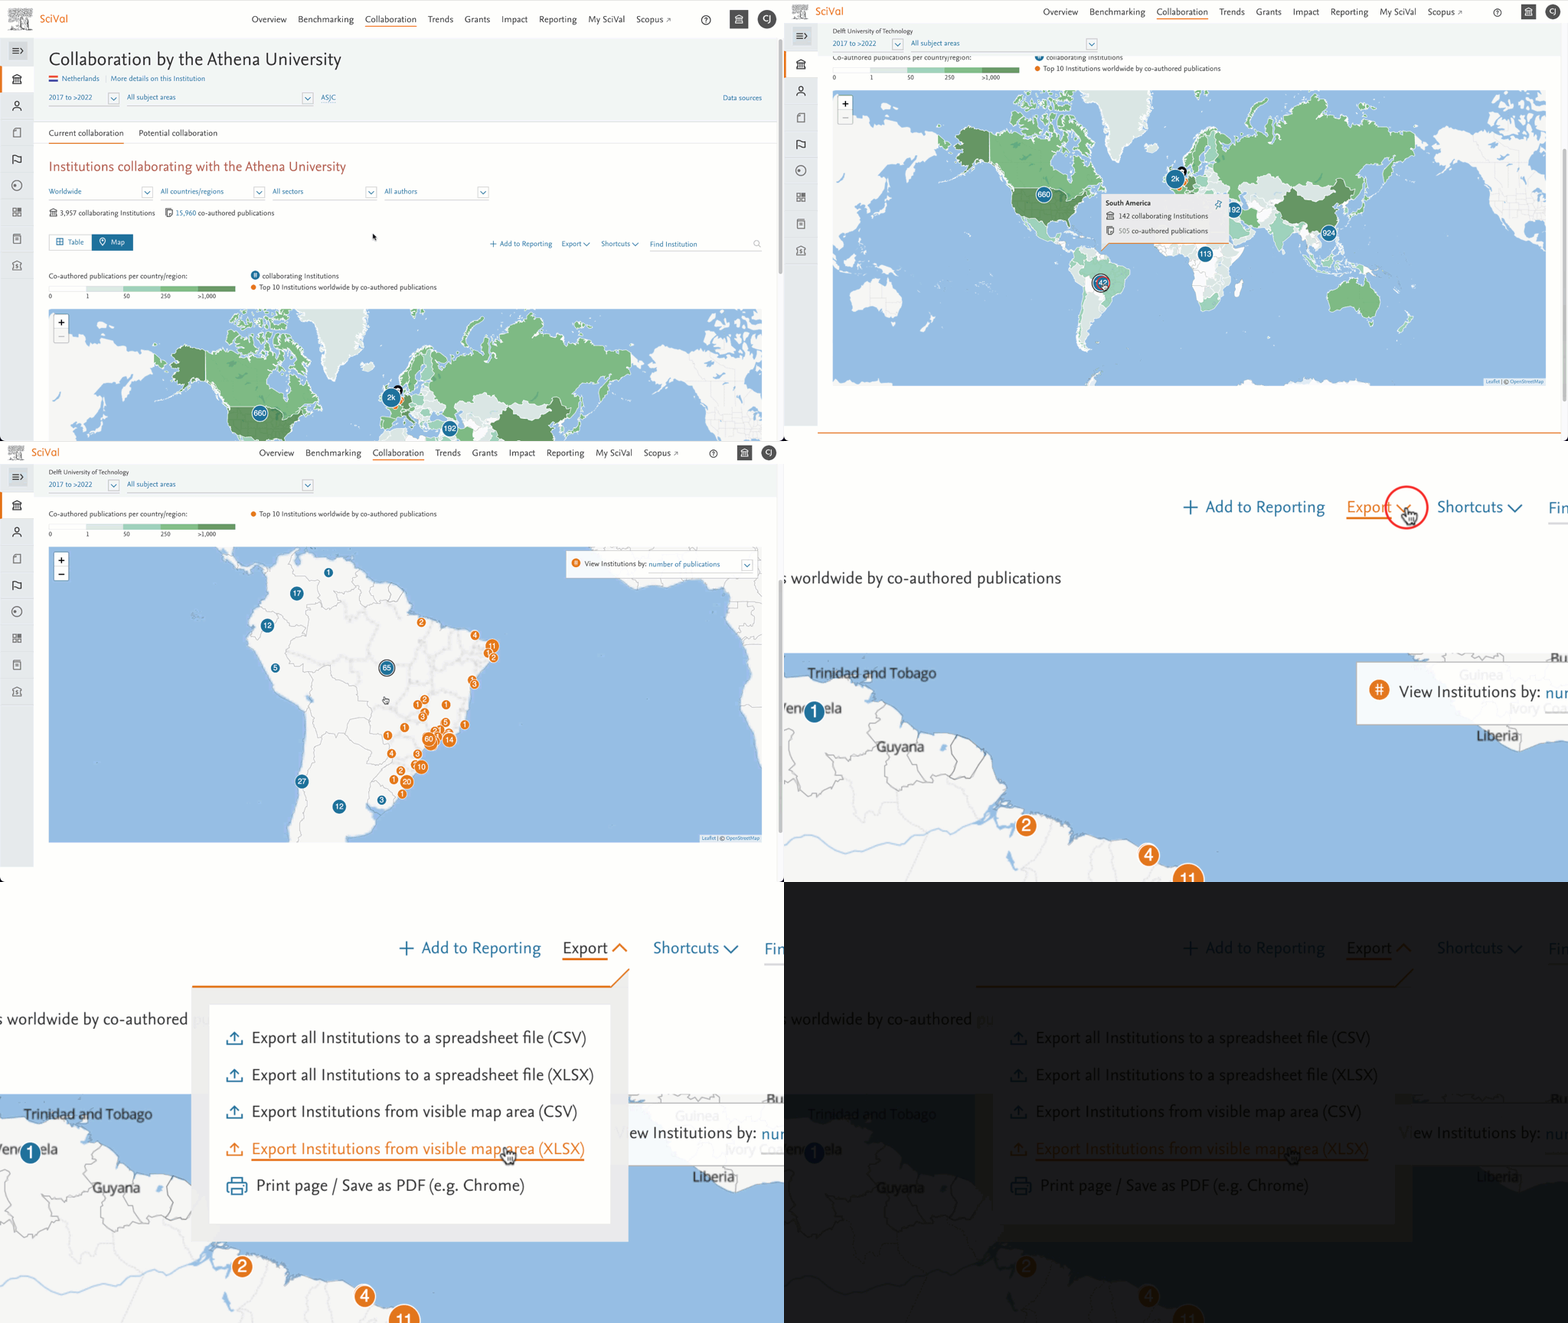
- Export Institutions from geographical areas of interest in the Collaboration module
The new export option for maps in the Collaboration module exports those Institutions that are visible on the map after zooming in. This allows you to focus on specific geographical areas of interest, such as cities, and retrieve information on current and potential collaboration partners from that area. The previous export which includes all Institutions that match your filter selection remains available.
- Retrieve SDGs associated with publications in the Publication Lookup API
Create more granular metrics per SDG for the entity of analysis by retrieving the SDGs associated with a publication. - View the top 5 publications by FWCI for any entity in the Overview module
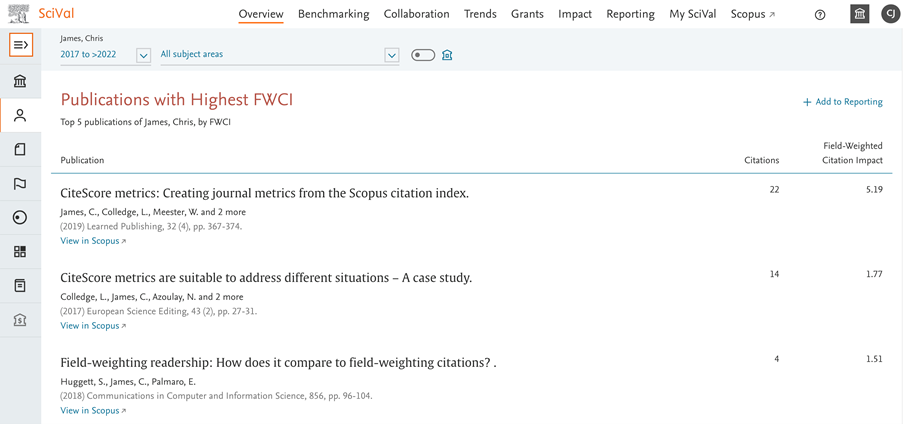
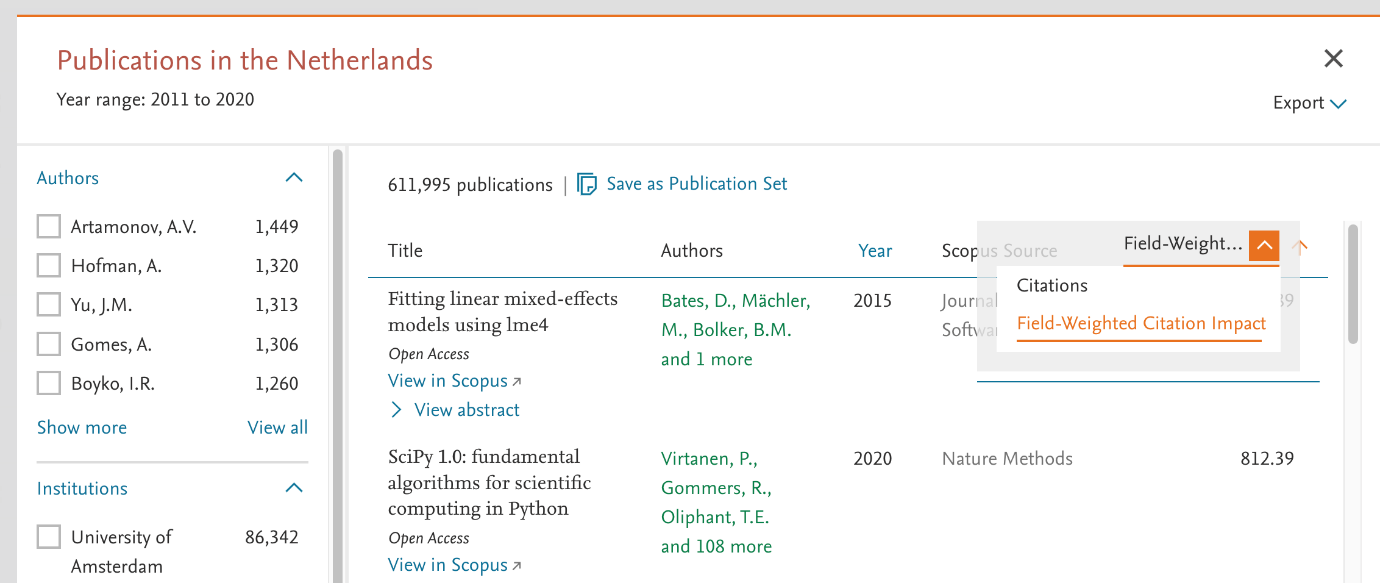
This new section in the Overview module allows you to identify the top 5 Publications by Field-weighted Citation Impact (FWCI) for the entity you are analysing. This is particularly useful for small entities where a highly cited publication can affect the entity’s overall FWCI. This way you can look at the FWCI of each individual publication and add that to a report. The list can be found at the bottom of the Summary page in the Overview module.
- Metric calculation examples for Outputs in Top Citation Percentiles and h-indices
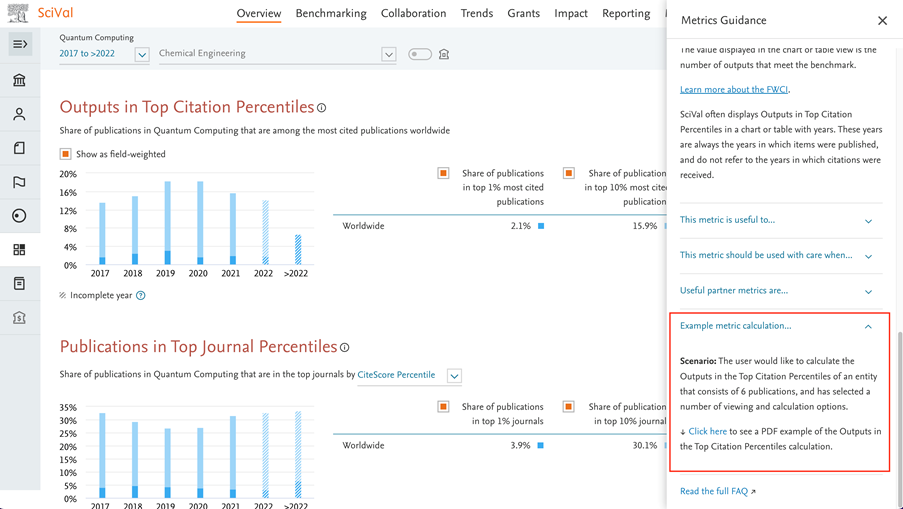
To increase transparency on the calculation of metrics in SciVal, we have added calculation examples for Outputs in Top Citation Percentiles and h-indices to the flyout panel and Support Centre.
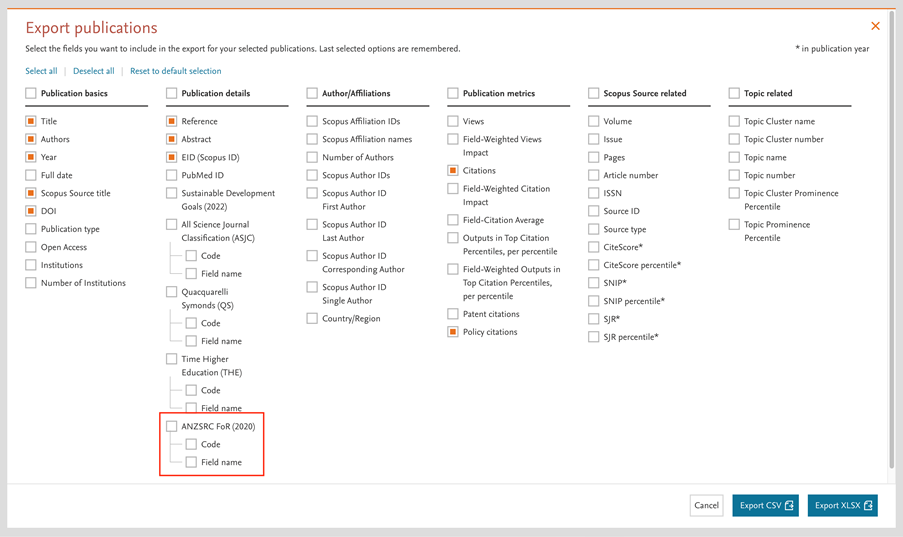
- Select the ANZSRC FoR classification as a publication export option
It is now possible to include the subject area names and codes for the FoR subject area classification when exporting lists of publications from the publications modal.
- Updated Topic to ASJC mapping
The ASJC assignment for around 60,000 Topics has been updated to more accurately reflect the research fields of the respective Topics. The ASJC assignment for all Topics can be found in the spreadsheet which can be downloaded from My SciVal.
Impact module
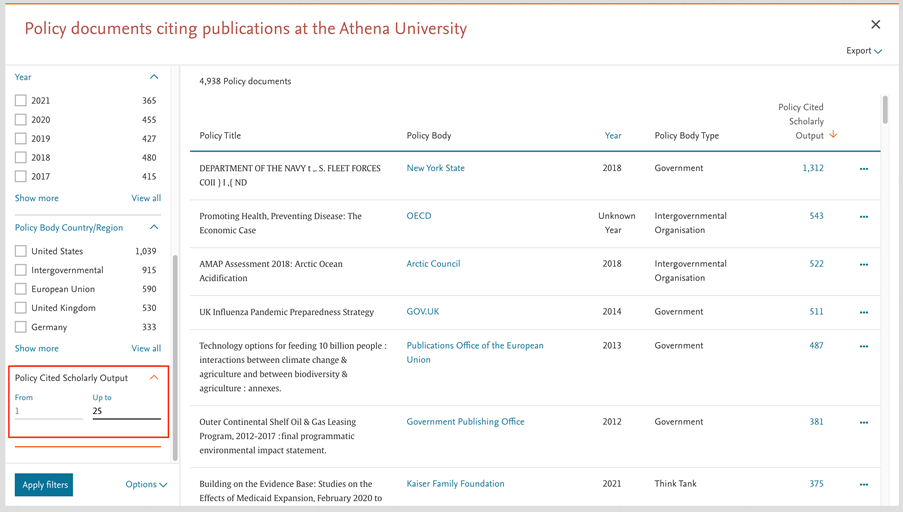
- Find the policy documents where you are having the most impact
A new filter in the policy document page allows you to filter out policy documents that reference a large amount of Policy Cited Scholarly Output so you can more easily find all of your policy impact.
- Understand the context of your policy impact
You can now link directly from most policy mentions, to the page in the policy document PDF mentioning the research of interest. This lets you easily read the citation context, along with the surrounding paragraphs without the need to manually find the correct page number.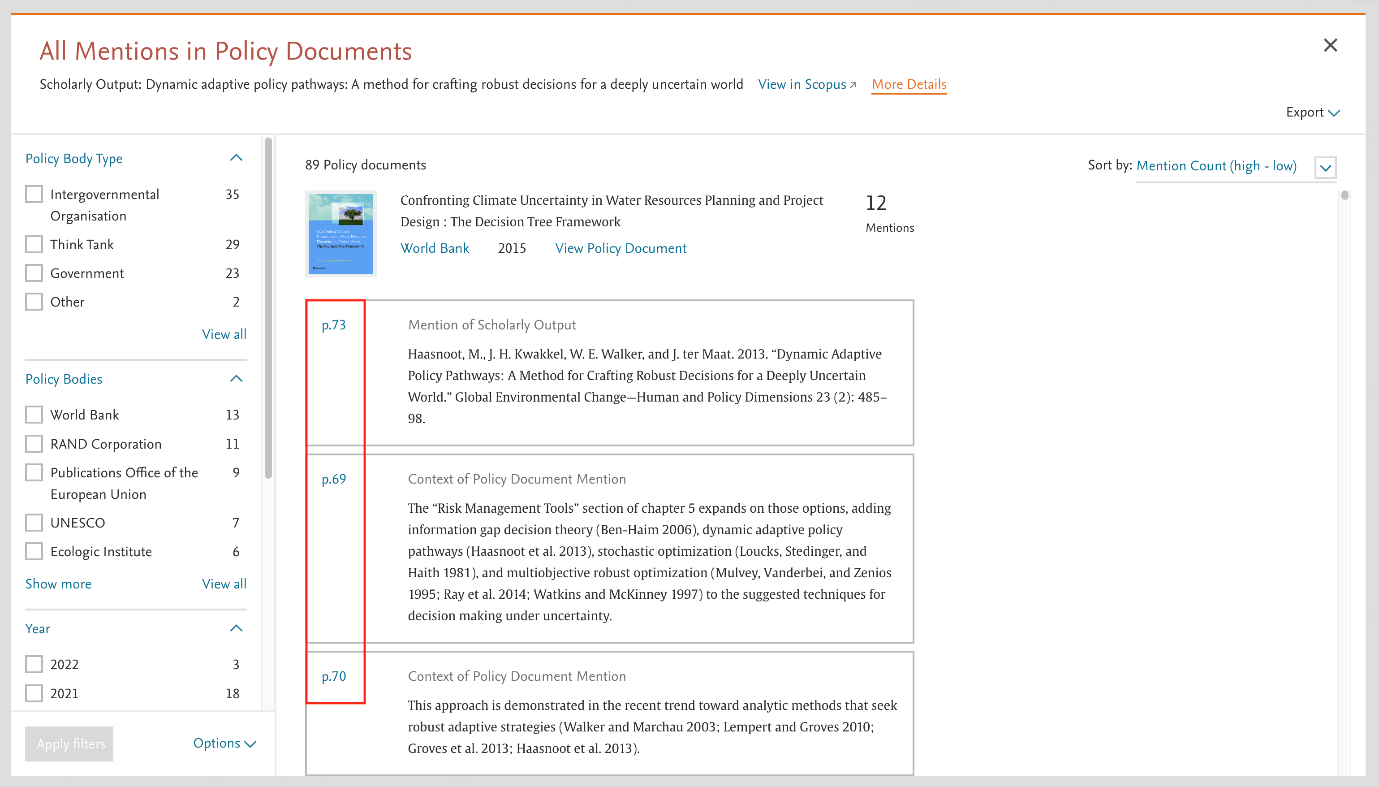
Grants module
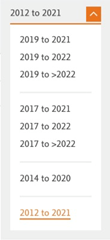
- More year ranges available in SciVal Grants
The Grants module now enables you to analyze all year ranges available in other modules, increasing from the previously available two-year ranges only.
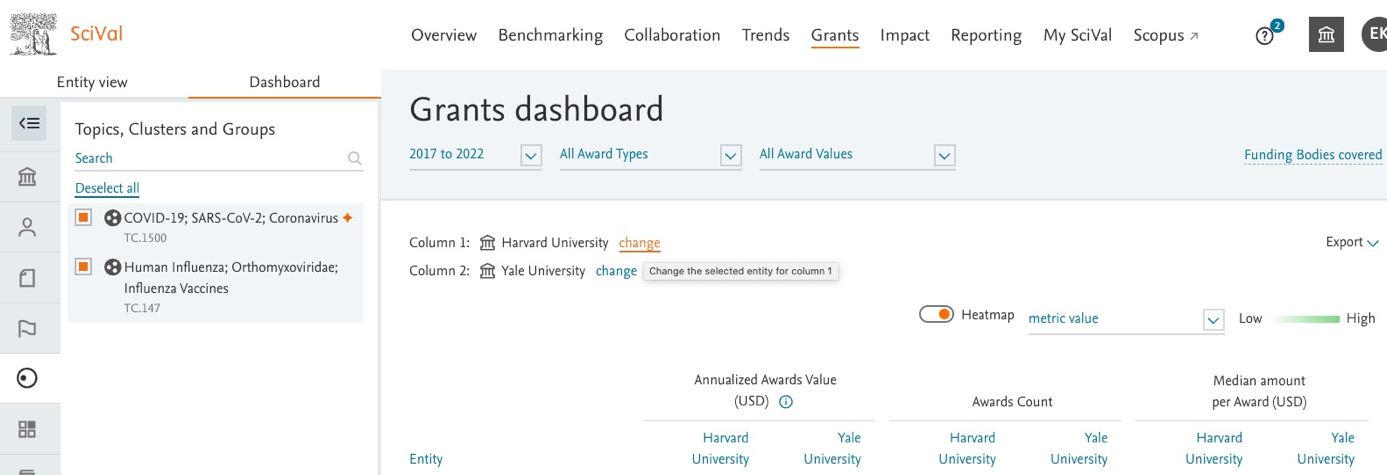
- New Dashboard configuration options in SciVal Grants
You can now use Funding Bodies in addition to the existing countries and / or institutions options for populating the dashboard columns. This enables you to understand how research fields were funded by different Funding Bodies, or what portion of a country or global funding comes from a certain funder.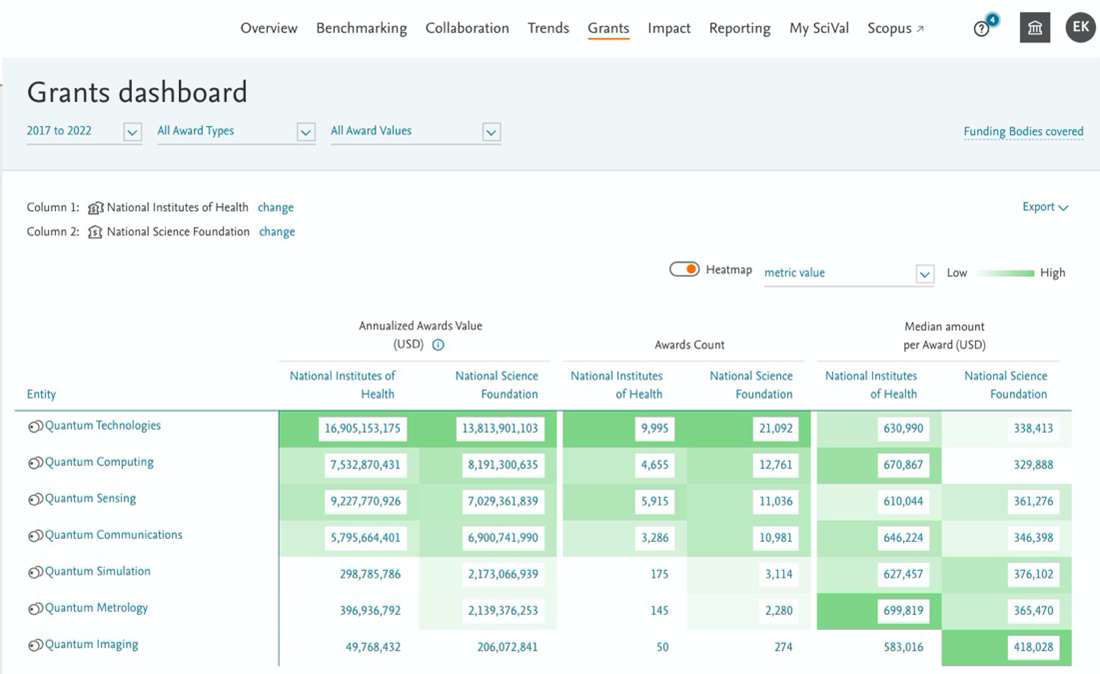
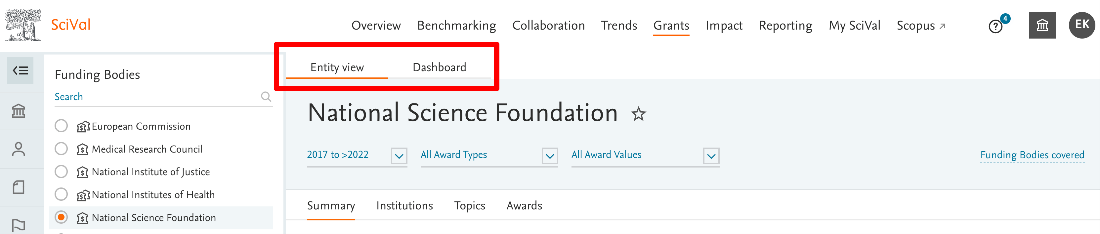
Please note, the switch in between the Dashboard and Entity view is relocated, so that it is easier to find.
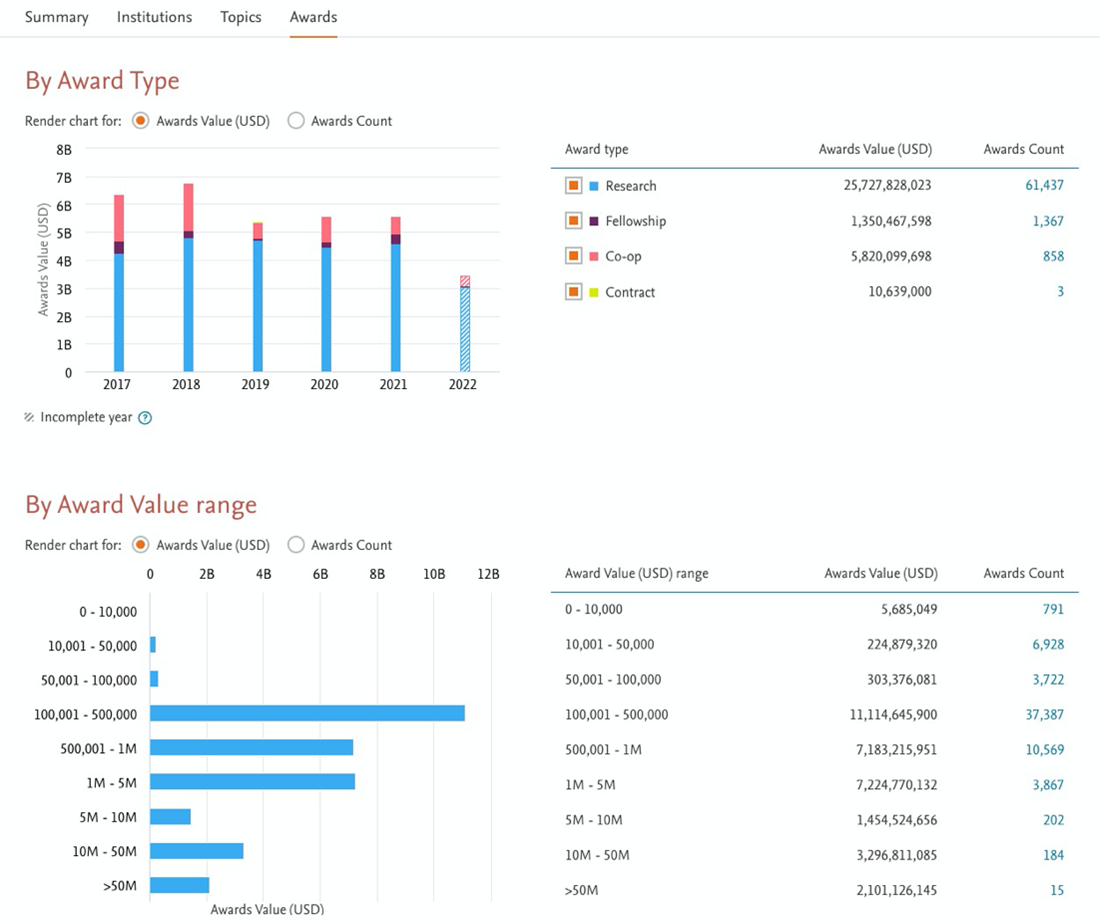
- View Awards distribution by Award Value range chart
Understand the awards distribution by value – the chart is available in “Awards” tab across the Grants module.
Other release items:
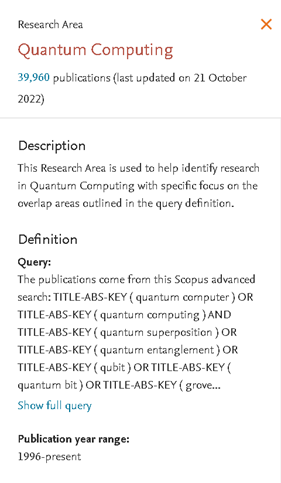
- Several SciVal-provided Research Areas have been updated with new publications. The “Quantum Metrology” and “Quantum Computing” Research Areas now include publications up until October 21, 2022. The “Artificial Intelligence - based on Elsevier AI Report methodology” Research Area contains publications up until October 03, 2022.
- Over the past few months we have hidden 4 metrics in the Benchmarking module with the plan to remove them in the new year. We have received feedback from a number of customers that 2 of the metrics are essential to their work. We have therefore decided that we are going to remove the Scopus Source Title Count and the Field-Weighted Mass Media metrics from SciVal in early 2023 and keep the Subject Area Count and Number of Citing Countries metrics.
The October release is dedicated to green energy. As energy generated from natural resources emits little to no greenhouse gases or pollutants into the air, increasing the supply of renewable energy to replace carbon-intensive energy sources can contribute greatly to tackling climate change.
The October release brings you more context to scholarly citations in the Impact module, the ability to retrieve metrics for publications from 1996 onwards through the API, and the option to export larger publications sets with up to 20,000 documents from Scopus directly into SciVal.
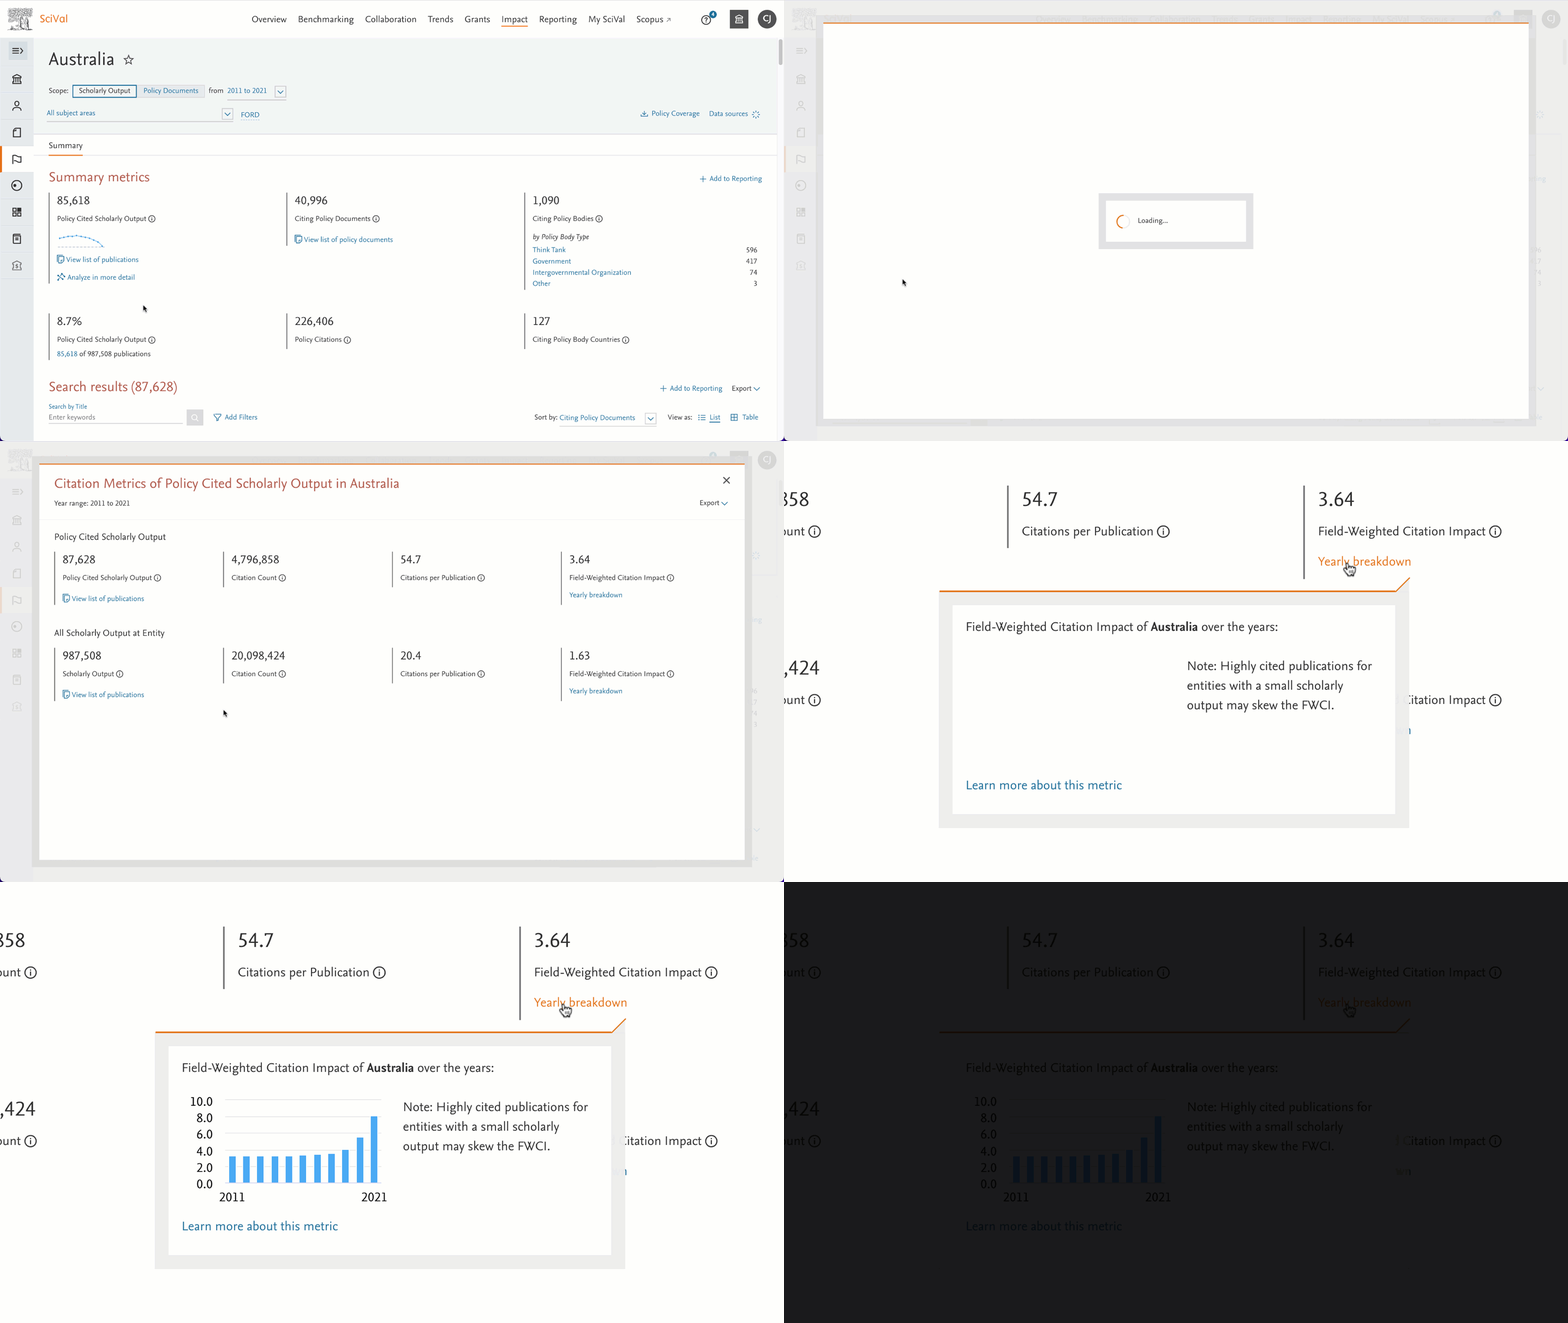
- Get context to the scholarly citations of the Policy Cited Scholarly Output
Directly compare the scholarly citation performance of an entity’s Policy Cited Scholarly Output, vs all of their output during the same time period. The 4 provided metrics let you quickly see if the publications are punching above their weight in academic citations.
- Retrieve metrics for any publication from 1996 onwards with the Publication Lookup API
The SciVal Publication Lookup API now provides metrics for any publication available in SciVal (published 1996 or after) - previously old publications (between 1996 and 2011) were excluded. - Export and name larger sets of documents from Scopus directly into SciVal with the new 20,000 publications limit
The publication limit to export and name a Publication Set from Scopus to SciVal has been raised from 2,000 to 20,000 publications. Previously an export to SciVal greater than 2,000 publications received a generic name. This new feature allows you to more easily organize and find your Publication Sets in SciVal.
Note: You need to use the new version of the Scopus results page for this functionality to work 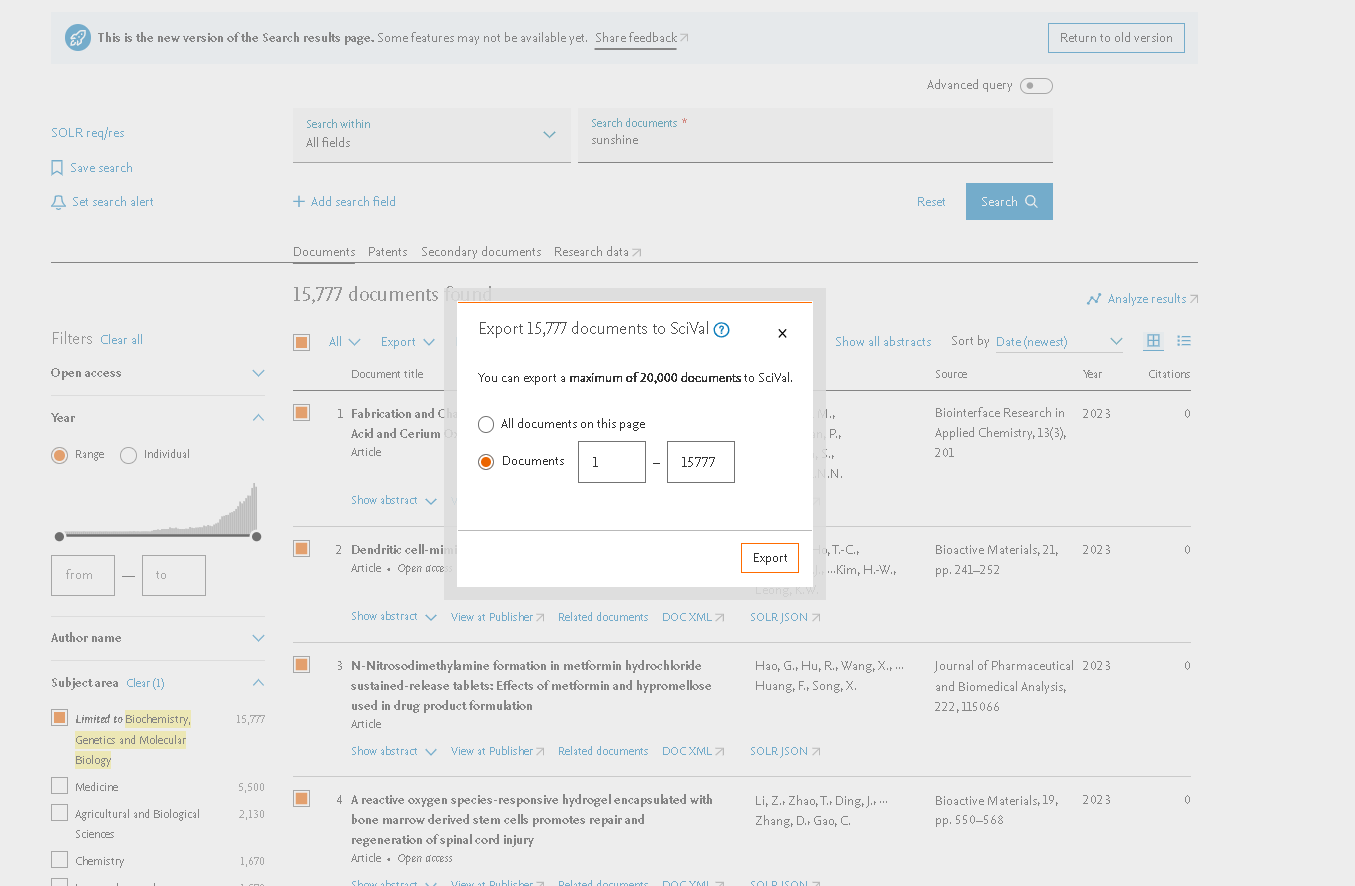
- Improvements to left hand panel: identify entities you have added and quickly clear your panel
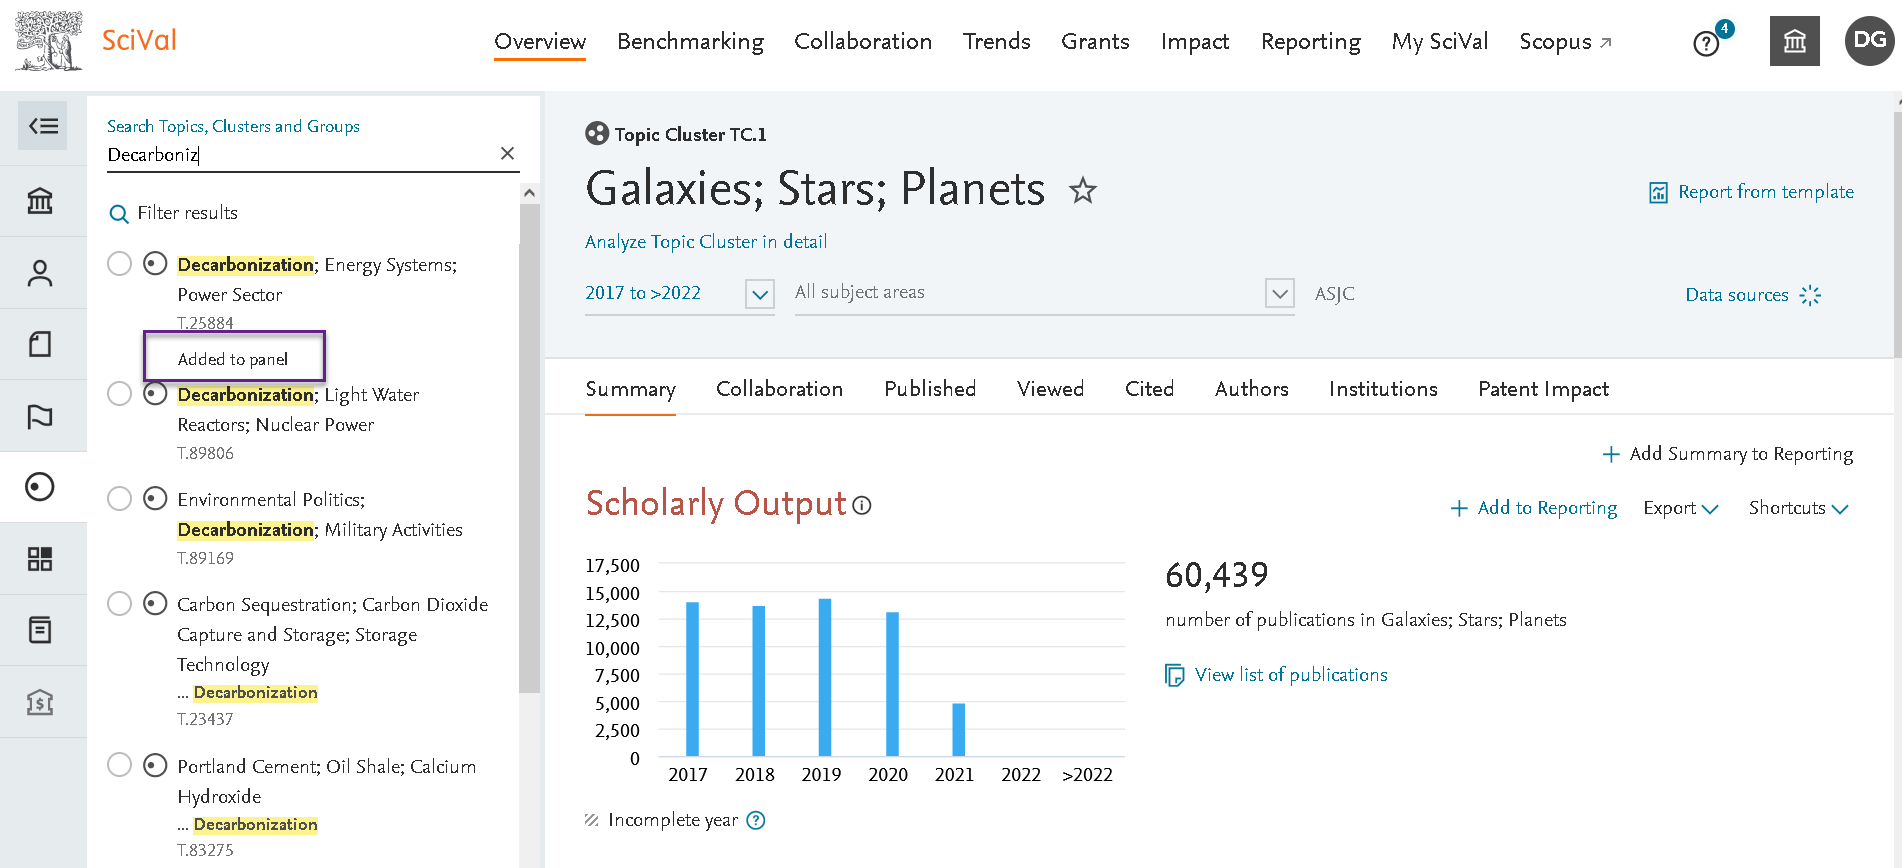
The “Added to panel” label allows you to distinguish between entities you have already added and entities not yet on your panel.
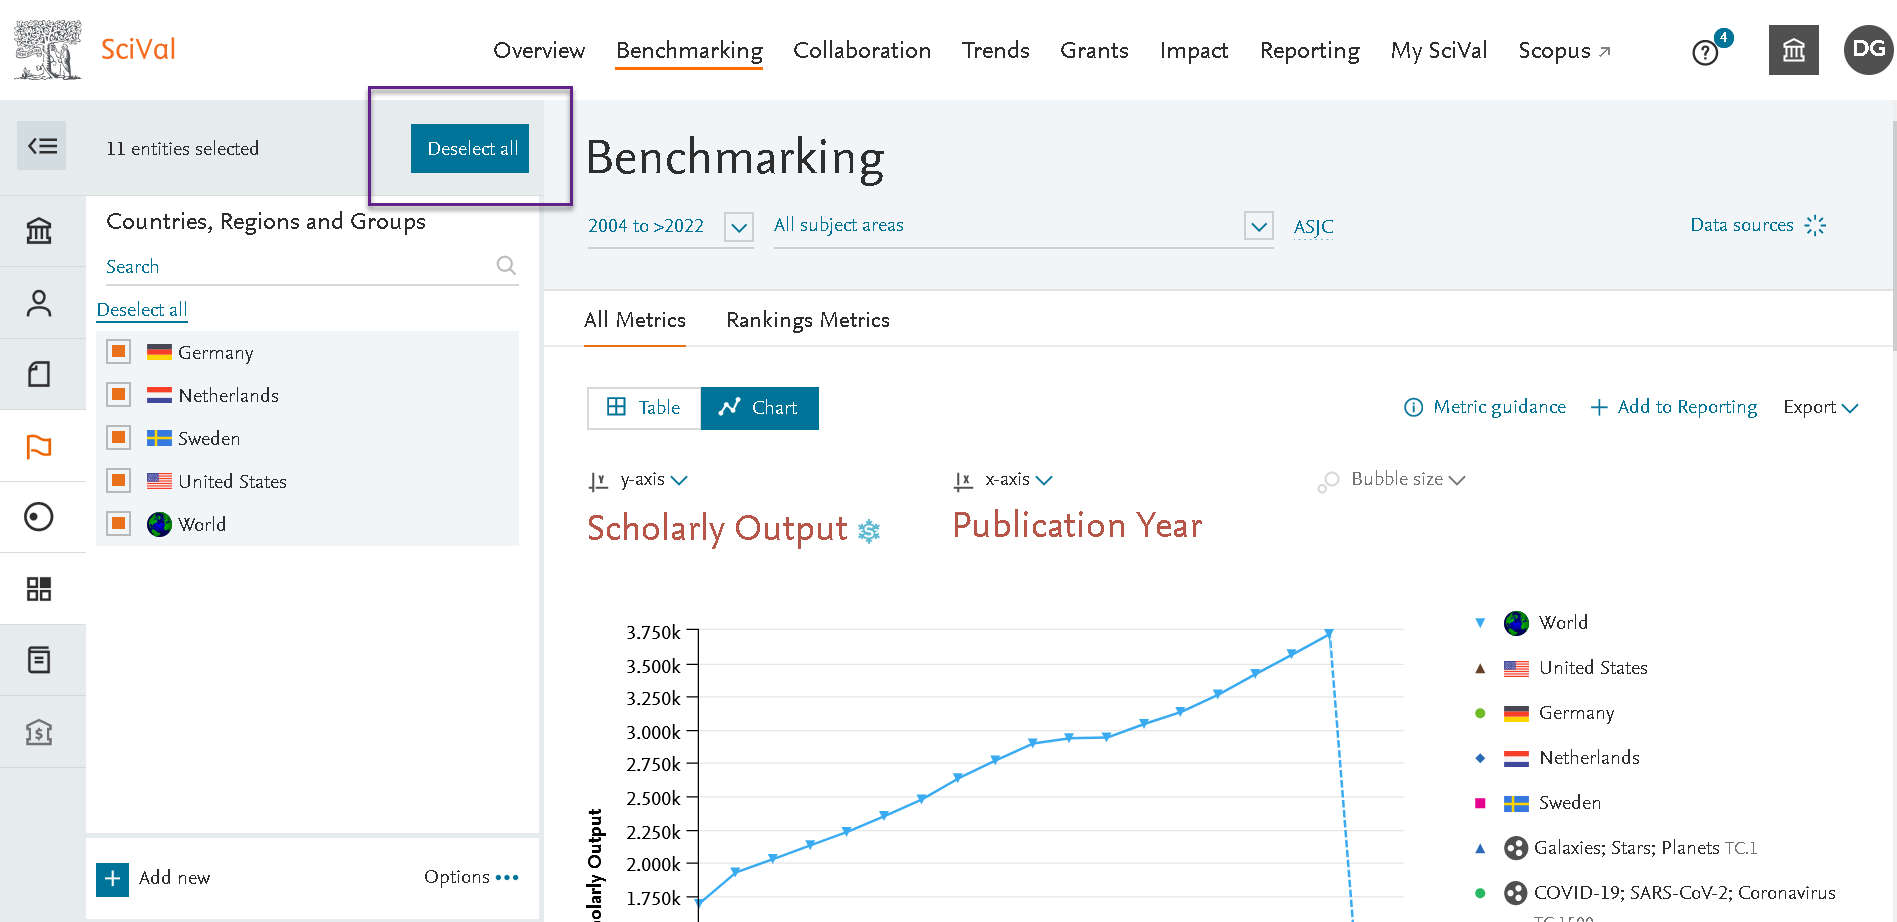
If you have multiple items selected in the Benchmarking or Grants module, you will now see the “Deselect All” option at the top of panel to quickly clear you selection.
- Enhancements to the Institution hierarchy view
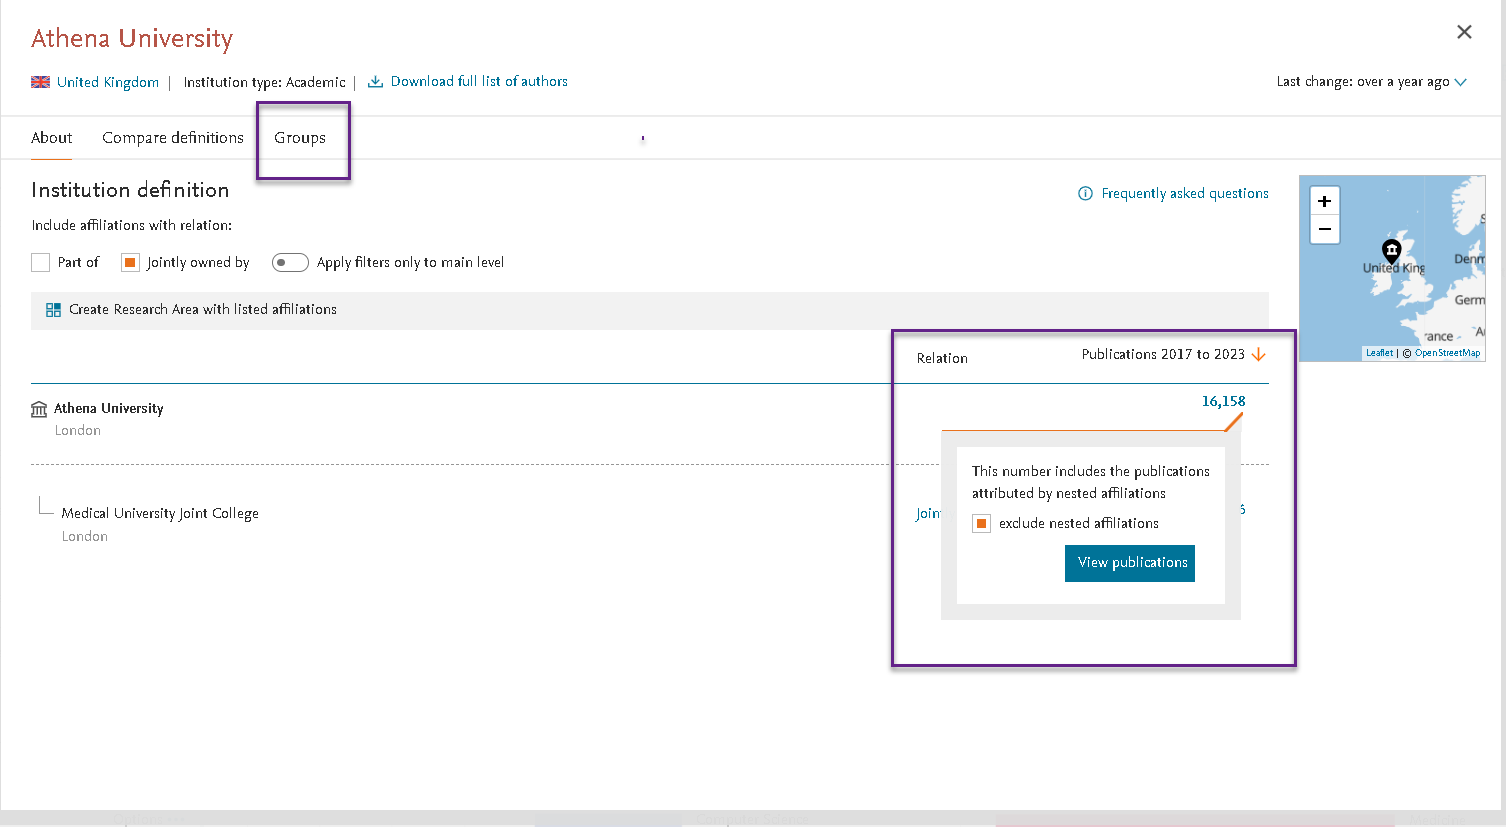
The total Scholarly Output now responds to the applied relation filters, allowing you to view the specific set of documents in the pub links modal, filter down further and create a Publication Set. You also have the option to filter to only view the documents assigned to the parent level.
For Institutions which are part of Groups, such as University alliances or territorial subdivisions covered in SciVal, these groupings can now be found in the “Groups” tab.
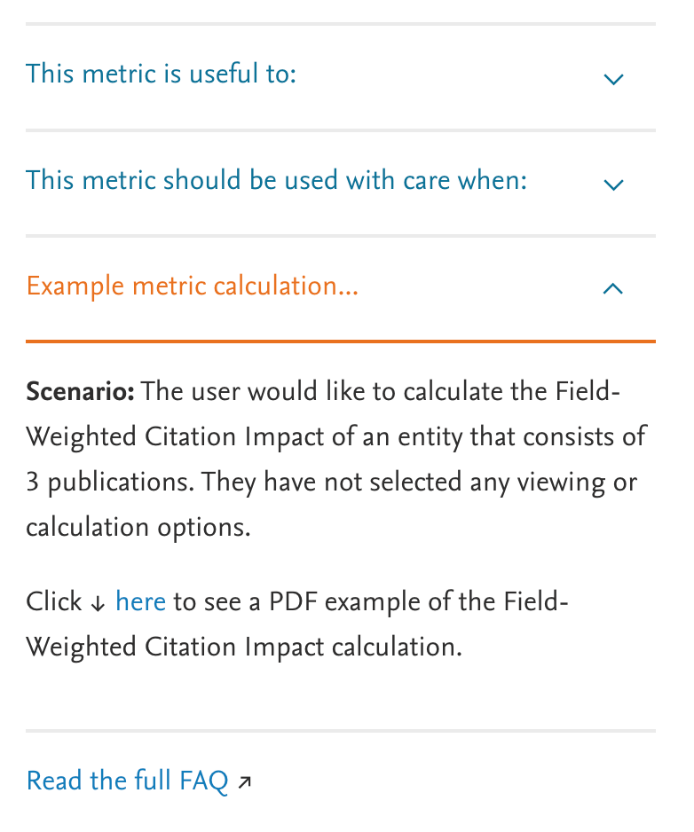
- Metric calculation examples for the FWCI
To further our mission on the responsible use of metrics, we are adding metric calculation examples to some of our more complex metrics. We’re starting with the FWCI and will add others in the coming release. The examples can be found in both the flyout panel and support centre.
Impact module
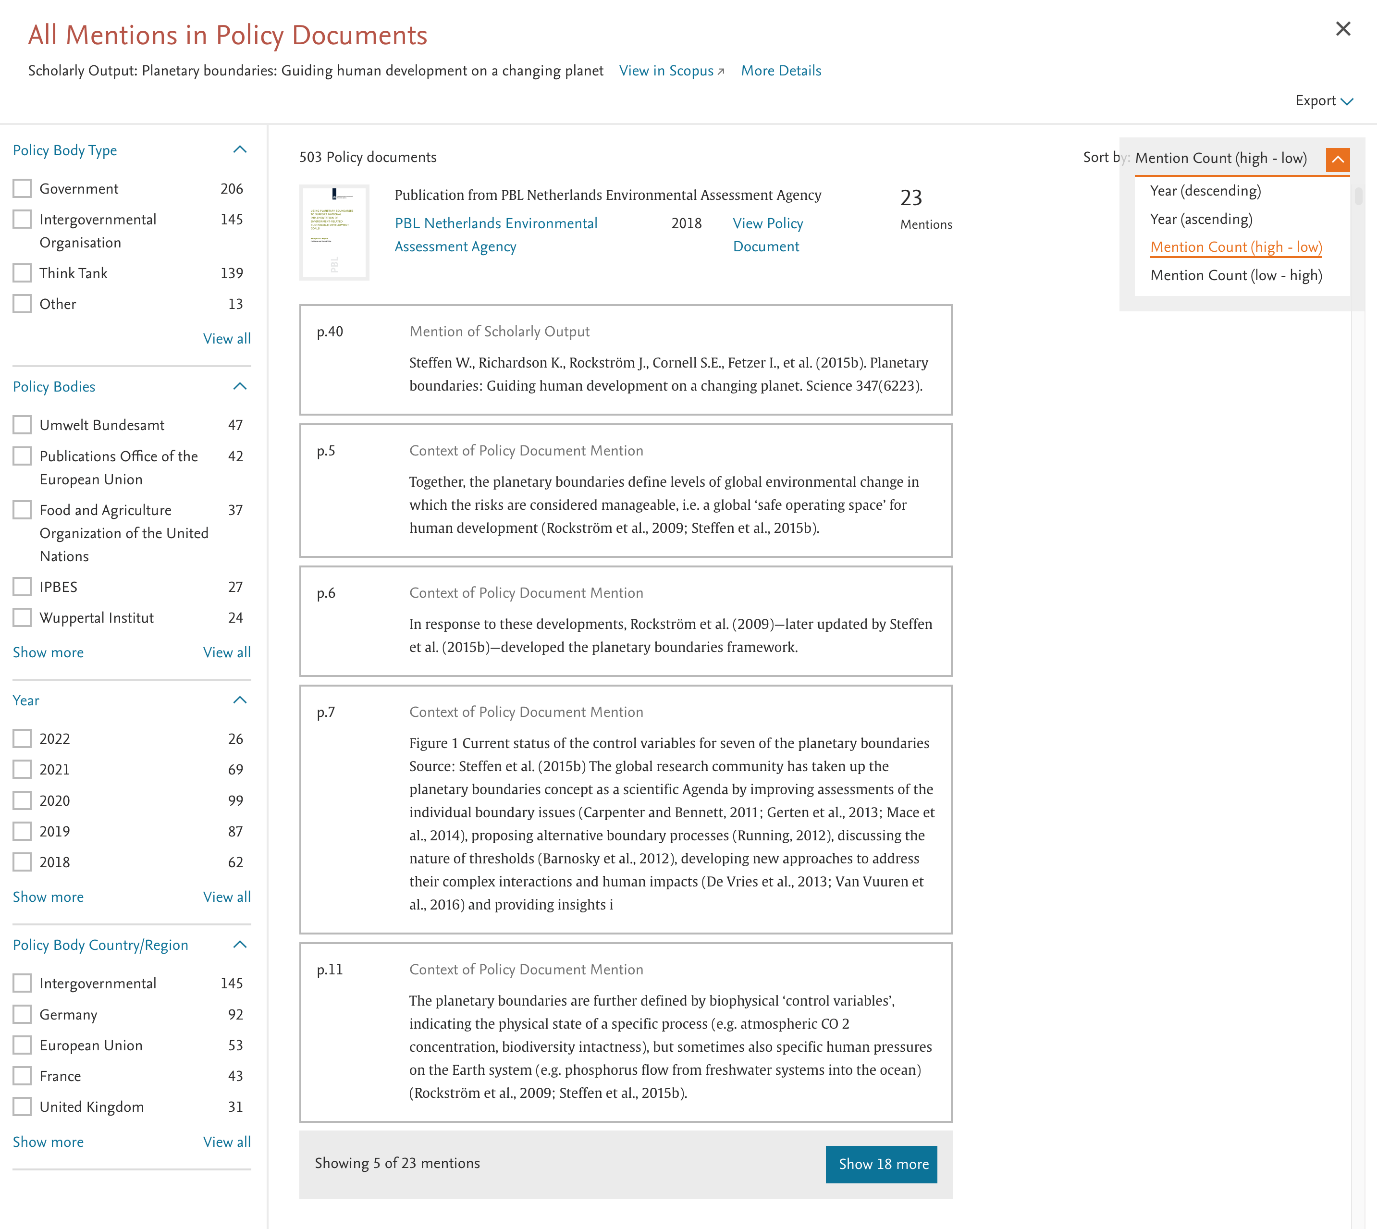
- Uncover the Policy Document mentioning your article the most
It’s now possible to sort from highest to lowest mention counts when looking at a single article. This helps you uncover the articles that are likely contributing the most to the Policy Documents.
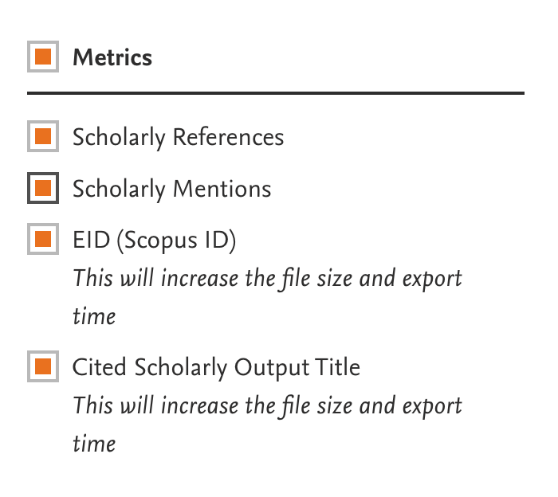
- Export the article names being cited in Policy Documents for your entity
We’ve added the Cited Scholarly Output’s title as an export option when looking at the Policy Documents. This lets you easily identify the publications that are being cited by policy, coming from your entity.
Grants module
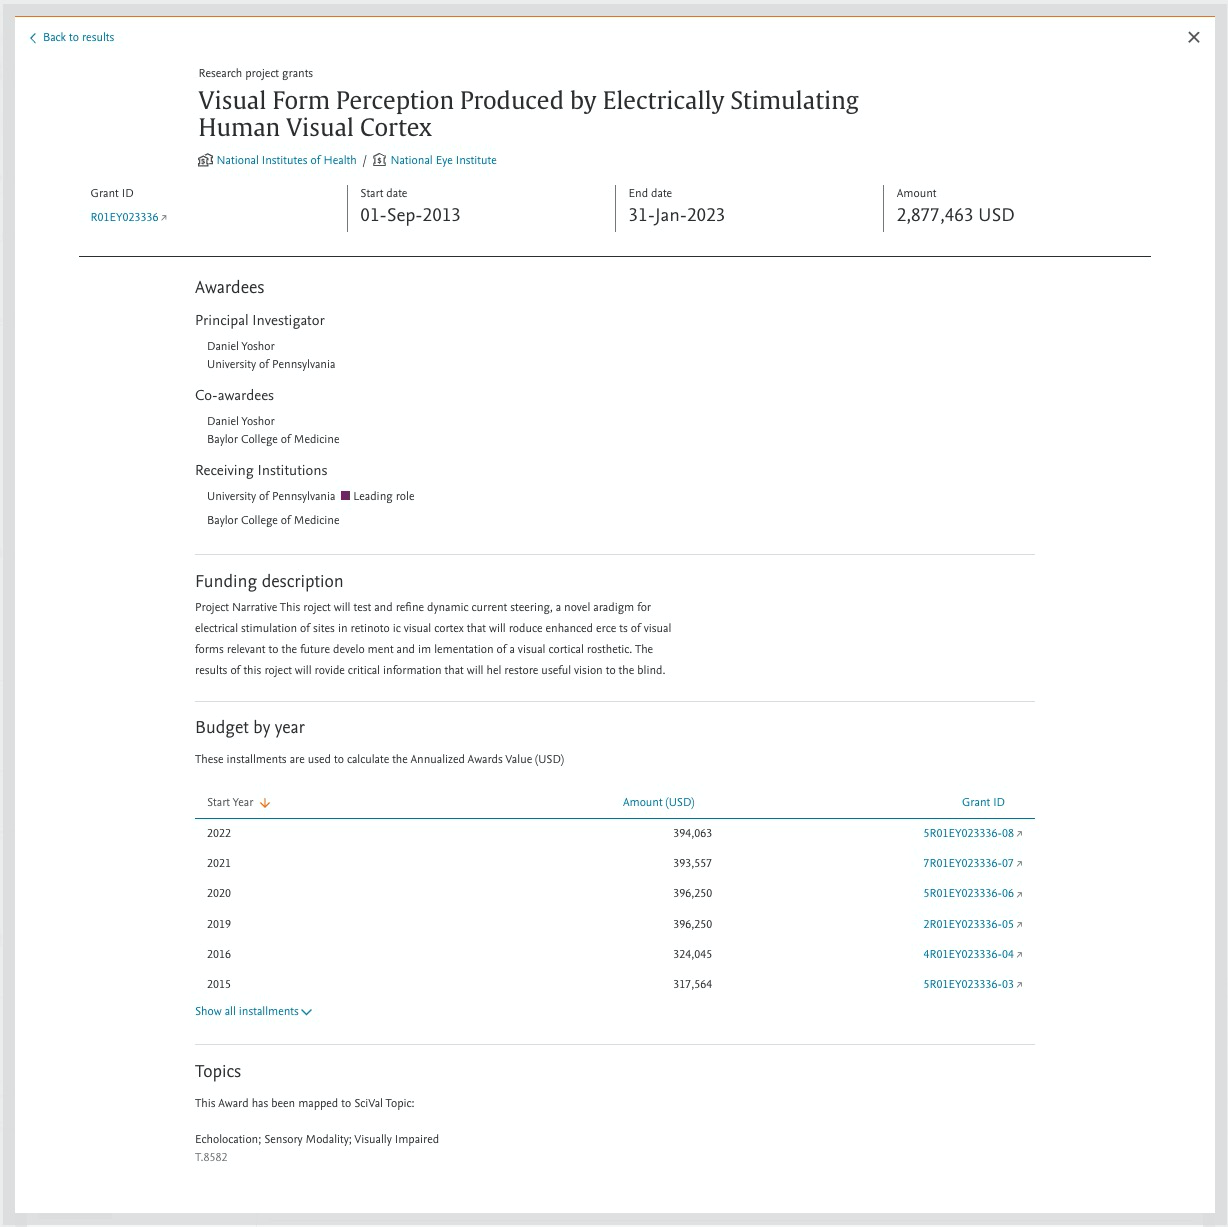
- Increased transparency on Award details with the new award preview in ScVal Grants
Clicking on an award title in the awards list launches an award preview screen which covers all relevant award details, including the funding body information and award link, amount, duration, awardees information, description, SciVal topic and budget by year when available.
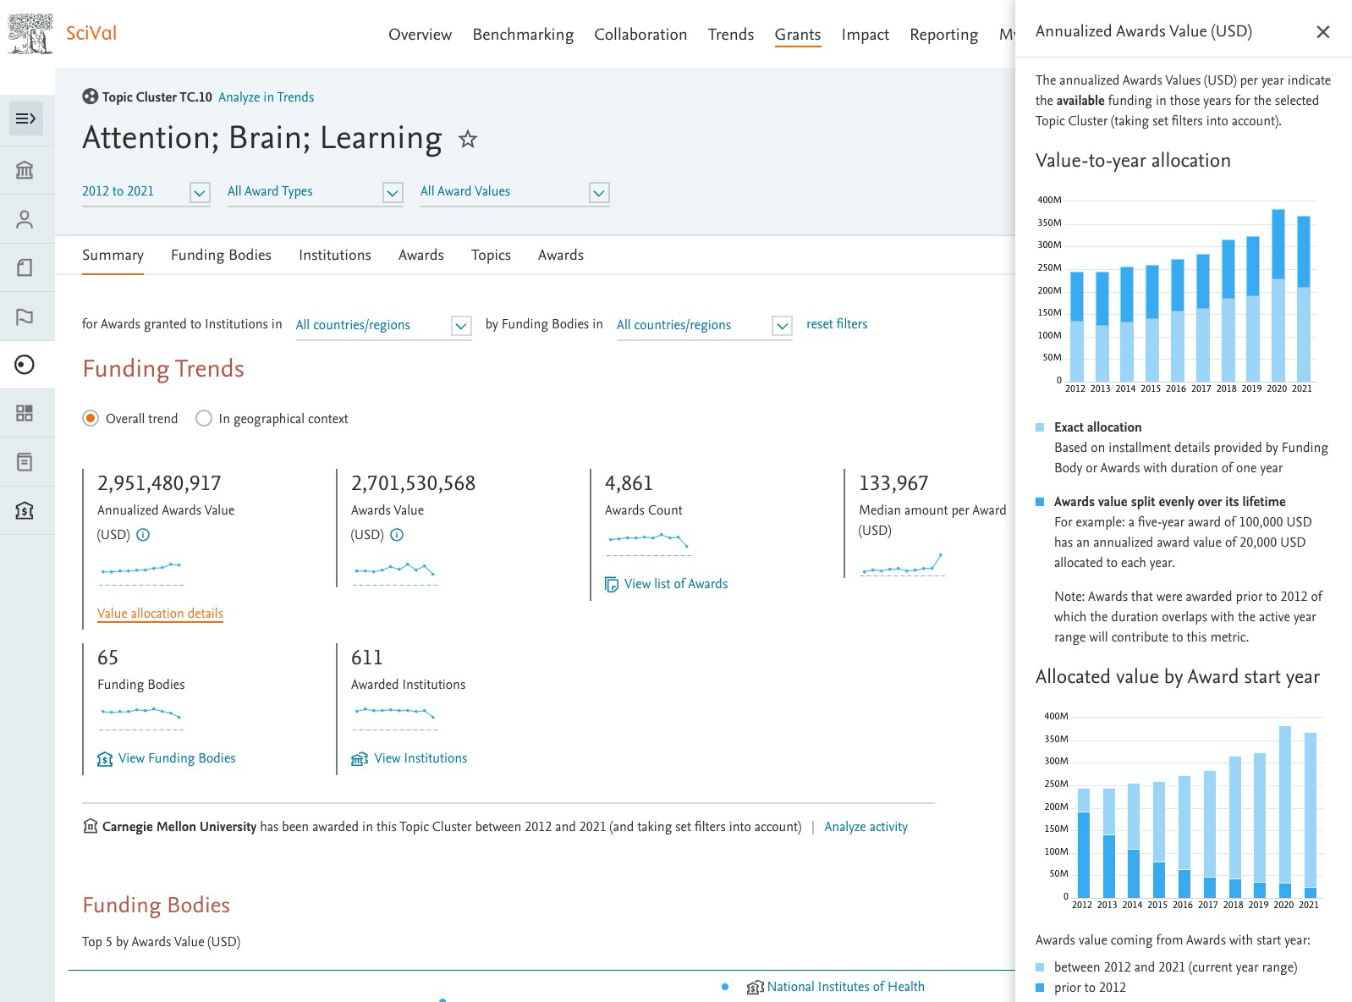
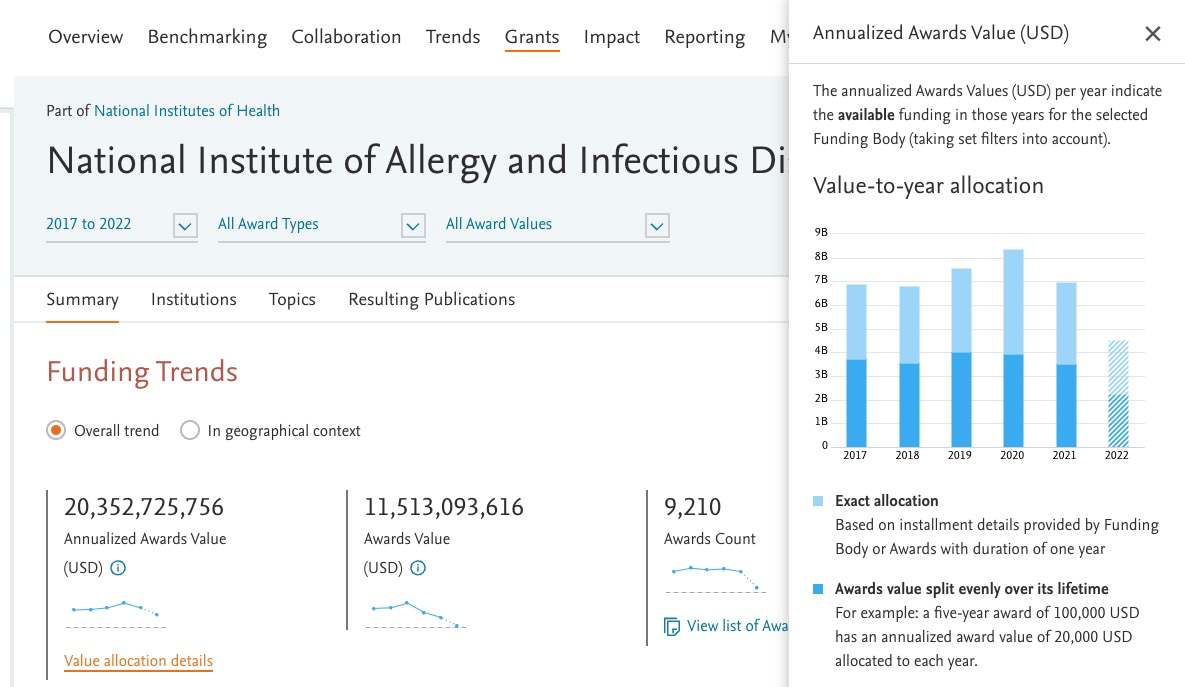
- More insights into Annualized Awards Value (USD) allocation in SciVal Grants
The new Annualized Awards Value (USD) fly-in panel now includes ‘Allocated value by Award start year’ graph. It indicates whether the available per year funding is coming from awards received during vs prior to the selected year range.
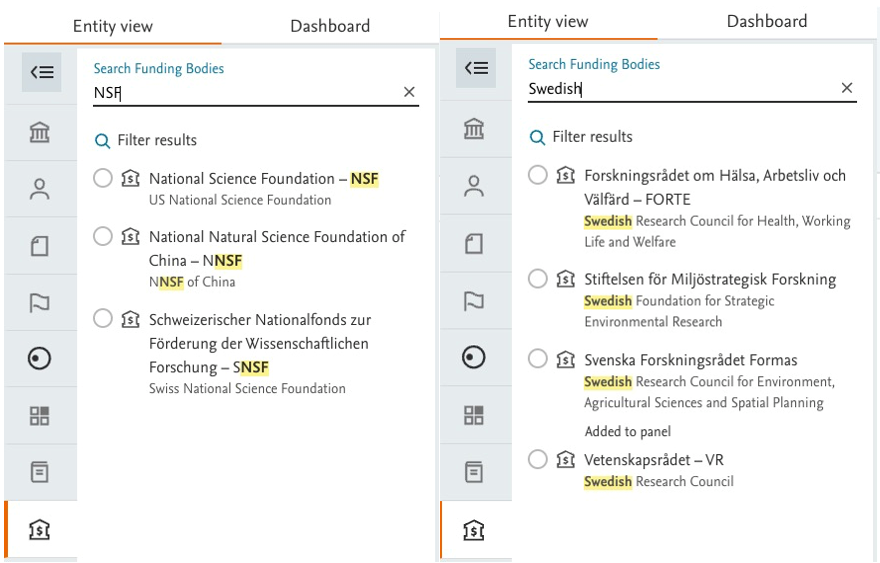
- Search funding body by abbreviation or alternative name in SciVal Grants
Finding your funding body of interest is now easier in SciVal Grants as searching can be done using:- Common abbreviations: for example, ‘NSF’ for ‘National Science Foundation’.
- Alternative names: for example, ‘Swedish Research Council’ for ‘Vetenskapsrådet’.
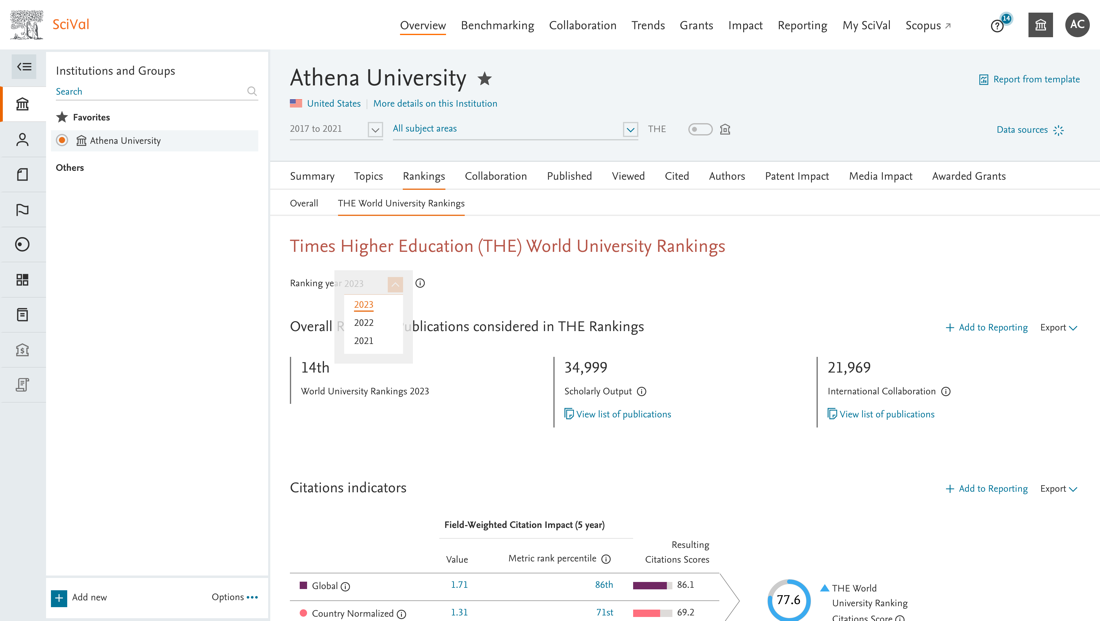
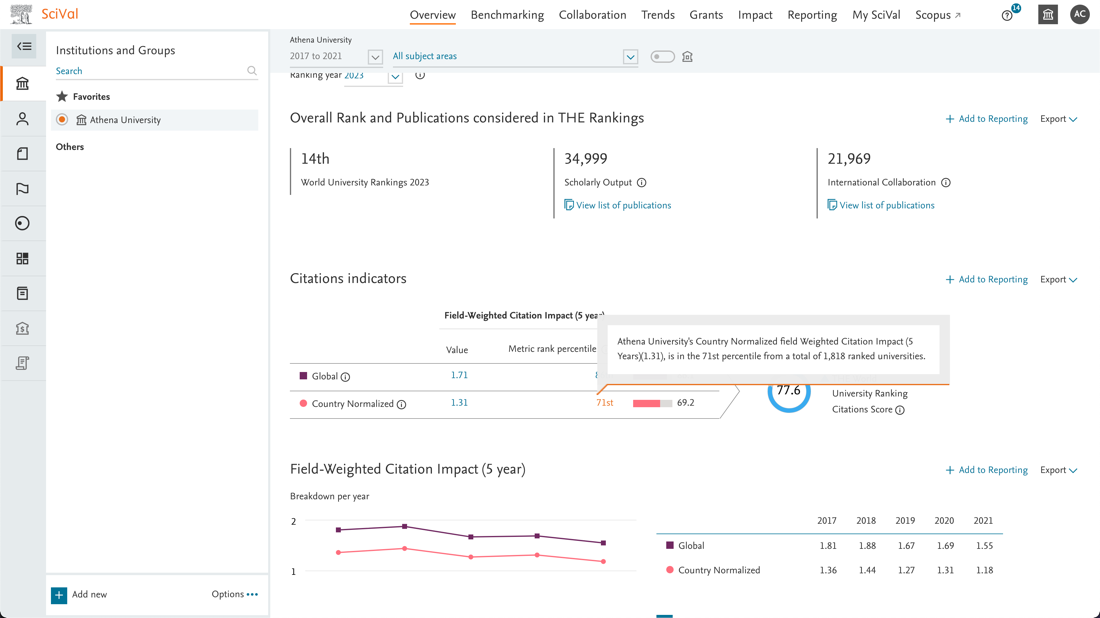
The second phase of the Farm release adds the bibliometric dataset underlying THE World University Rankings 2023, along with the ability to analyze the change in yearly FWCI (5 year) across three ranking years, 2021, 2022, and 2023. It also makes it easier to understand the performance of a university in terms of FWCI (5 year) by showing the rank percentile of the metric in comparison with the other universities participating in the rankings.
- Analyze the bibliometric dataset underlying the THE World University Rankings 2023
Gain a deeper understanding of the bibliometric dataset underlying your institution’s ranking scores in the THE World University Rankings 2023 (announced on October 11, 2022). Analyze the drivers behind the Citations Score (30% of the overall ranking score), and benchmark with peers across all bibliometric drivers to understand your institution’s position.
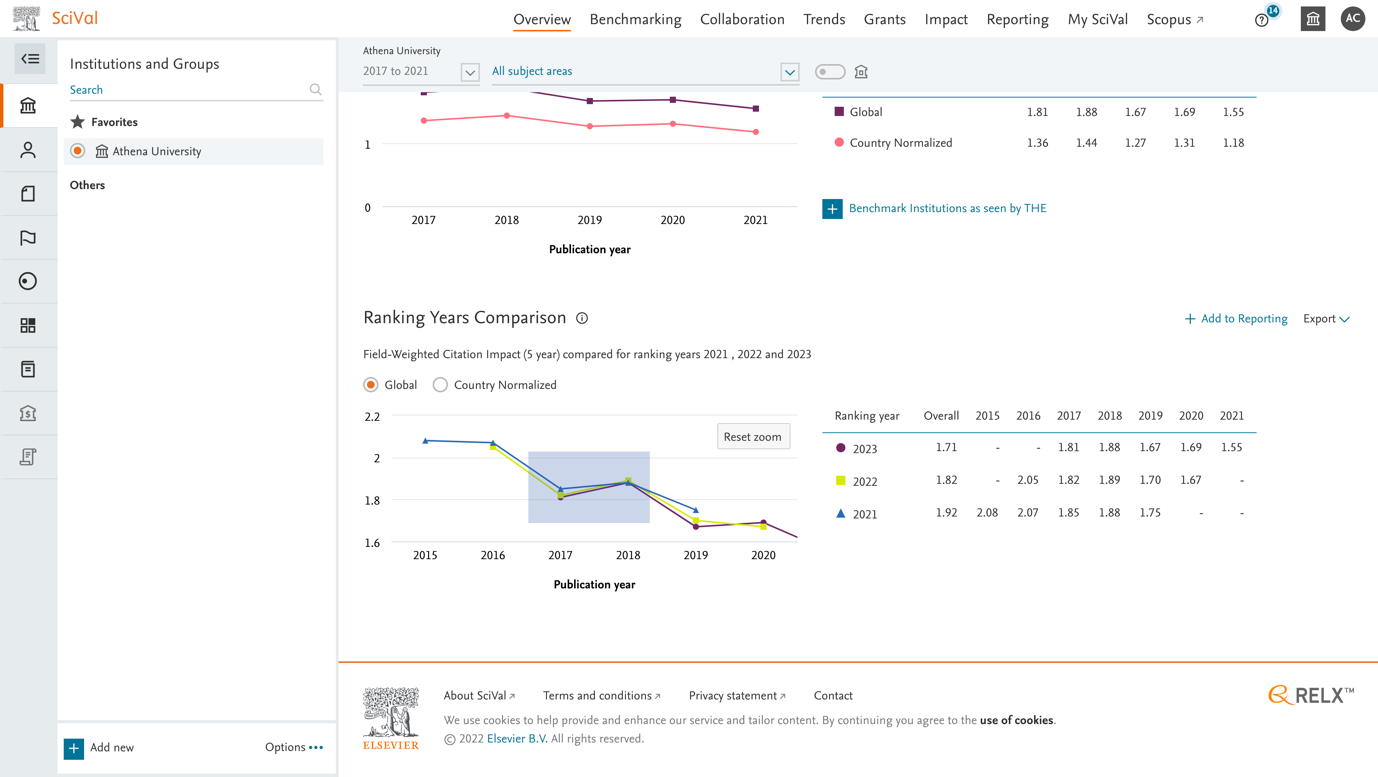
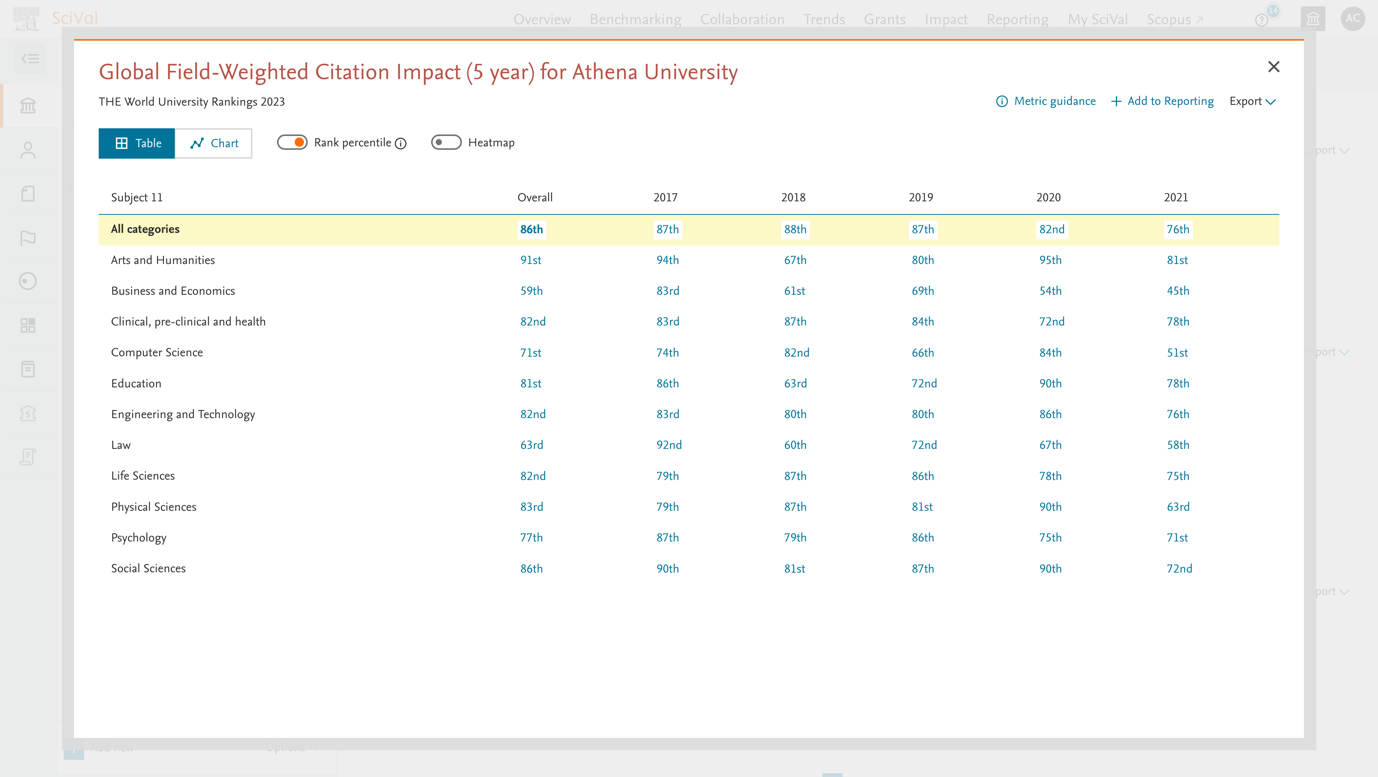
- Analyze FWCI (5yr) values in detail to get insights into changes in ranking scores
Gain insight into the underlying drivers of changes in ranking scores through access to the global and country-normalized FWCI (5 year) values for each publication year considered in three ranking years (2021, 2022, and 2023).
- Understand the relative performance of a university in FWCI (5 year) through the metric rank percentile
The metric rank percentile of the FWCI (5 year) for a university is intended to show where it stands in comparison to other participating universities. For example, the 99th percentile is equivalent to the top 1%.
The theme of the September release is “from farm to table”. Buying local food, directly from Farmers or Farmers markets, or choosing local ingredients in the supermarket, contributes to tackling climate change by reducing emissions from transportation. And it probably tastes better as well!
The Farm release brings you a new Institution hierarchy view, the ability to tag items directly from tables across SciVal, and new metrics in the Impact module.
- Increased transparency on Institution definitions with the new hierarchy view
The Institution hierarchy view indicates how the Scopus affiliations that make up the Institution are related to the Institution. The filter options at the top of the page further allow you to filter out certain relationship types, such as jointly owned centres, and create a Research Area based on the exact definition of the Institution you would like to use for your analyses.< br/> The hierarchy view can be found in the “About” tab in the Institution details modal and will be updated weekly, based on the data in Scopus.
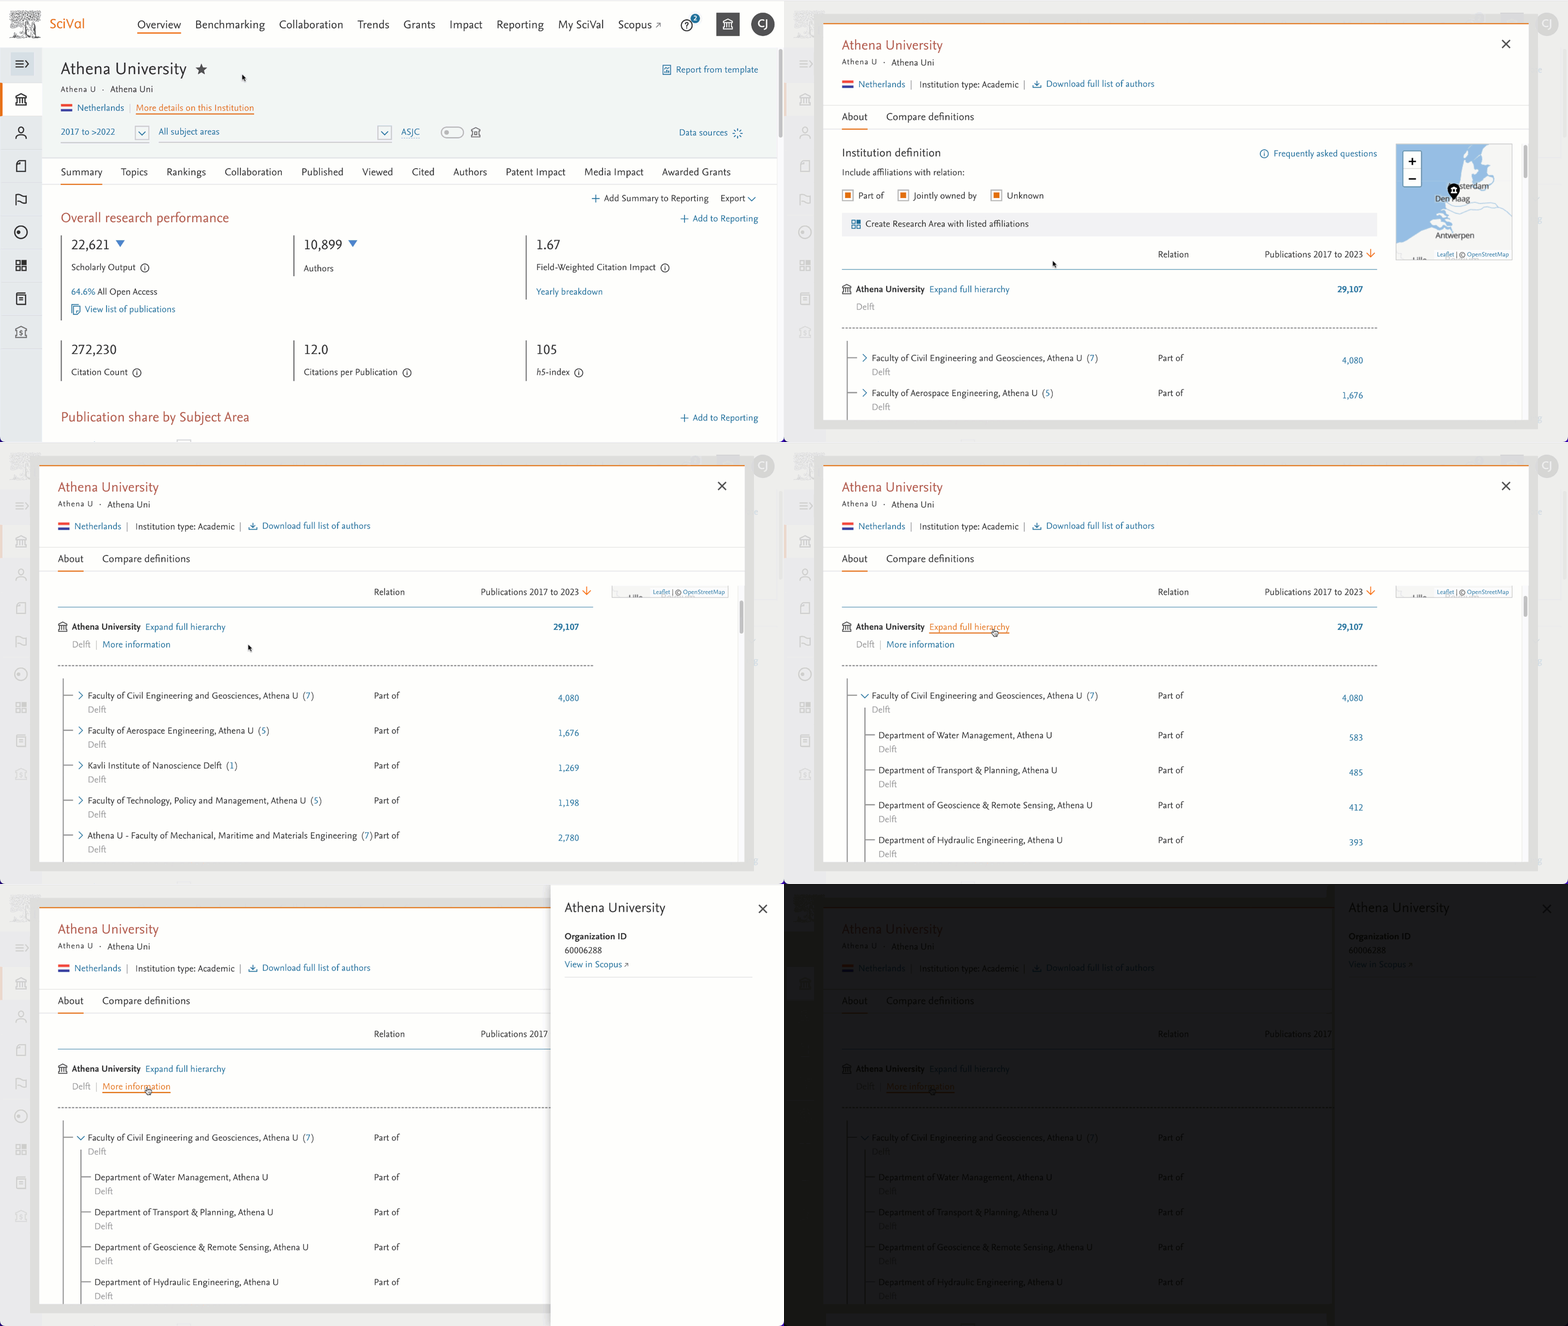
The hierarchy view is currently available for a subset of Institutions on SciVal, including the majority of THE-ranked Institutions. We are working to continuously expand the Institutions showing this view. - Tag entities directly from table listings
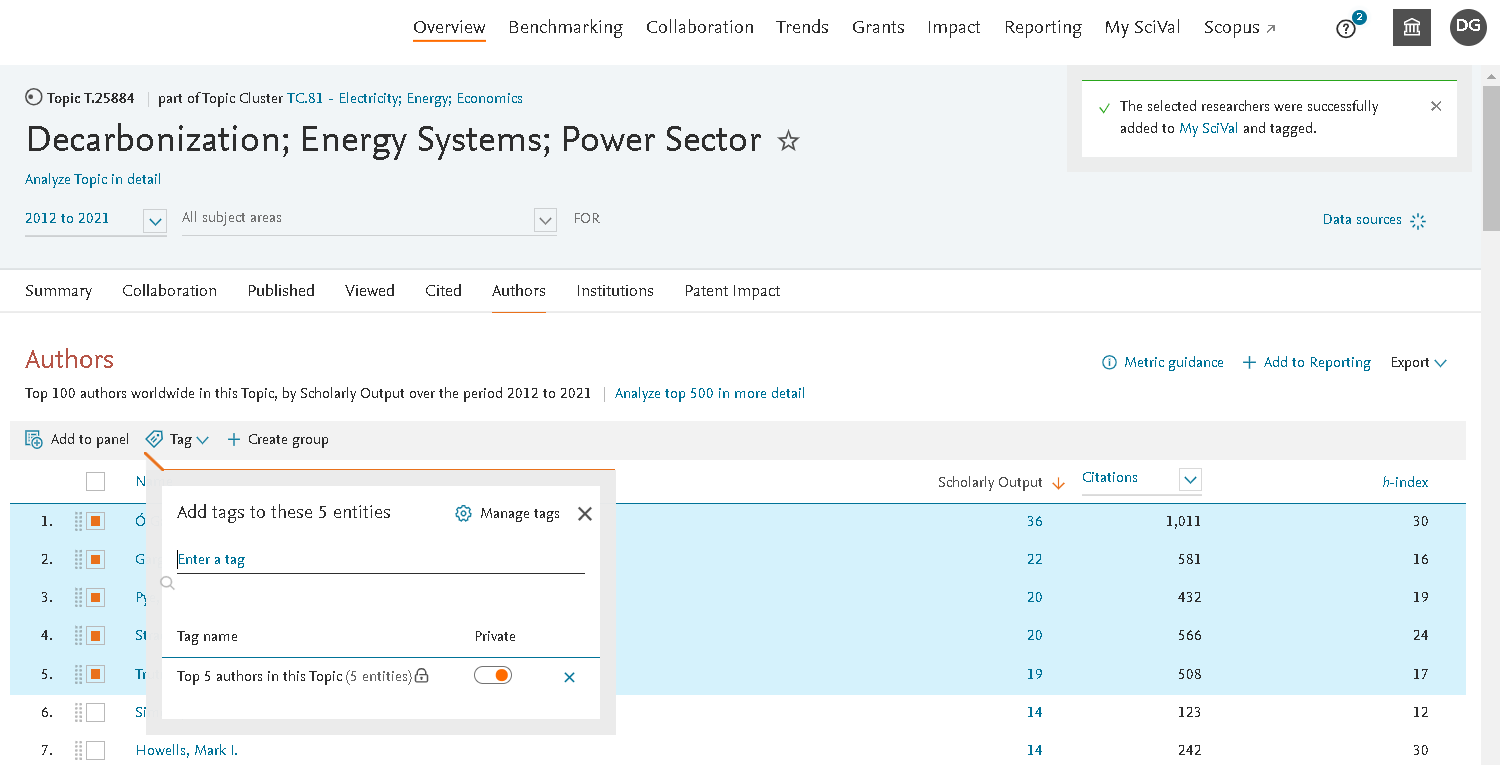
Selecting entities from the table and tagging directly, allows you to organize and more easily identify the entities in the left panel that you would like to analyze further.
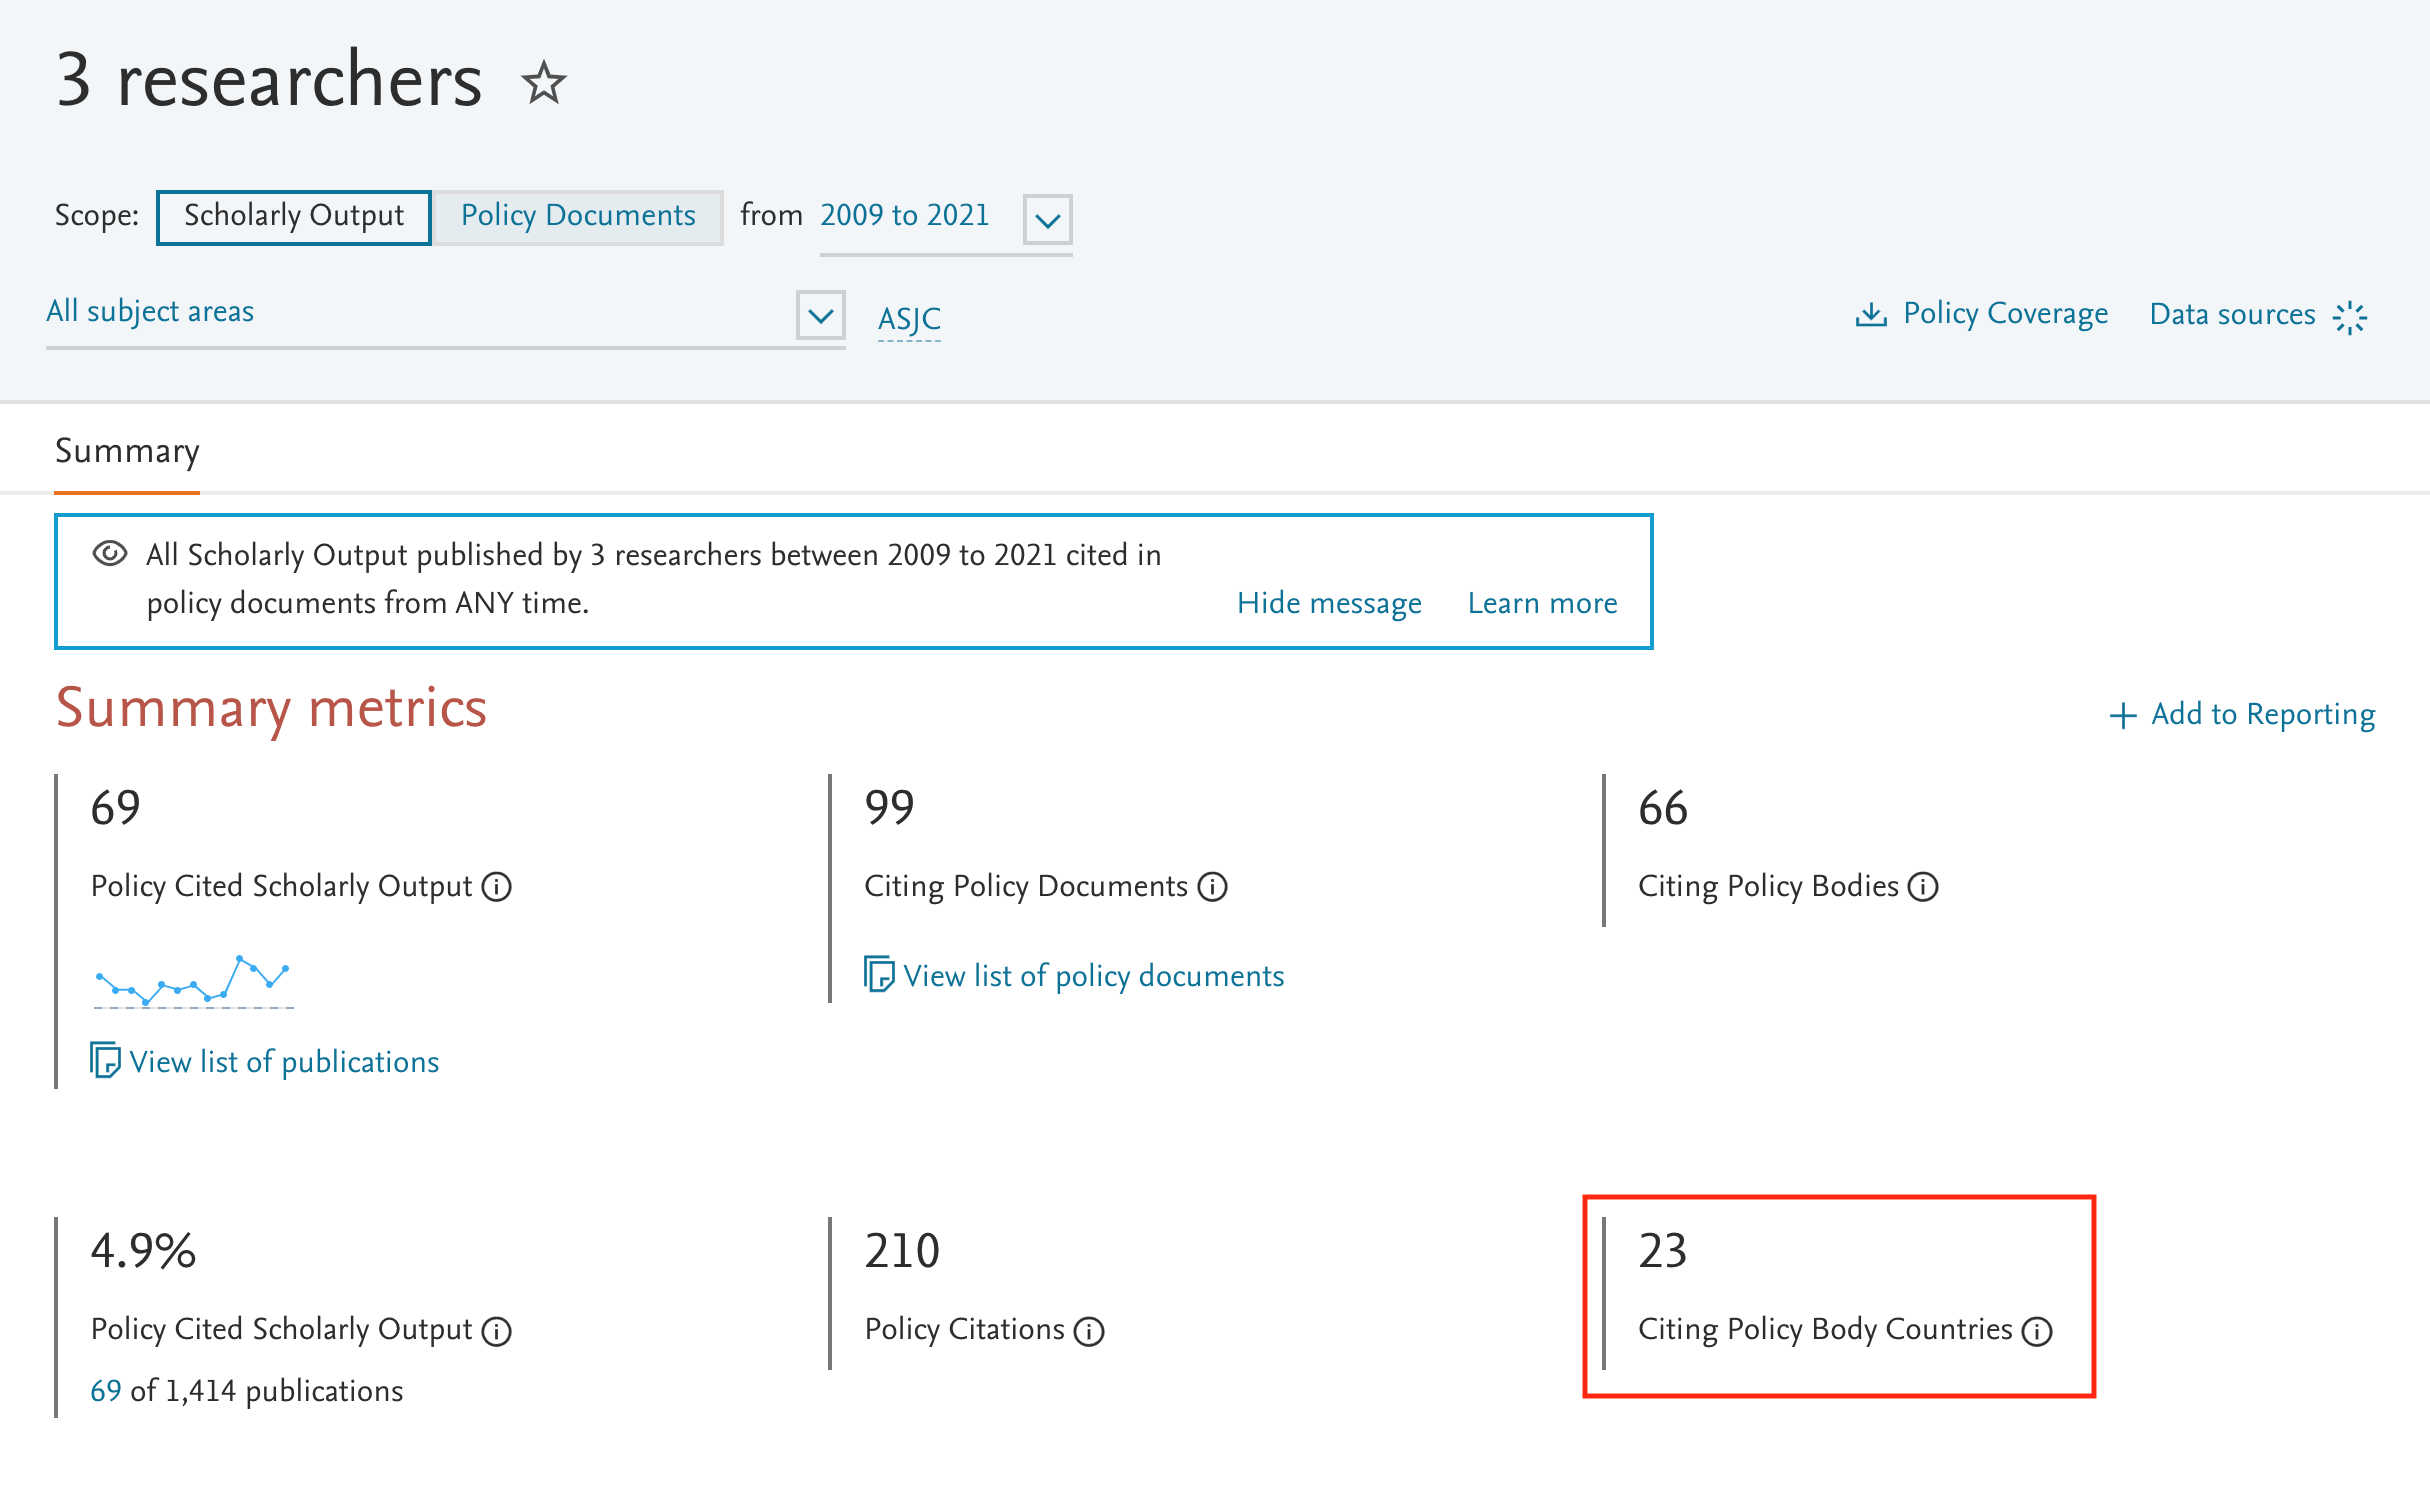
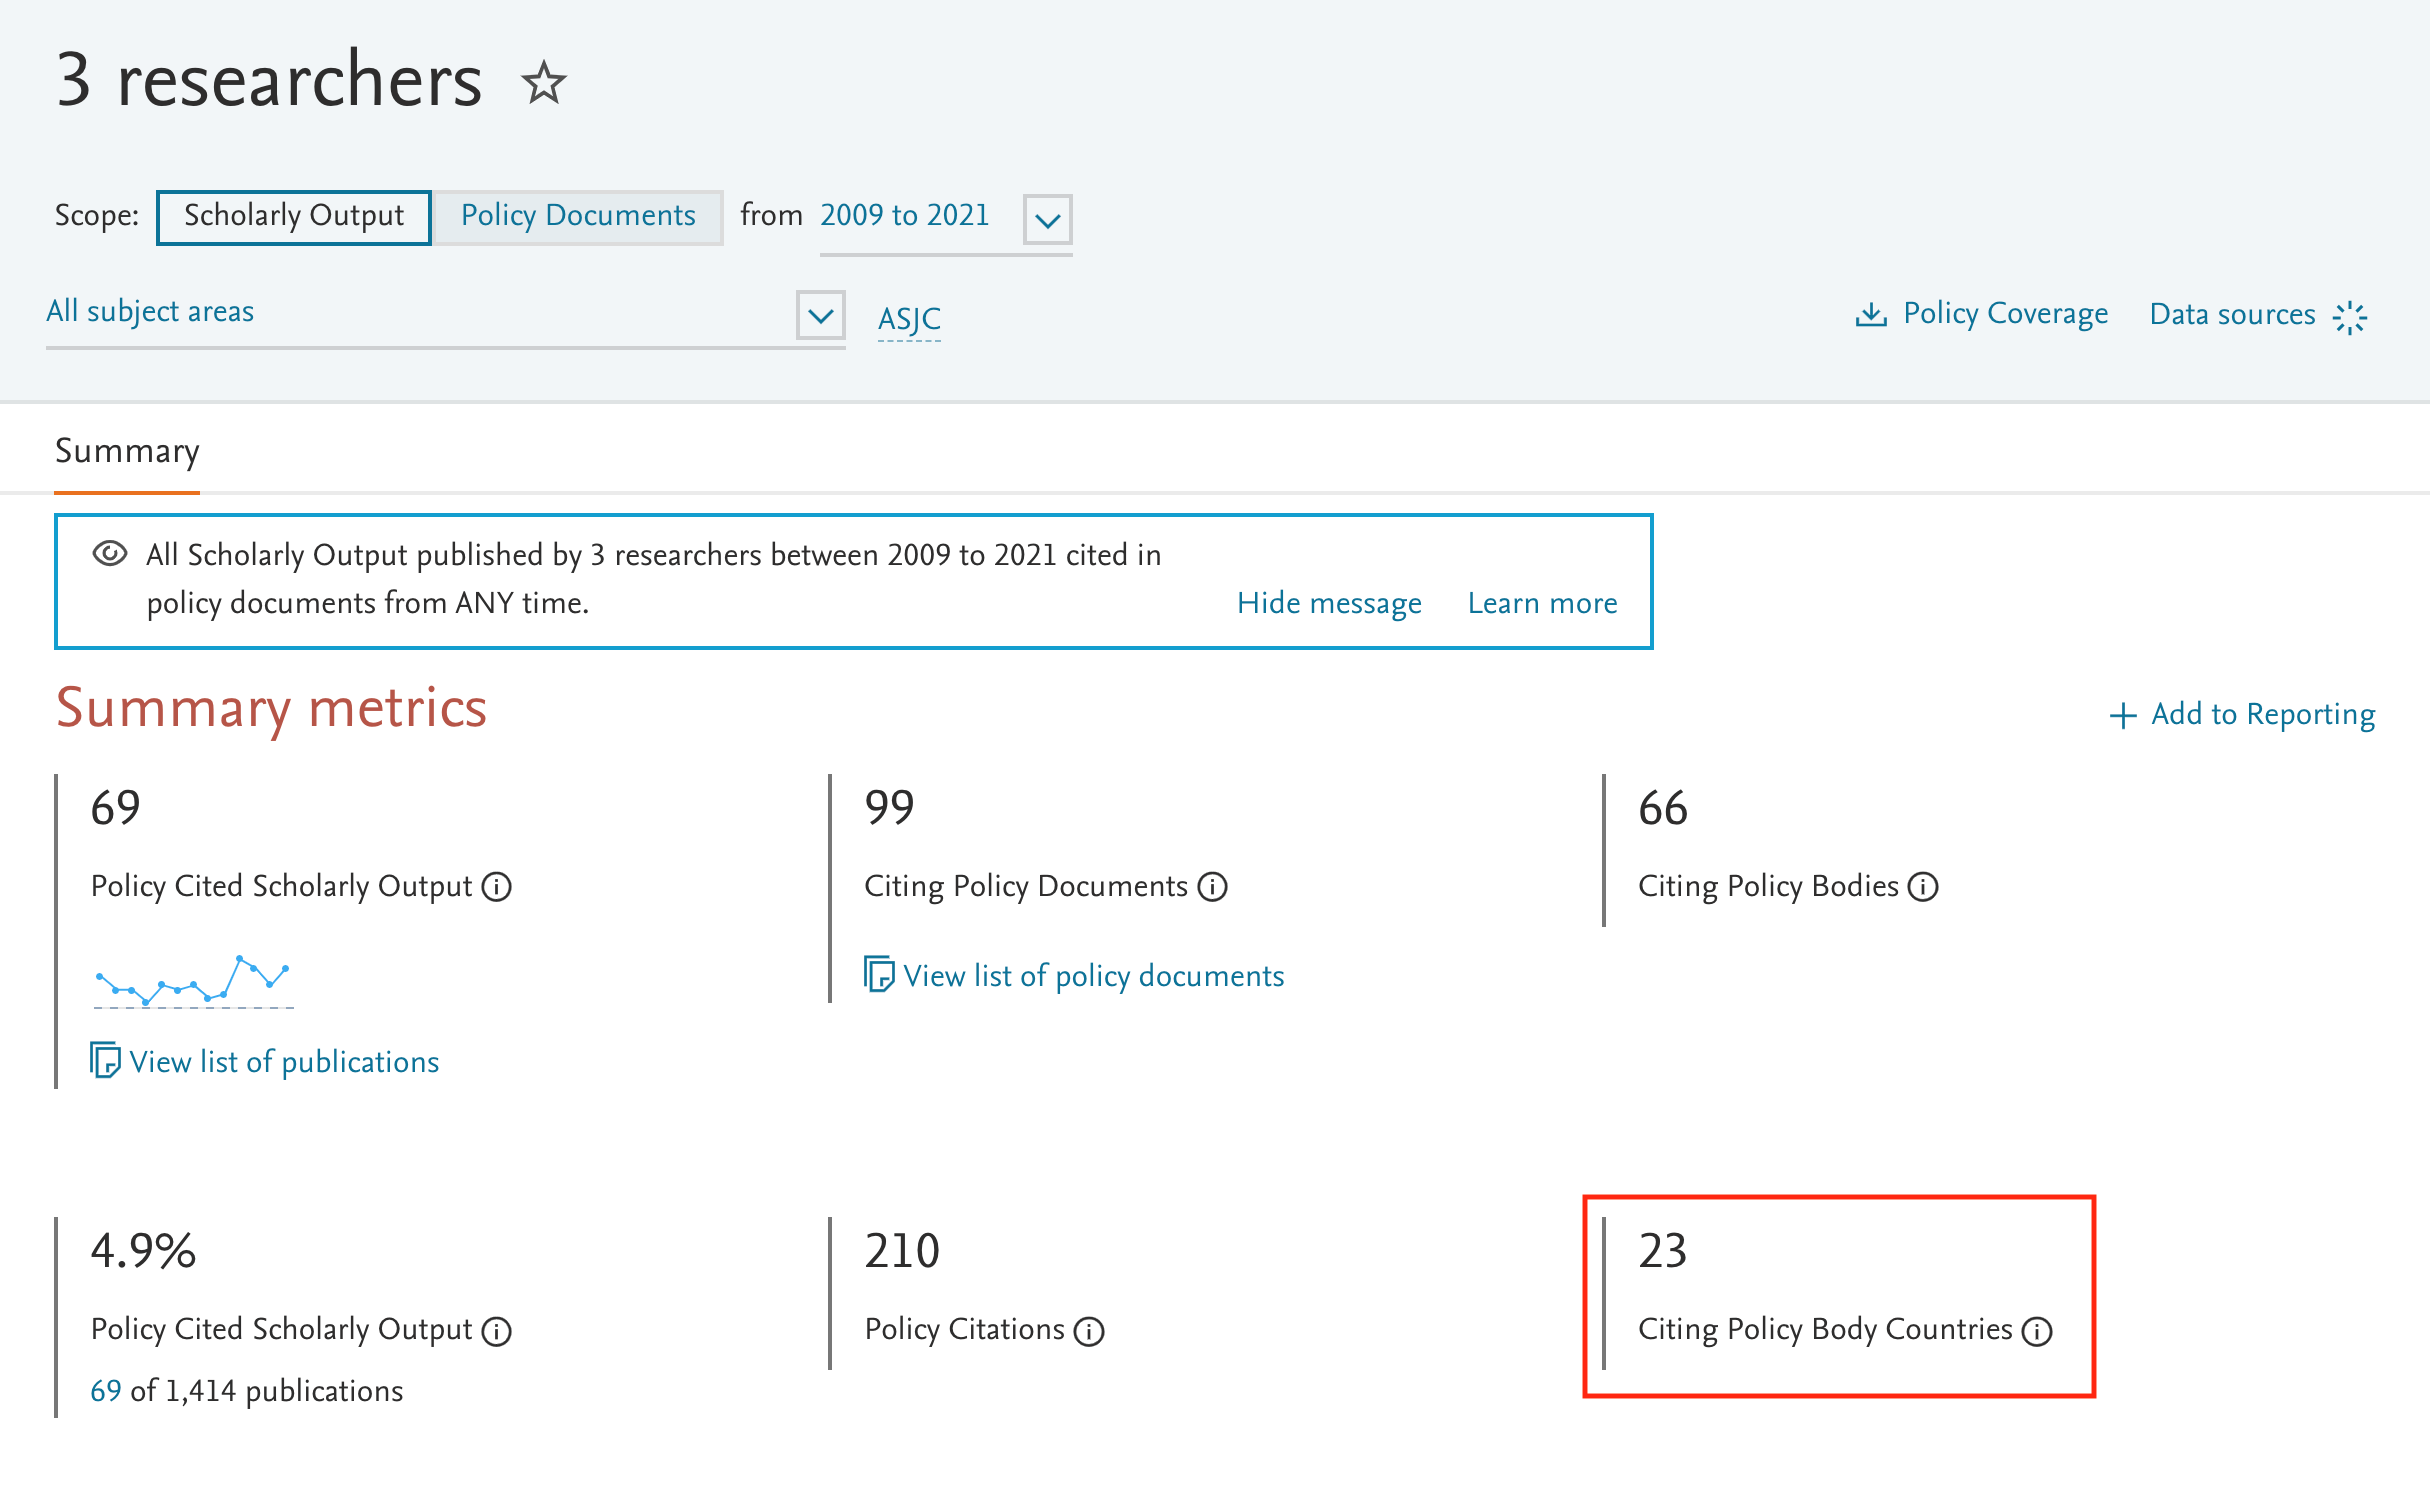
- Citing Policy Body Countries metric available for Researchers, Researcher Groups and Publication Sets in the Impact module
The metric lets you see the location of the policy bodies citing your work and helps you understand the geographic influence your research is having on policy making globally.
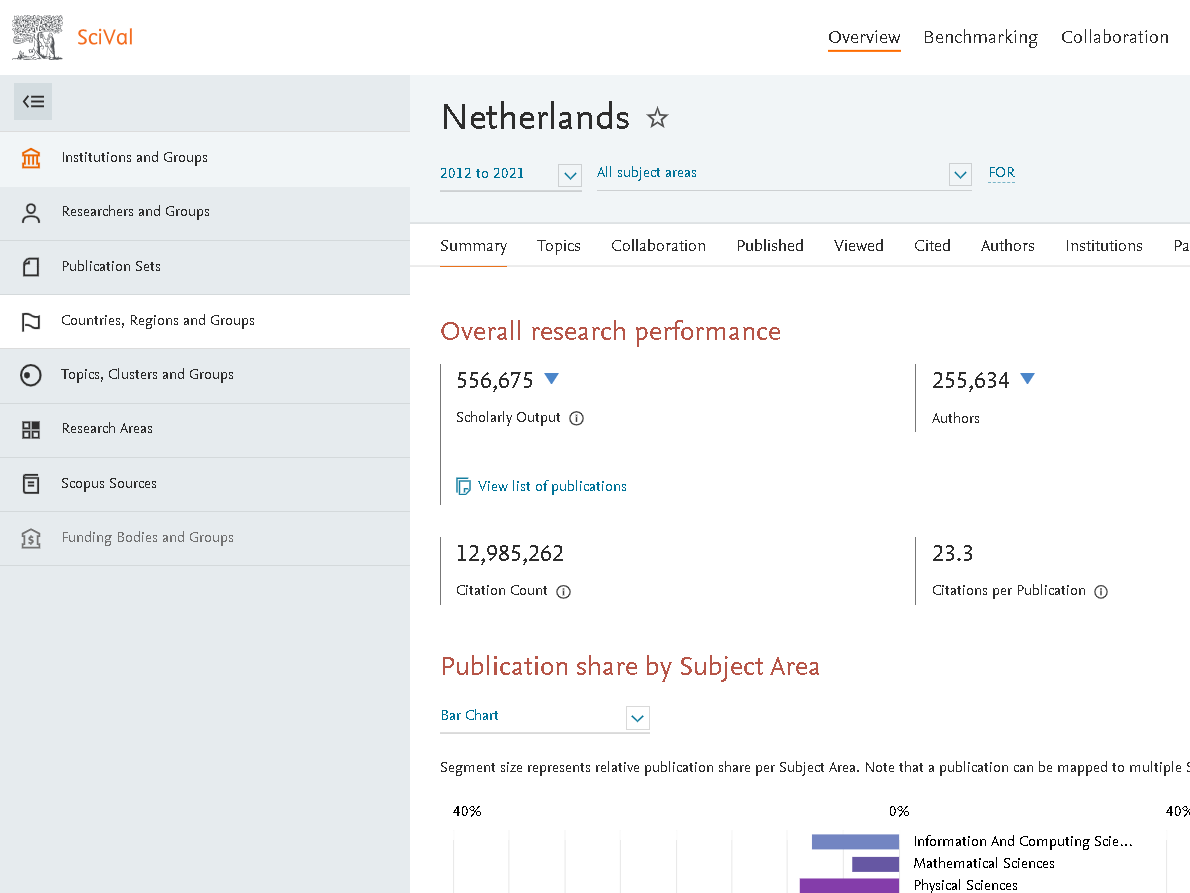
- Improved left-hand entity panel design
We have given the left-hand panel a new look and feel. The newly designed panel, which expands automatically on hover, spells out the entity found in each section in addition to the symbols, making it easier to navigate and find the entity types you are looking.
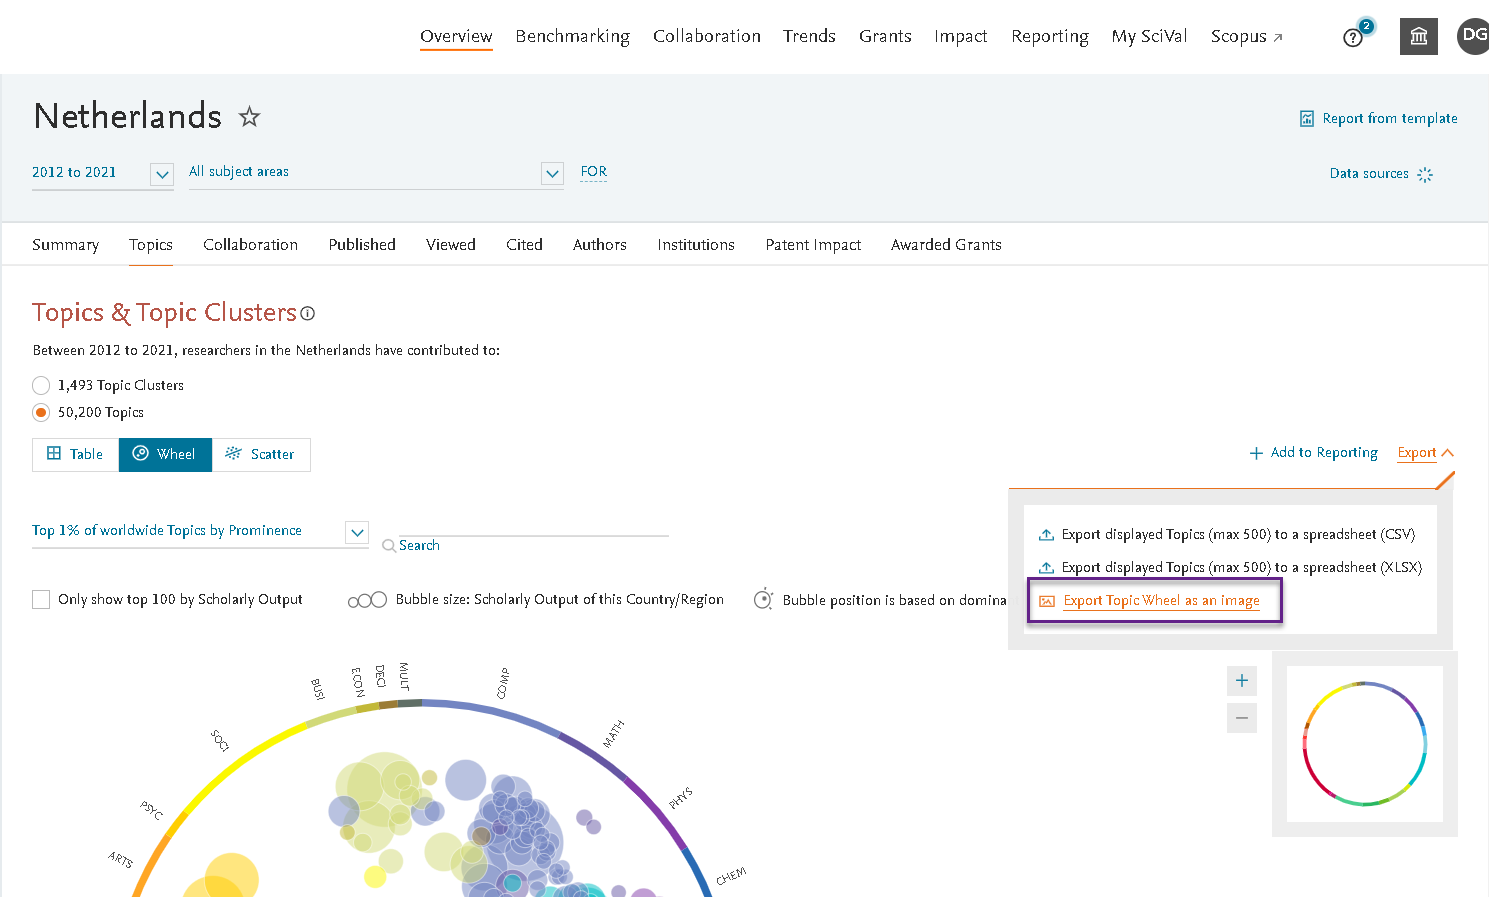
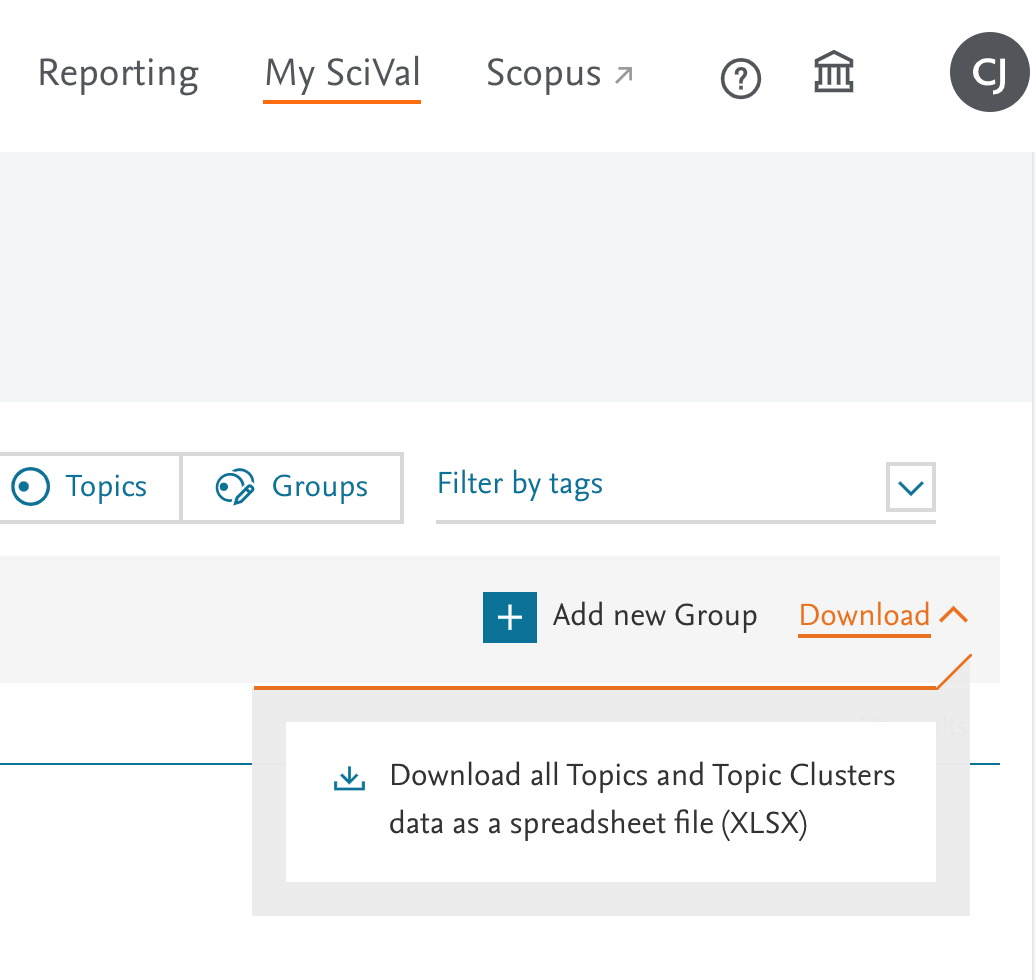
- Export a high-resolution image of the Topics wheel
Enhance your presentations and reports with a high-resolution image of the Topics wheel, with the new image export option in the Overview module.
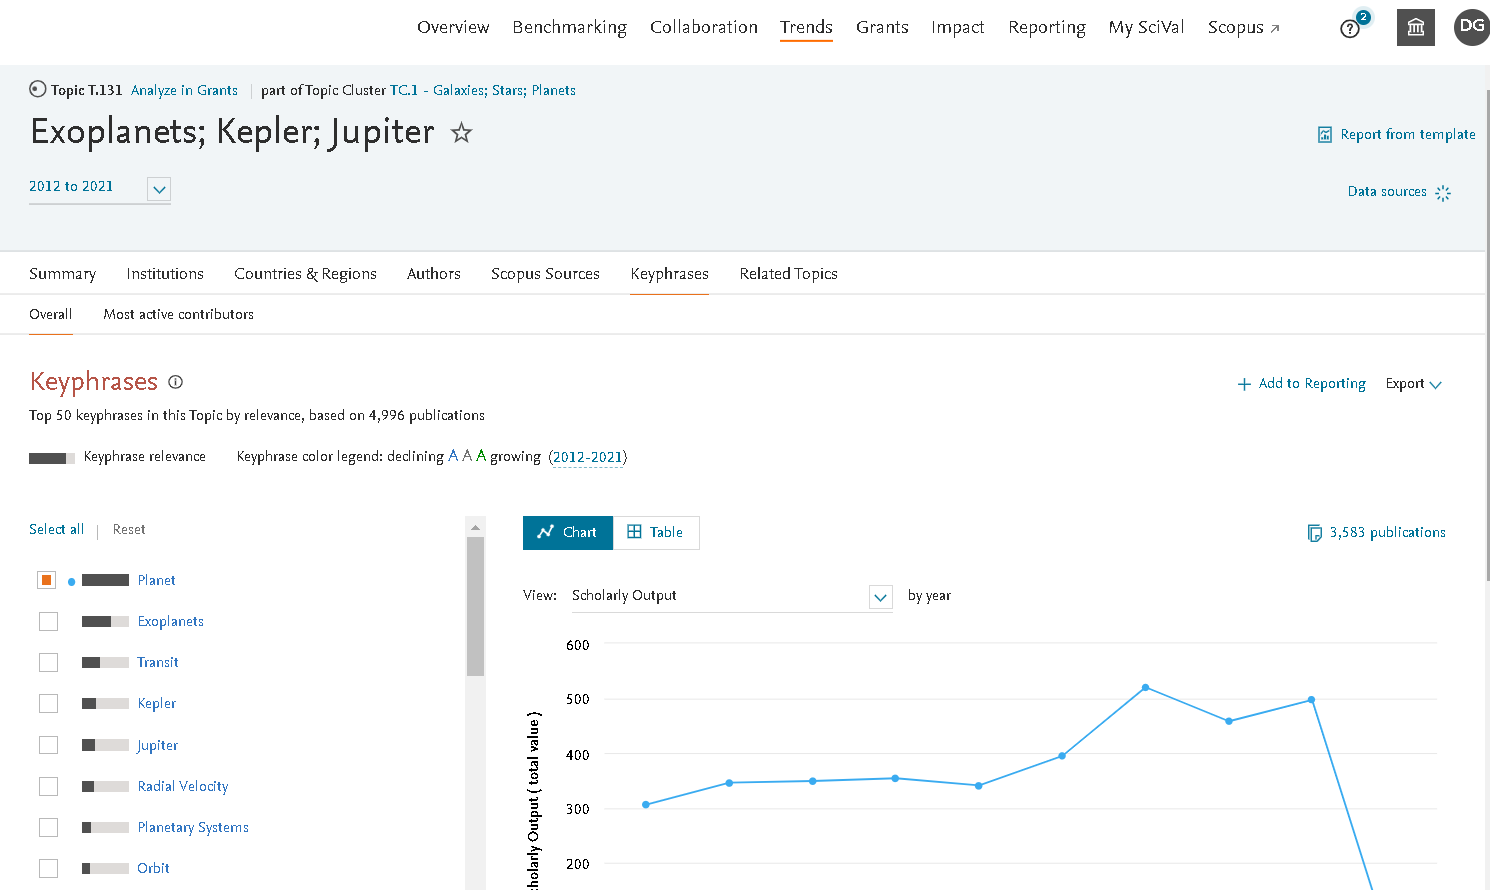
- See the relevance of top keyphrases directly in the Trends module
The new bar charts visualize the relevance of the Top keyphrases, giving you an at-a-glance indication of the relevance of each keyphrase, without the need to hover over each one individually.
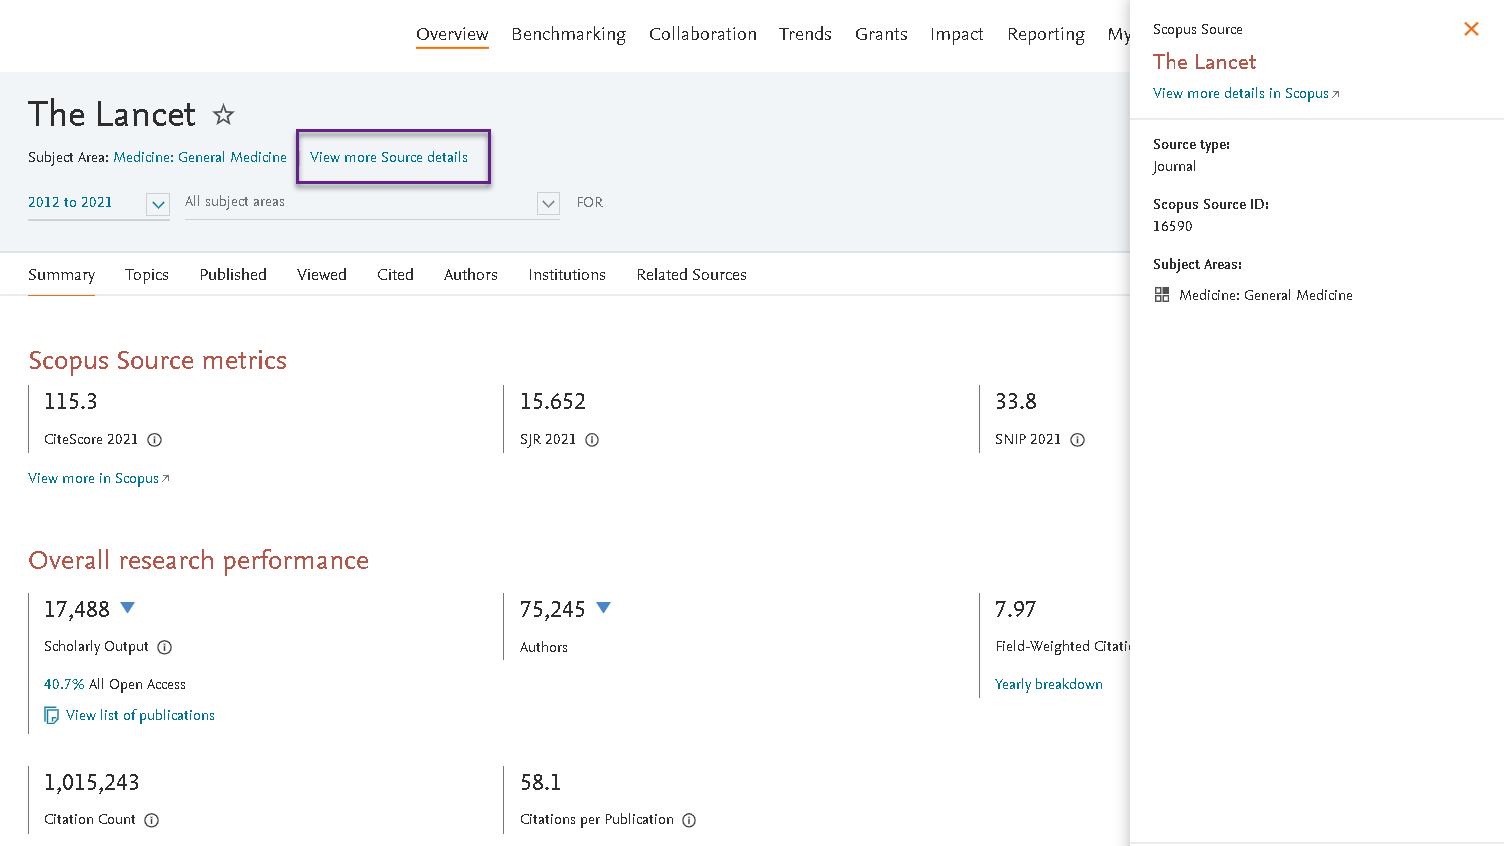
- View additional information for Scopus sources in the new fly-in panel
The fly-in panel for Scopus sources provides you with additional details about the Source you have selected: it contains the Source type, Scopus Source ID and the Subject Areas that the source is classified in. Simply click the “View more Source details” link to access the panel.
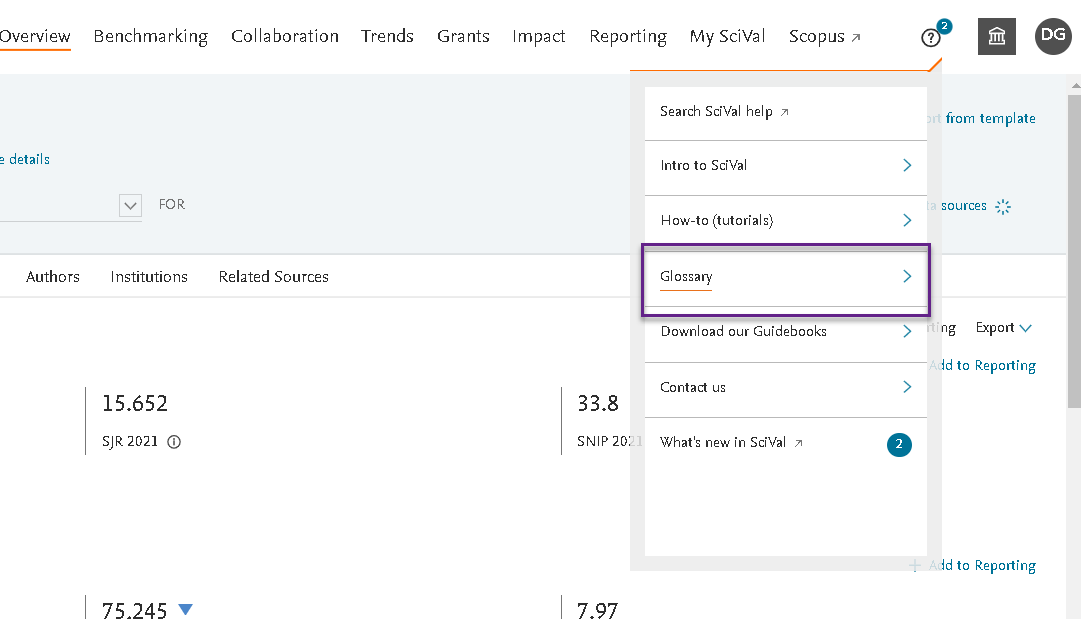
- Check the definition of terms commonly used in SciVal in the new Glossary
The Glossary, which can be found in the Help menu, provides explanations of the terminology used across SciVal.
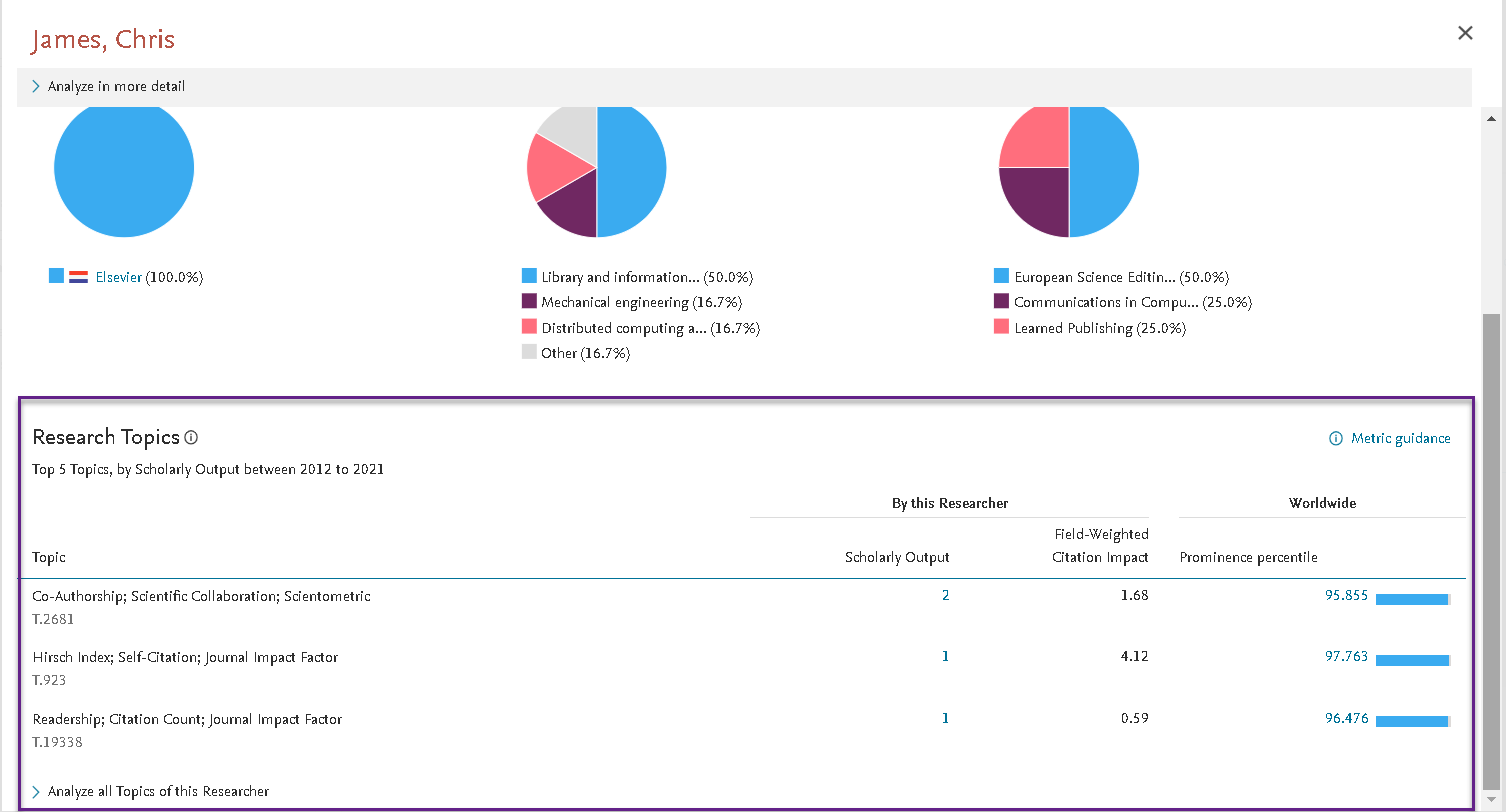
- View the Top 5 Topics for a Researcher in the Author details modal
We have added the top 5 Topics that a Researcher has contributed to, to the Author details modal.
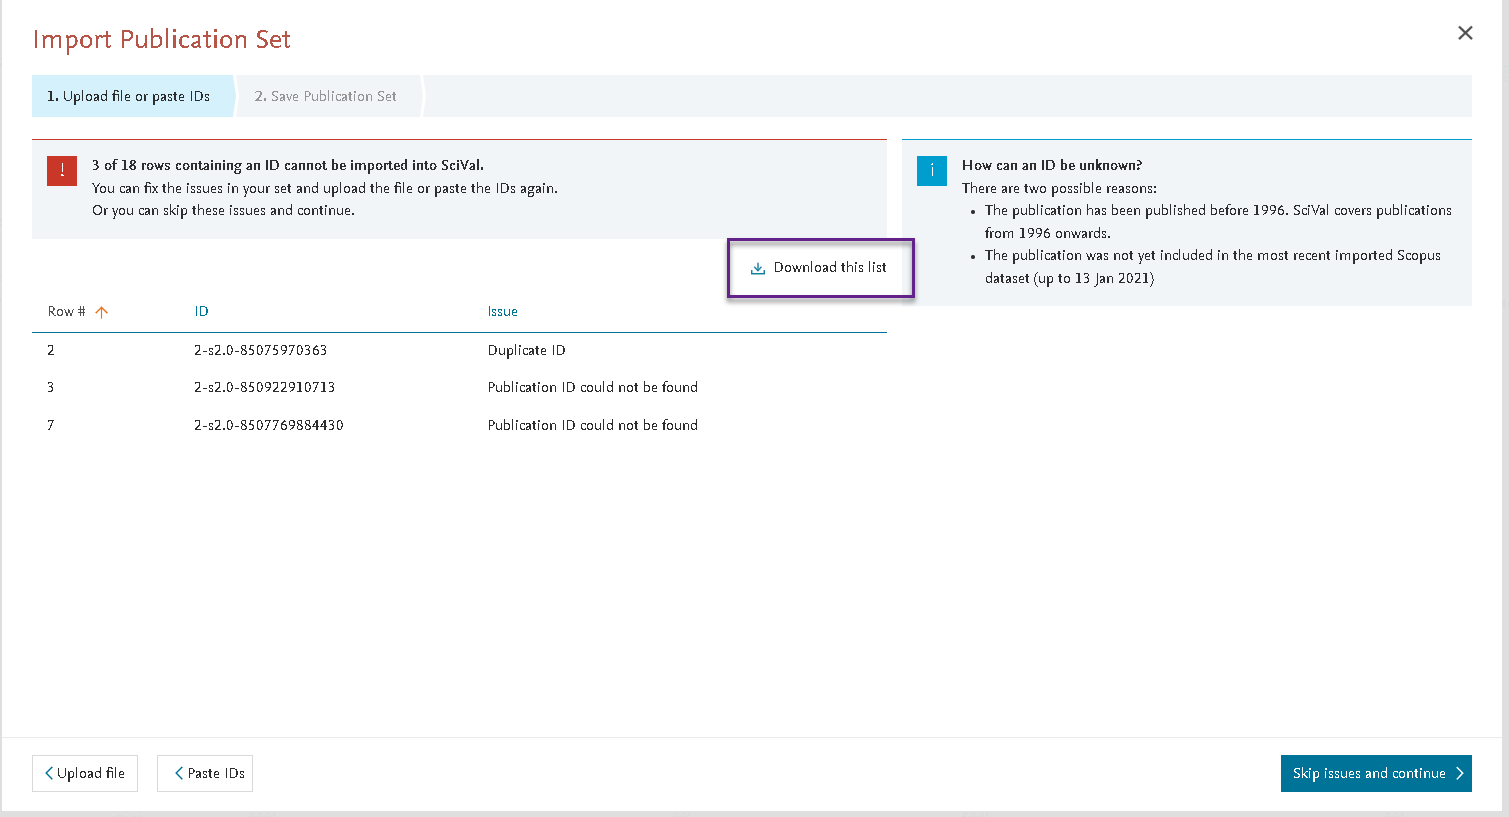
- Export unmatched IDs from the Publication Set definition modal
The new export function in the Import Publication Set flow allows you to export IDs that are not recognized by SciVal, making it easier to double-check the IDs offline and re-try the import.
Impact module:
- Citing Policy Body Countries metric available for Researchers, Researcher Groups and Publication Sets
The metric lets you see the location of the policy bodies citing your work and helps you understand the geographic influence your research is having on policy making globally.
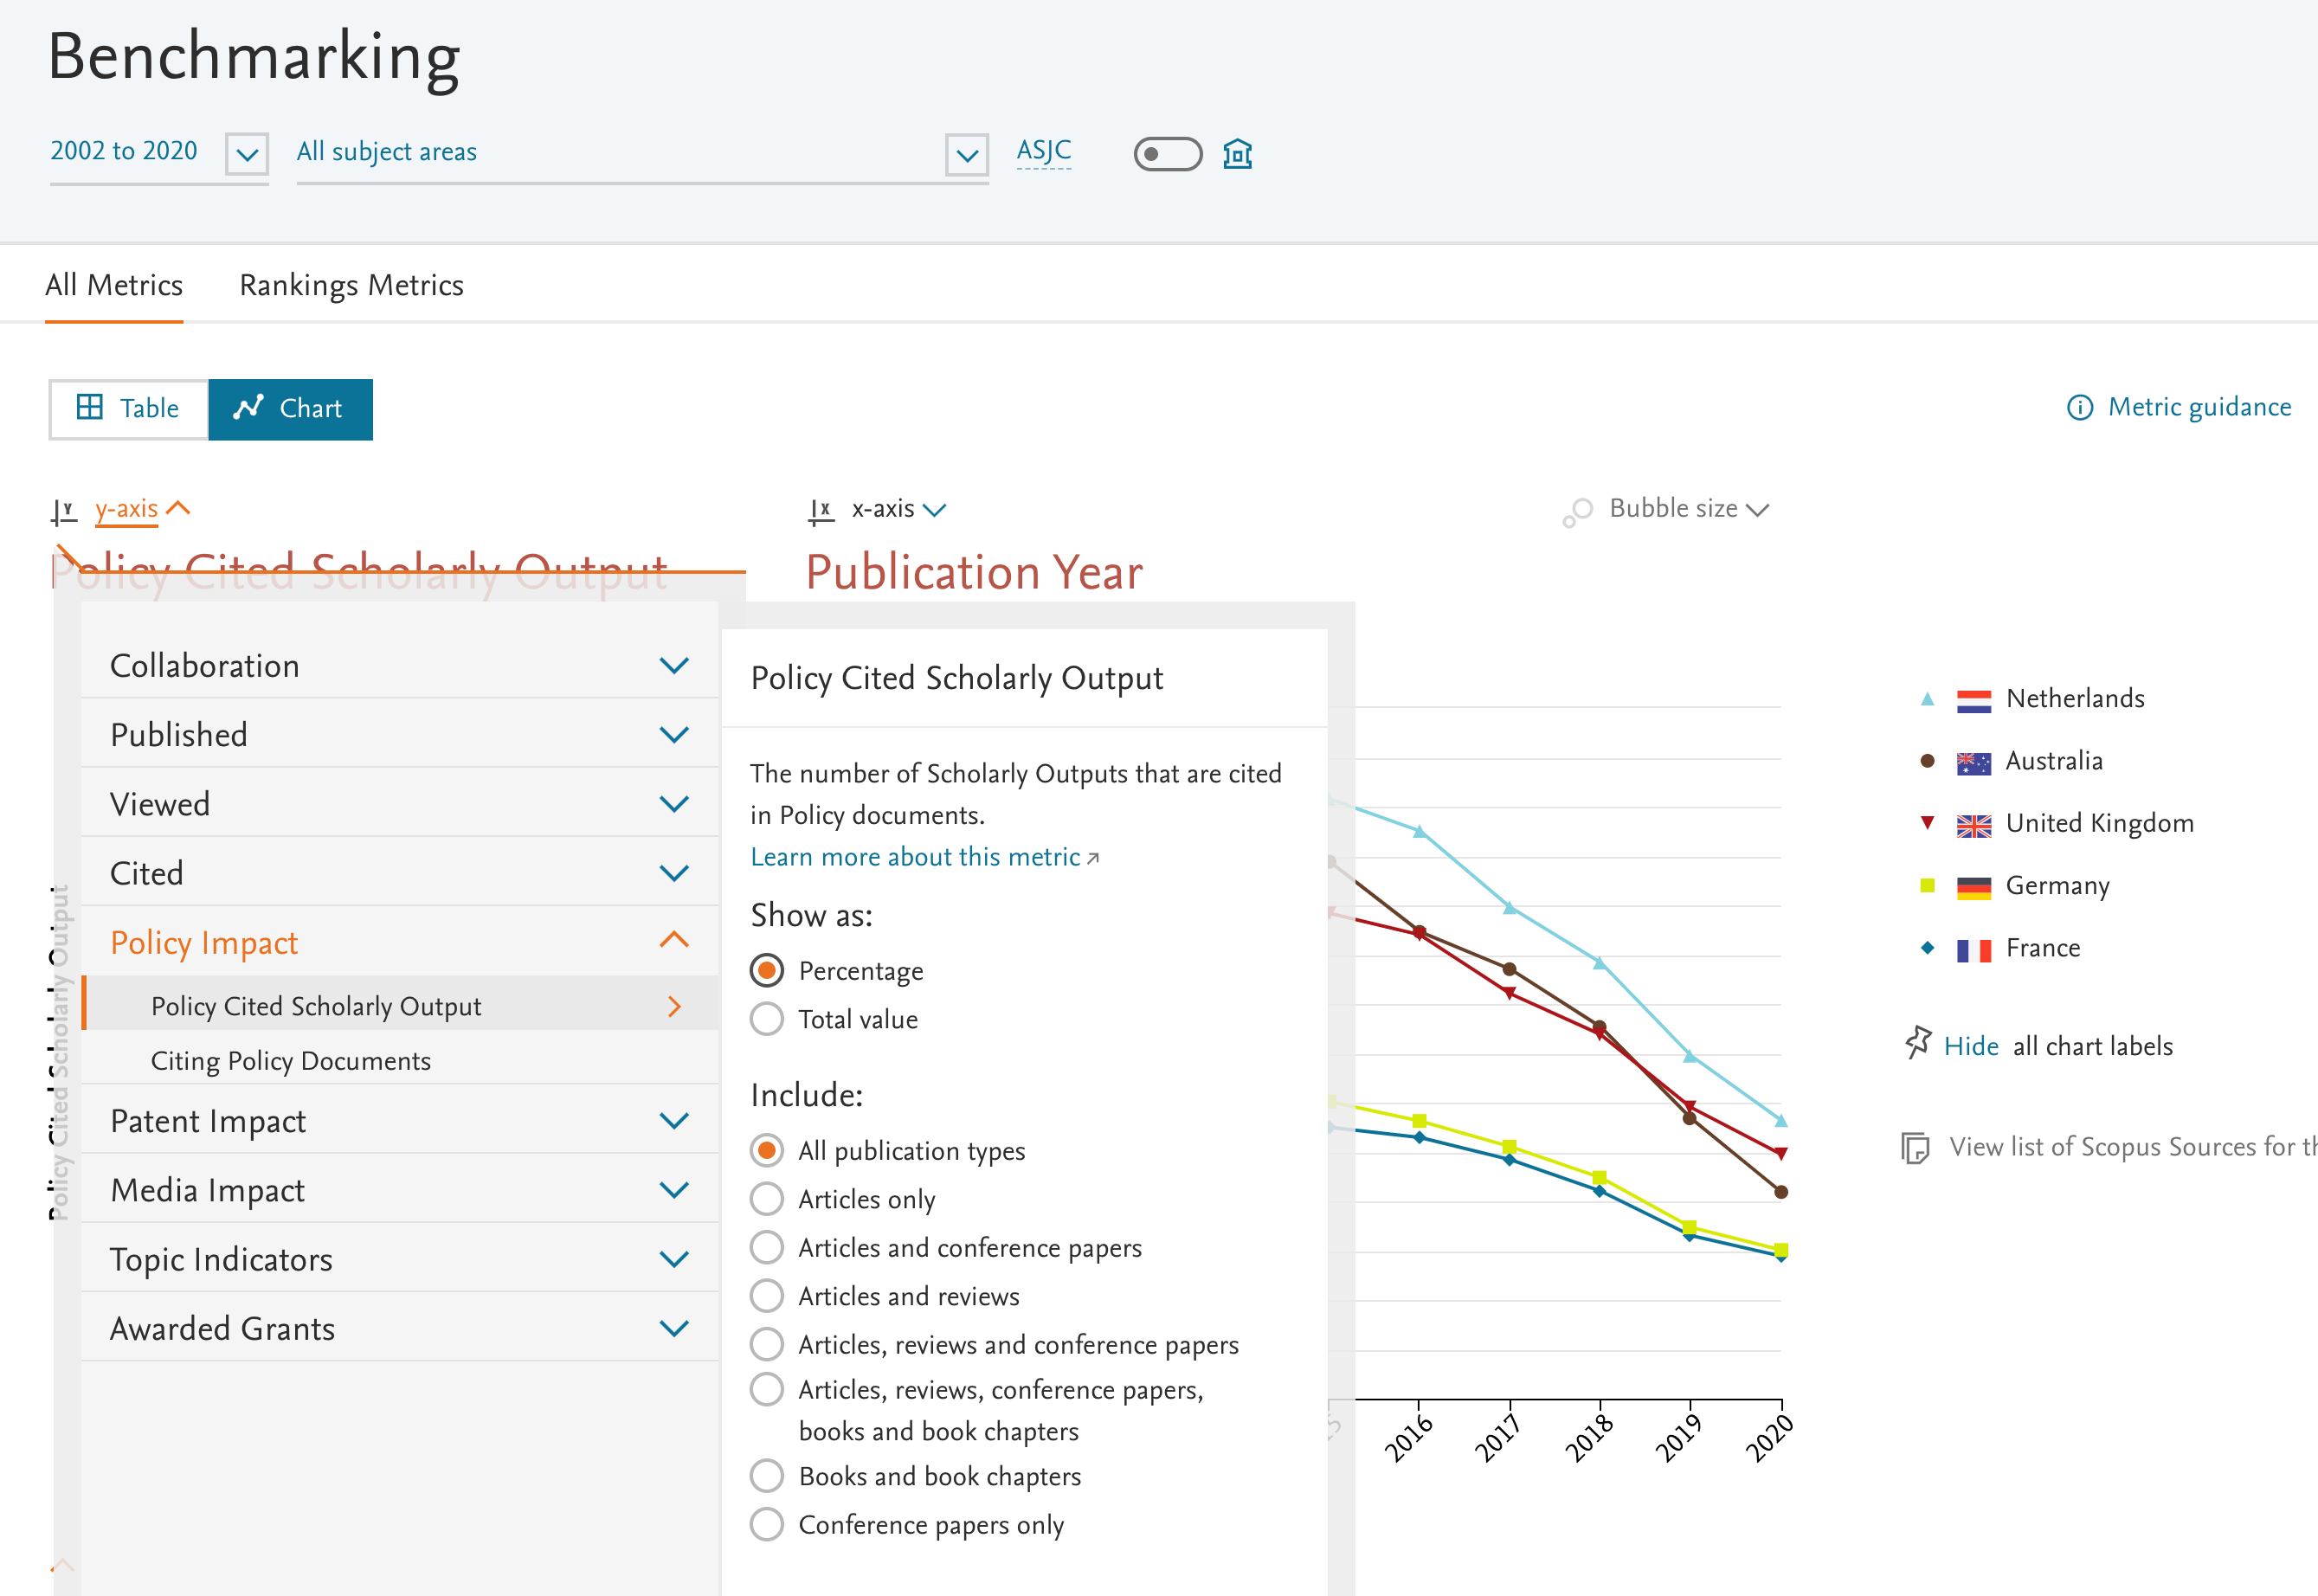
- Compare the percentage of Policy Cited Scholarly Output in Benchmarking
Select the percentage of Policy Cited Scholarly Outputs in Benchmarking to normalize the Scholarly Output by size. This allows you to compare entities publishing in similar subject areas, no matter the quantity they have published.
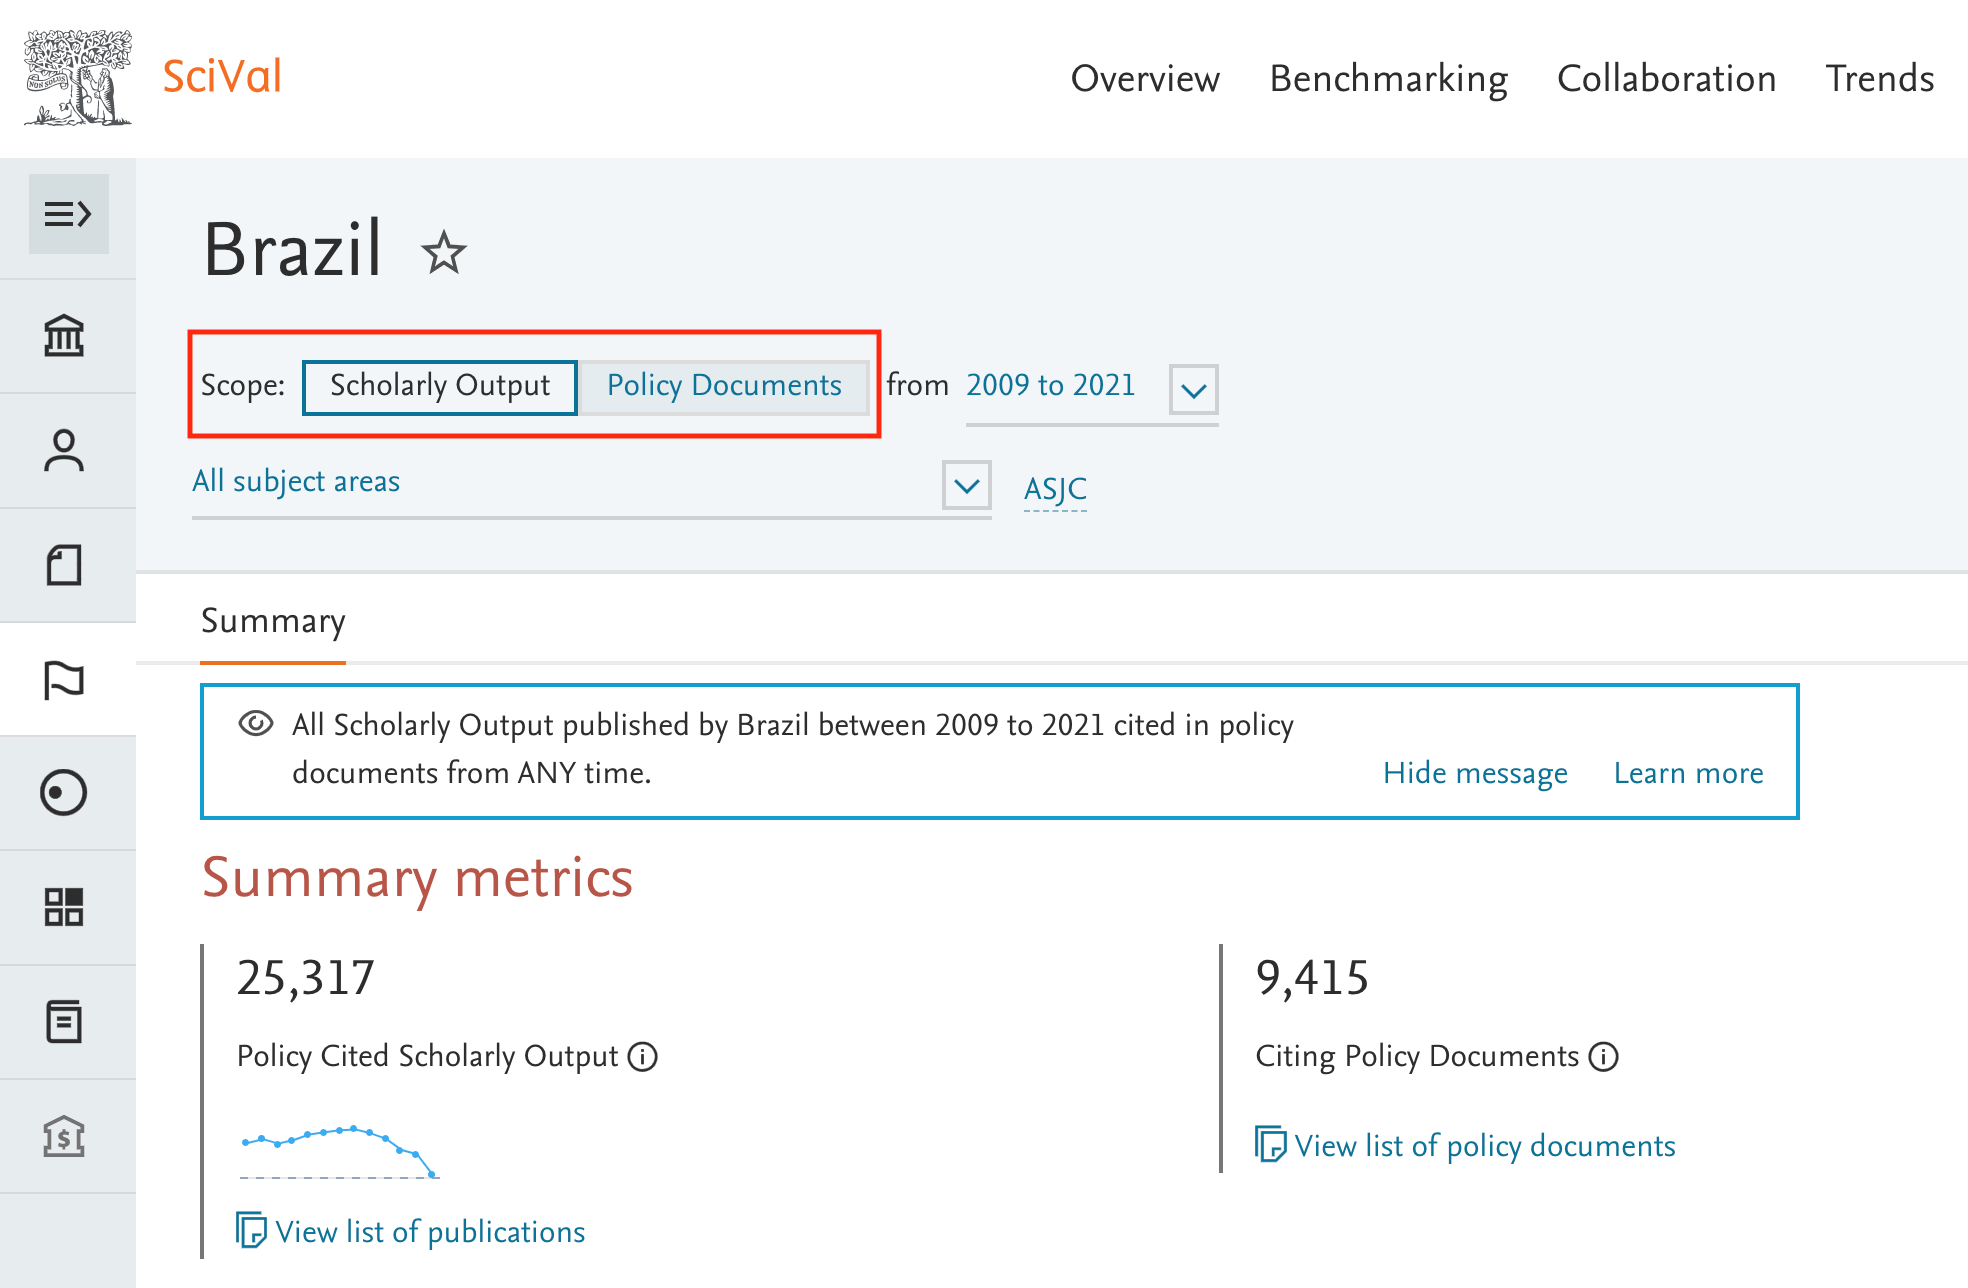
- New navigation for the Scholarly Output and Policy Document views
The tabs for these 2 views have moved above the subject classification selector. This is in preparation for the additional data types of Twitter, mass media and patent citations coming in the next year.
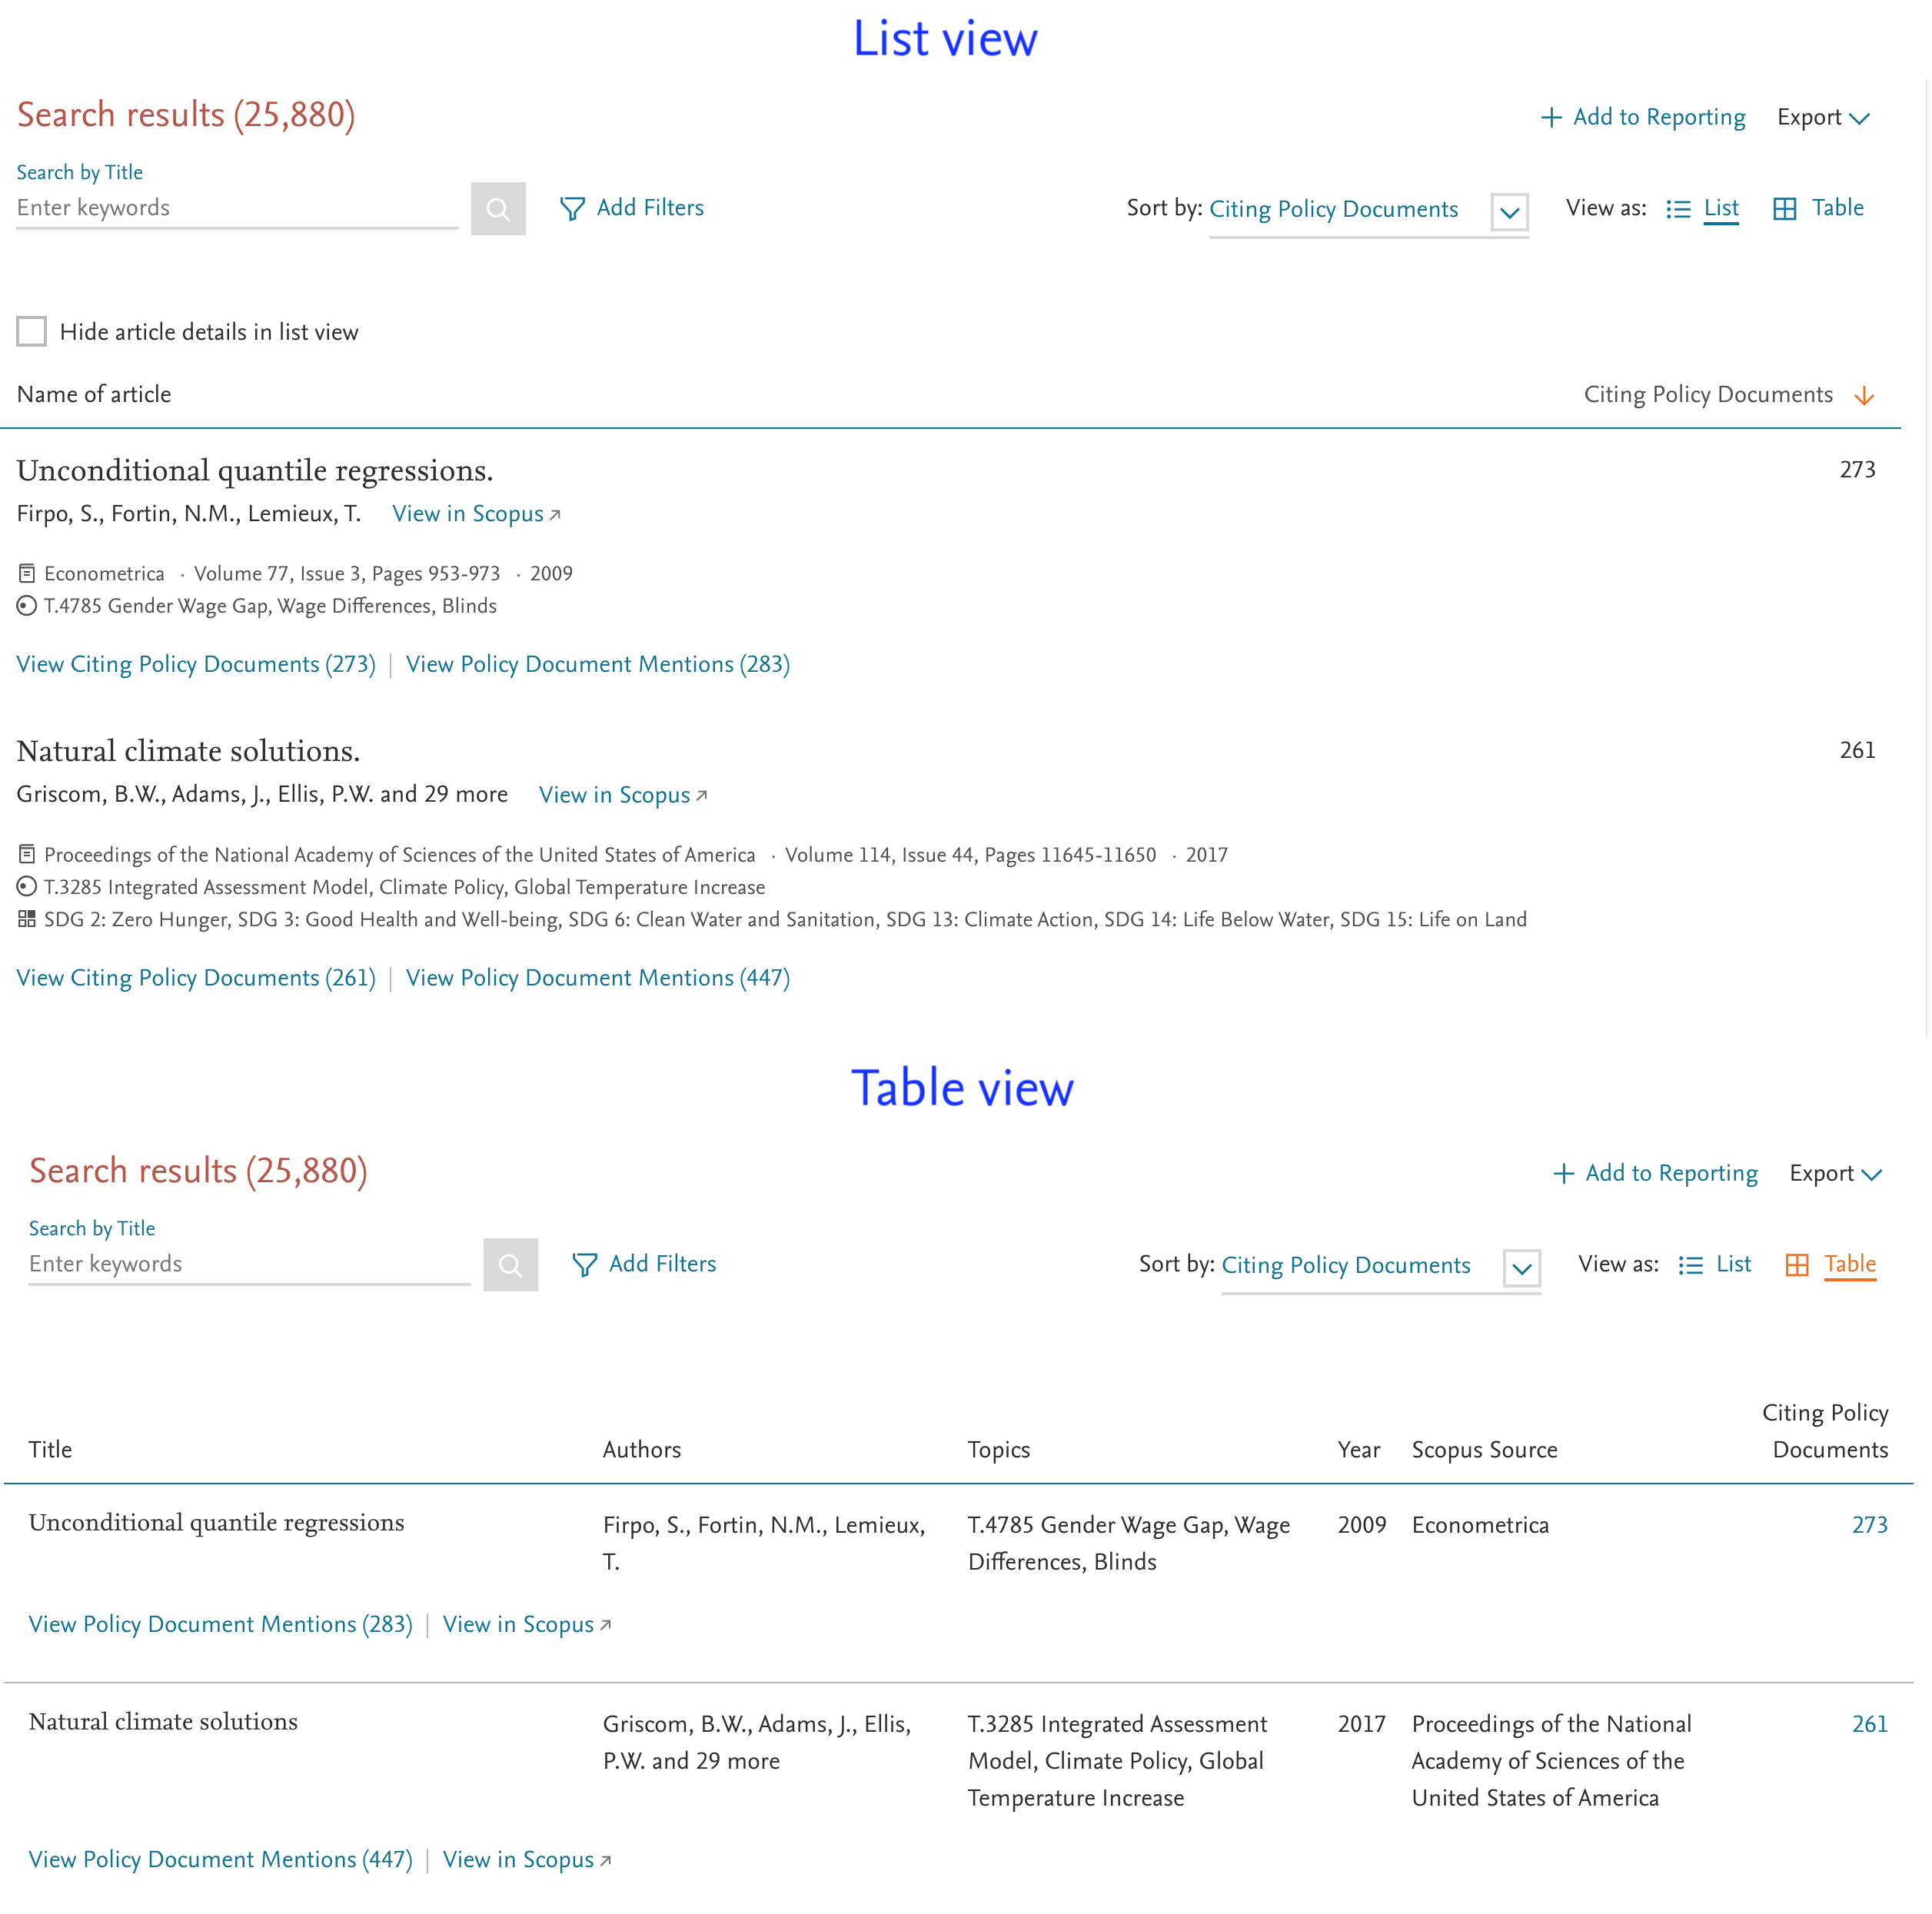
- View the search results as a list or table
The table view lets you fit more content into a smaller view and removes information such as the SDGs and Topic linked to the cited article.
Grants module:
- Visualize annualized Awards Value (USD) in SciVal Grants
The new Annualized Awards Value (USD) graph indicates the available per year funding in your area of analyses. For transparency purposes, we distinguish between exact instalment details and the awards value split evenly across the life of the award. The visualization is available by clicking ‘View allocation details’ link next to Annualized Awards Value metric.
- Configure Grants dashboard by choosing a country or an institution in SciVal Grants
The Grants dashboard now offers more flexibility by enabling the population of columns with the countries and / or institutions you are interested in. Understand how different research fields were funded from an Institution or country perspective or what proportion of global or country level funding went to an institution for example.
Additional release items:
- The Media Source-type data has been updated with Newsflo data up to 10 August 2022.
- If your institution provides custom contact details, these can now also be found in the “Contact us” section of the Help menu as well as in their usual place on the homepage.
The July 2022 release is dedicated to energy efficiency. Reducing the amount of energy you use in your daily life can make an impact on moving towards sustainability and contribute to combatting climate change. There are many things you can consider, such as insulating your home to cut back on heat waste, reducing the power consumption of your lighting by using low-power bulbs and smart lighting systems, or turning off electronic appliances rather than leaving them on standby.
The Energy release brings you a new SciVal module – the Impact module, the ability to organize your Publication Sets and Research Areas in folder structures, and a new export field in the author list download to identify which authors are currently affiliated with the Institution.
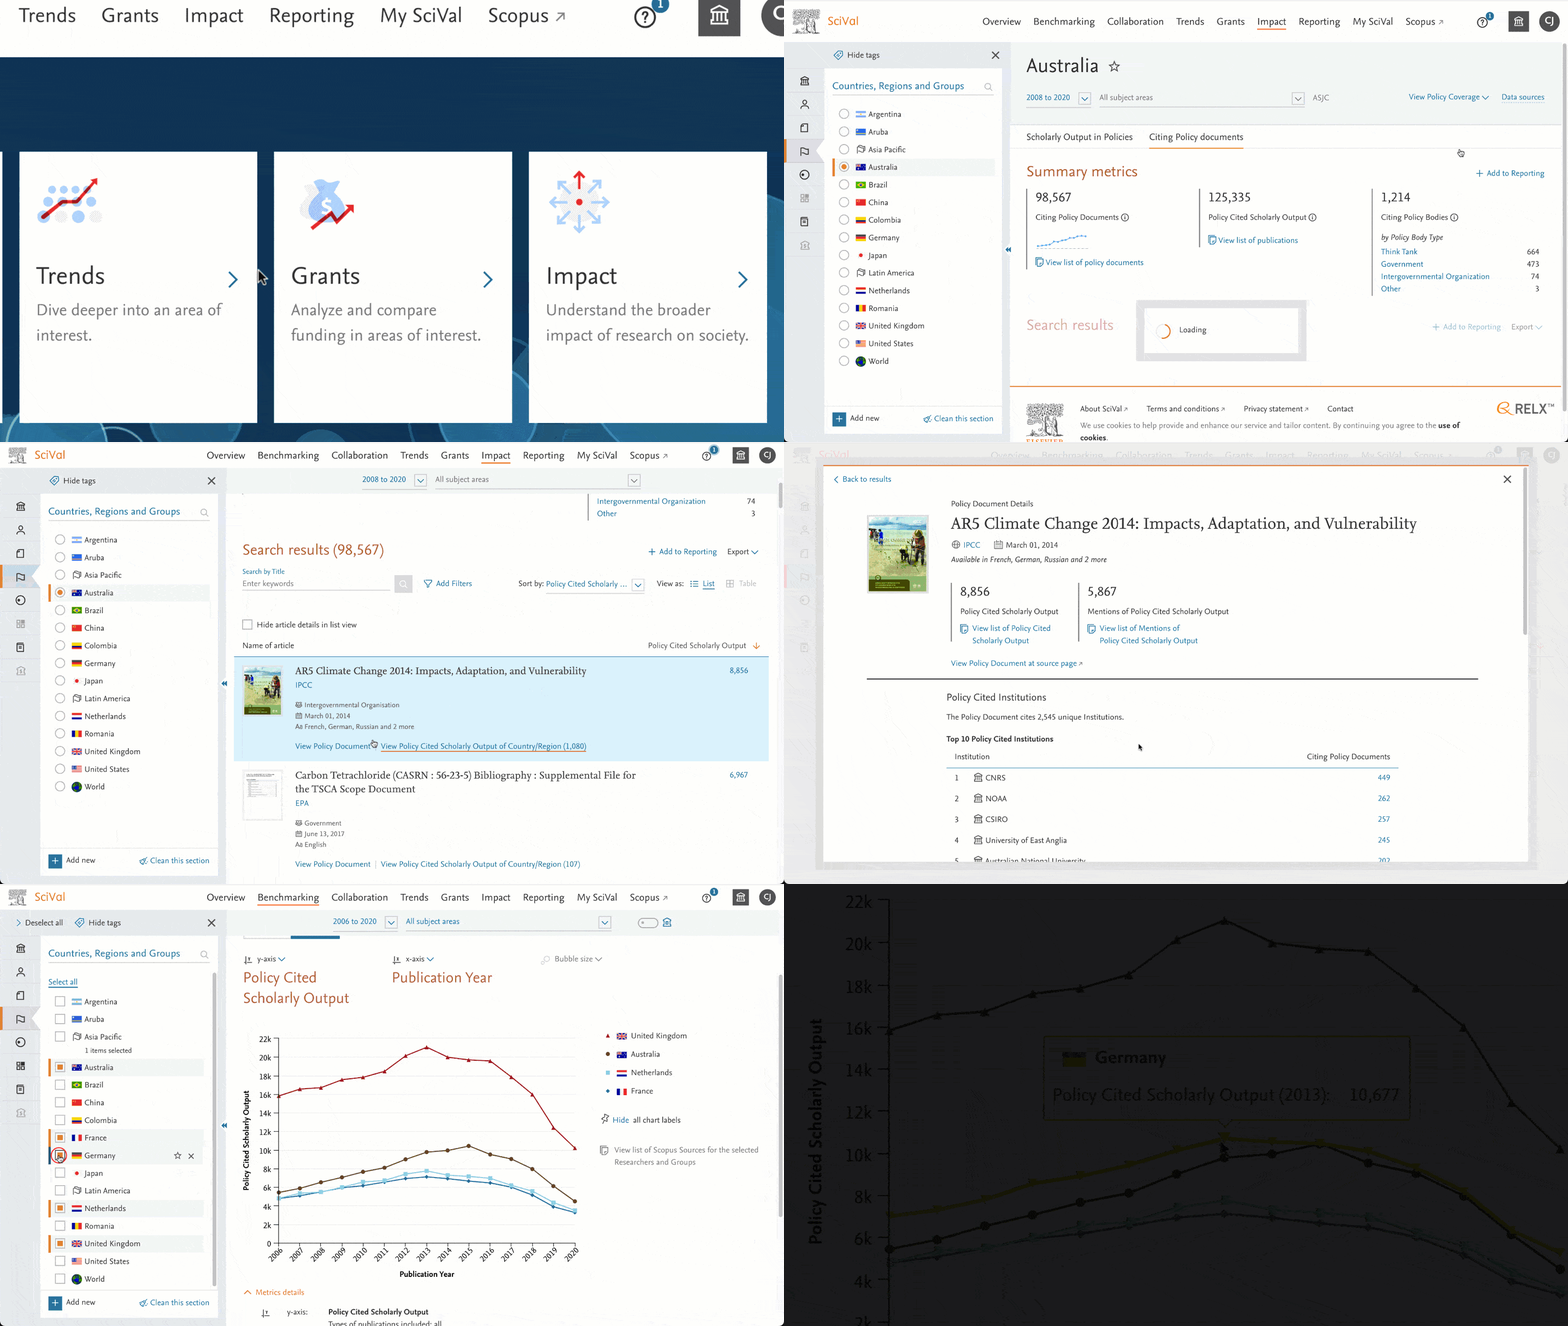
- Uncover evidence of your broader impact with the SciVal Impact module
This new paid for module pulls in policy data from Overton and over the next year we plan to add deeper datasets around media, Twitter and patents.With the launch of the Impact module, you can:
- Build clear impact narratives and evidence of your broader impact on society, with access to impact metrics and mentions of your research in policy documents
- Showcase, evaluate and benchmark your broader impact on society with policy citations and other impact metrics.
- Enrich funding bids and identify the researchers and research outputs influencing policy making.
- Read and understand the full scope of key policy documents and discover the context around mentions of your research.
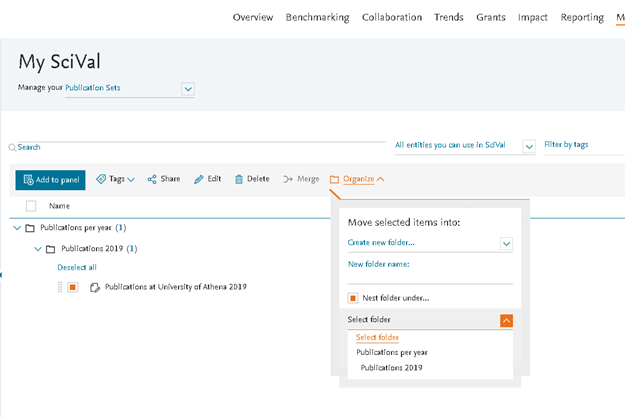
- Organize your Publication Sets and Research Areas with folder structures in My SciVal
You are now able to create folders within folders in My SciVal to better organize your user-defined Research Areas and Publication Sets. The new folder structures, which can be up to 5 levels deep, will make it easier to structure your entities according to the subject of analyses and quickly find the ones you are looking for later. Simply use the “Nested folder” option under the “Organize” feature to create nested folders.
- Identify authors currently affiliated with your Institution in the full list of authors download
We have added an additional field to the full author list file, indicating the most recent primary affiliation per author. This allows you to distinguish authors currently affiliated with the institution of interest from authors who have moved to other institutions. The “Download full list of authors” option can be found in the Institution details modal as well as in the authors tab when an Institution is selected. The new field will become available in the beginning of next week. - REF 2021: Analyze an Institution’s submitted publications per Unit of Assessment
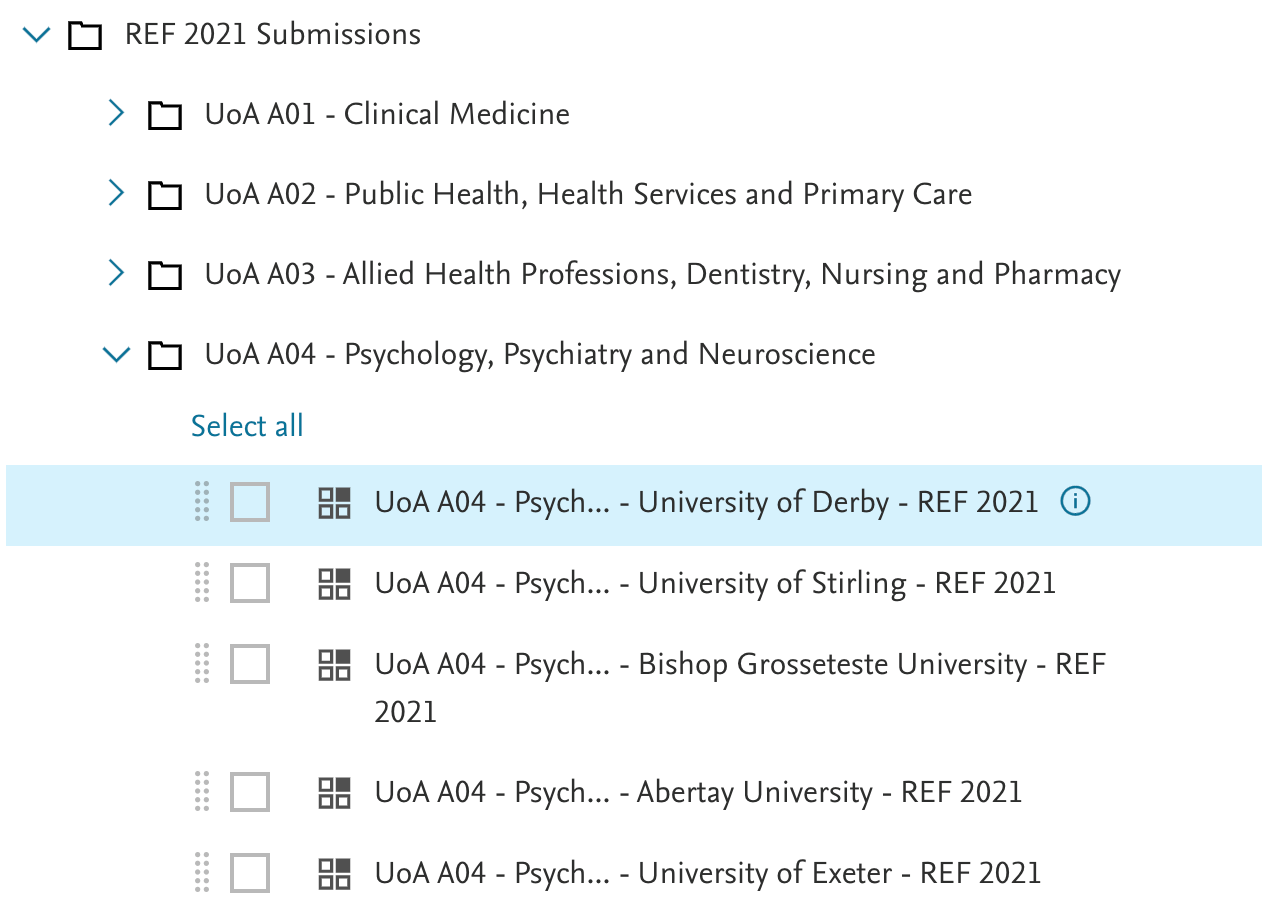
We have created around 1,900 Research Areas to display the submitted publications to the Research Excellence Framework (REF) per Unit of Assessment (UoA) for each UK institution. The Research Areas will become available next week and can be found in My SciVal in the “REF 2021 submission” folder or via the Research Area search on the left panel. Learn moreopens in new tab/window.
- Include QS and THE subject area names and codes in your publications export
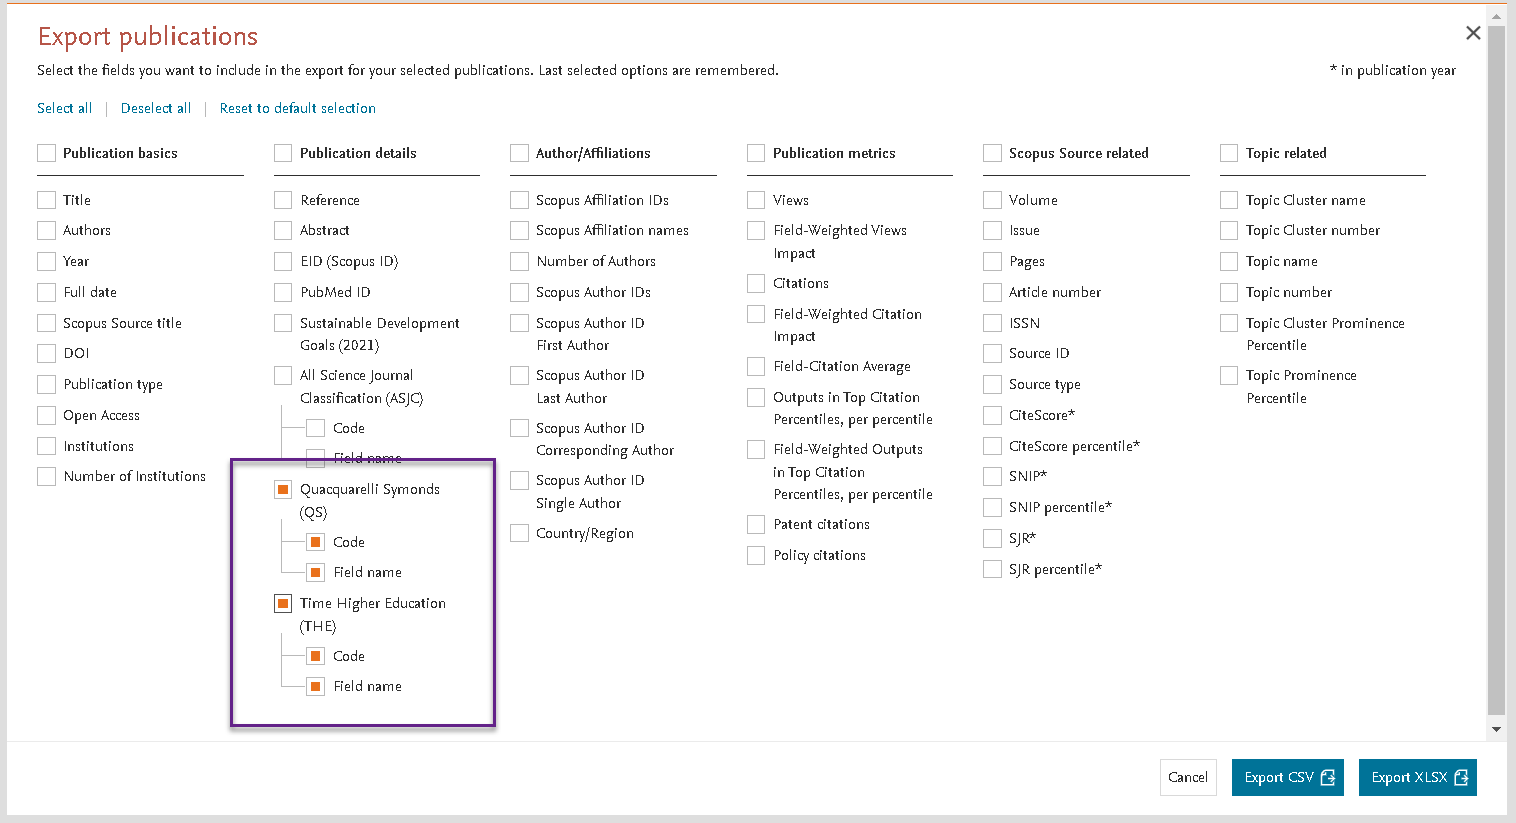
It is now possible to include the subject area names and codes for the QS and THE subject area classifications when exporting lists of publications from the publication’s modal.
- 2022 SDGs now visible in SciVal
SciVal now contains the 2020 and 2022 SDGs as Research Areas, so you can see which of your entity’s publications have been mapped to each SDG. Next time you edit a report containing the 2021 SDGs it will automatically convert to the 2022 mappings. Learn more about the new mappingsopens in new tab/window. - Improved navigation between entity types in My SciVal
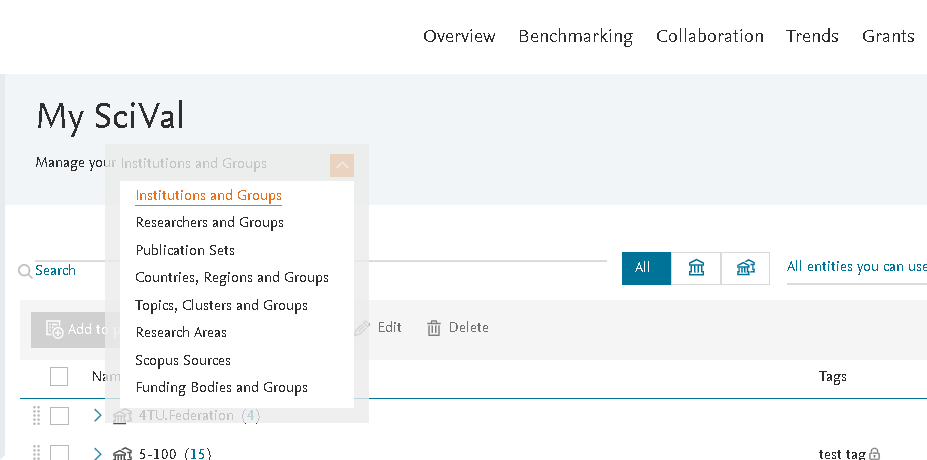
The new header design allows you to navigate between different entity types more easily in My SciVal to manage your entities.
- Visualize an Institution’s Awards Value distribution in SciVal Grants
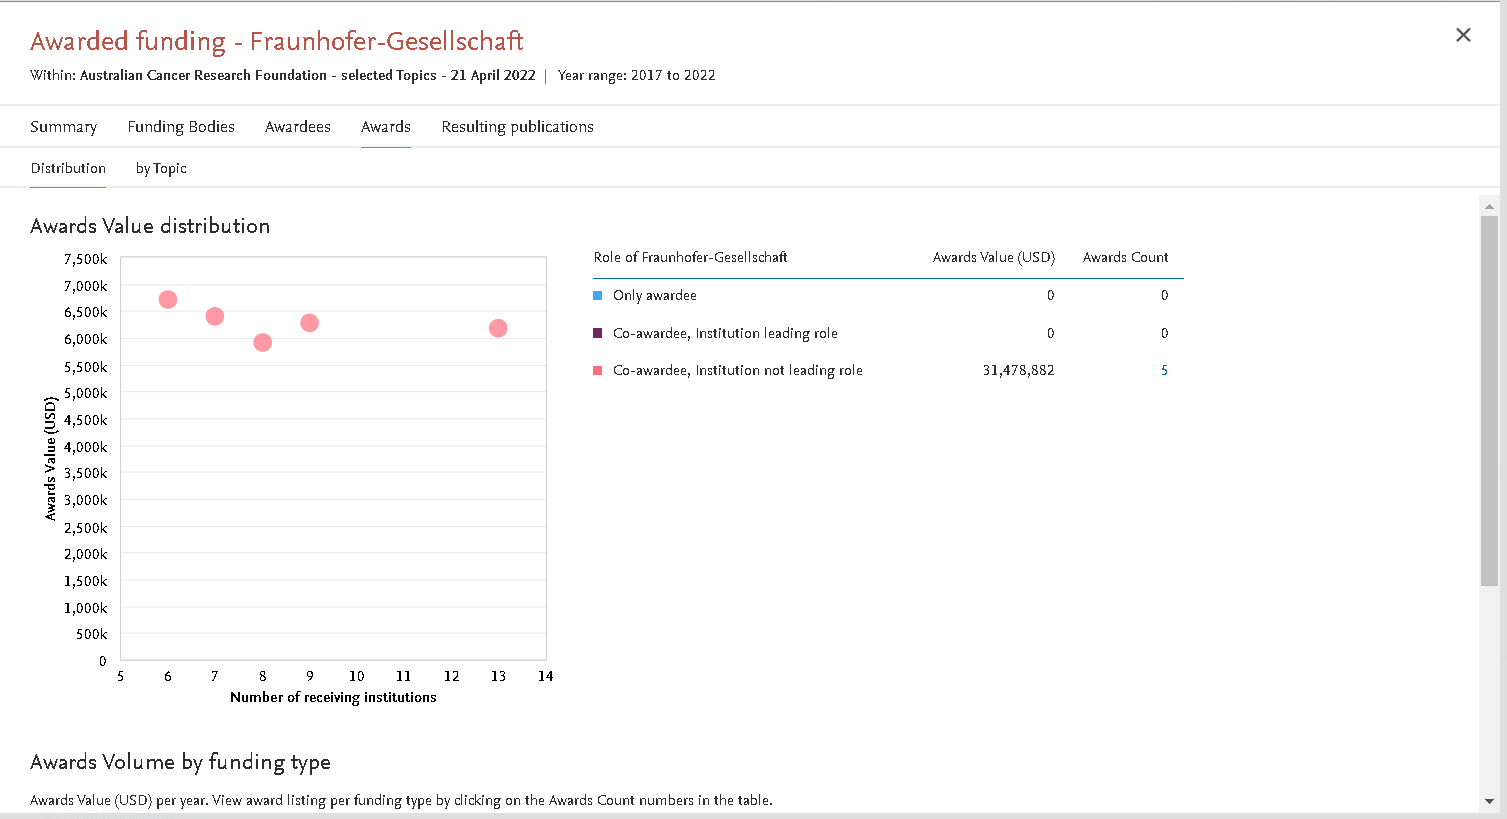
The new scatterplot visualization shows the distribution of successful grants in which an Institution has been the only institution, or a co-awardee in a leading or non-leading role. The visualization is available in the Awards tab in the Institution details modal.
- Analyze co-awarded Institutions and their role in successful grants
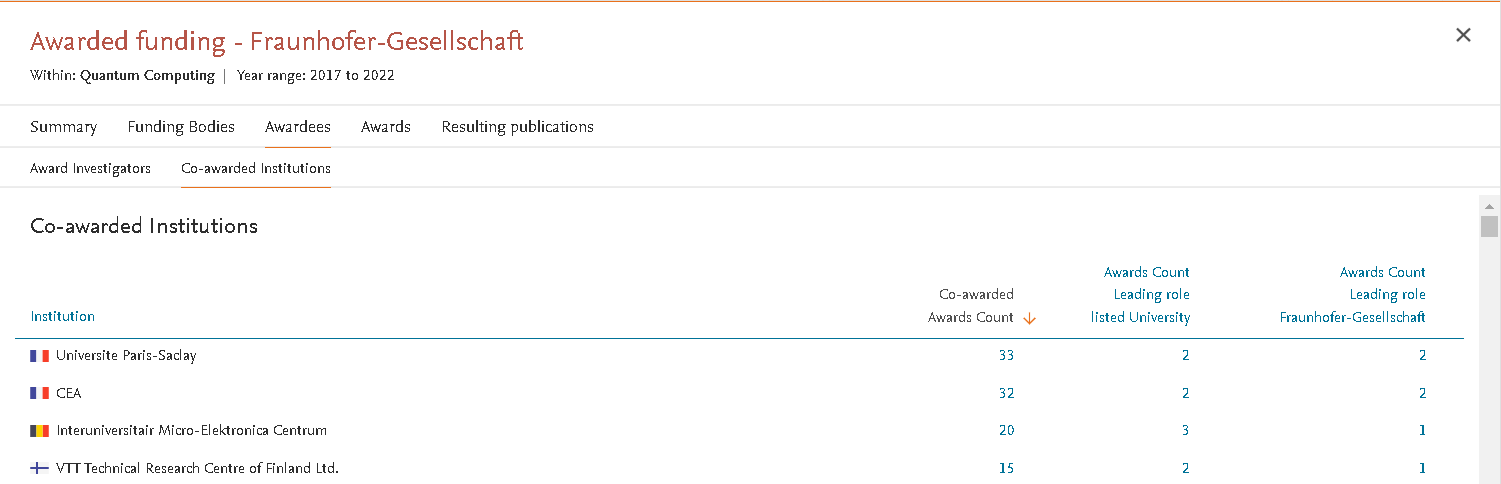
The new “Co-awarded Institutions” tab lists all co-awardees of the selected institution and indicates on how many grants either institution had a leading role. The tab can be found in the institution details modal when selecting an institution from the Co-awardee matrix.
With the June 2022 release, we want to encourage you to consider how you can lower your personal Carbon footprint by identifying opportunities to “decarbonize” your everyday life.
The Decarbonize release will bring you new visualizations, such as the Relative Activity Charts for publications by SDG (2021 queries), new filter options and several other enhancements.
Furthermore, the yearly rollover, which will take place next week, will bring you updated year ranges and the latest CiteScore, SNIP and SJR values as well as recalculated Prominence percentiles.
- Yearly rollover (June 21)
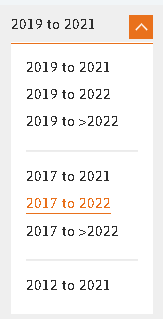
Each year in June, the Scopus content for the previous year (i.e. 2021) is considered over 95% complete. This is the point we make it a “complete year” in SciVal and we then move our pre-defined time ranges in the Overview, Collaboration and Trends modules, forward by one year. The new ranges, which will become available in SciVal next week, are used to calculate the latest metric values and also make some changes to the Topics and Topic Clusters as below:
- Recalculate the Prominence Percentiles for all Topics and Topic Clusters using the 2020 CiteScore metrics
- Reallocate papers published in 2019 from their current Topic to a more dominant Topic where applicable
Learn more about the yearly rolloveropens in new tab/window
- Visualize and gain greater insight into publications mapped to each SDG (2021) with the new Relative Activity Chart
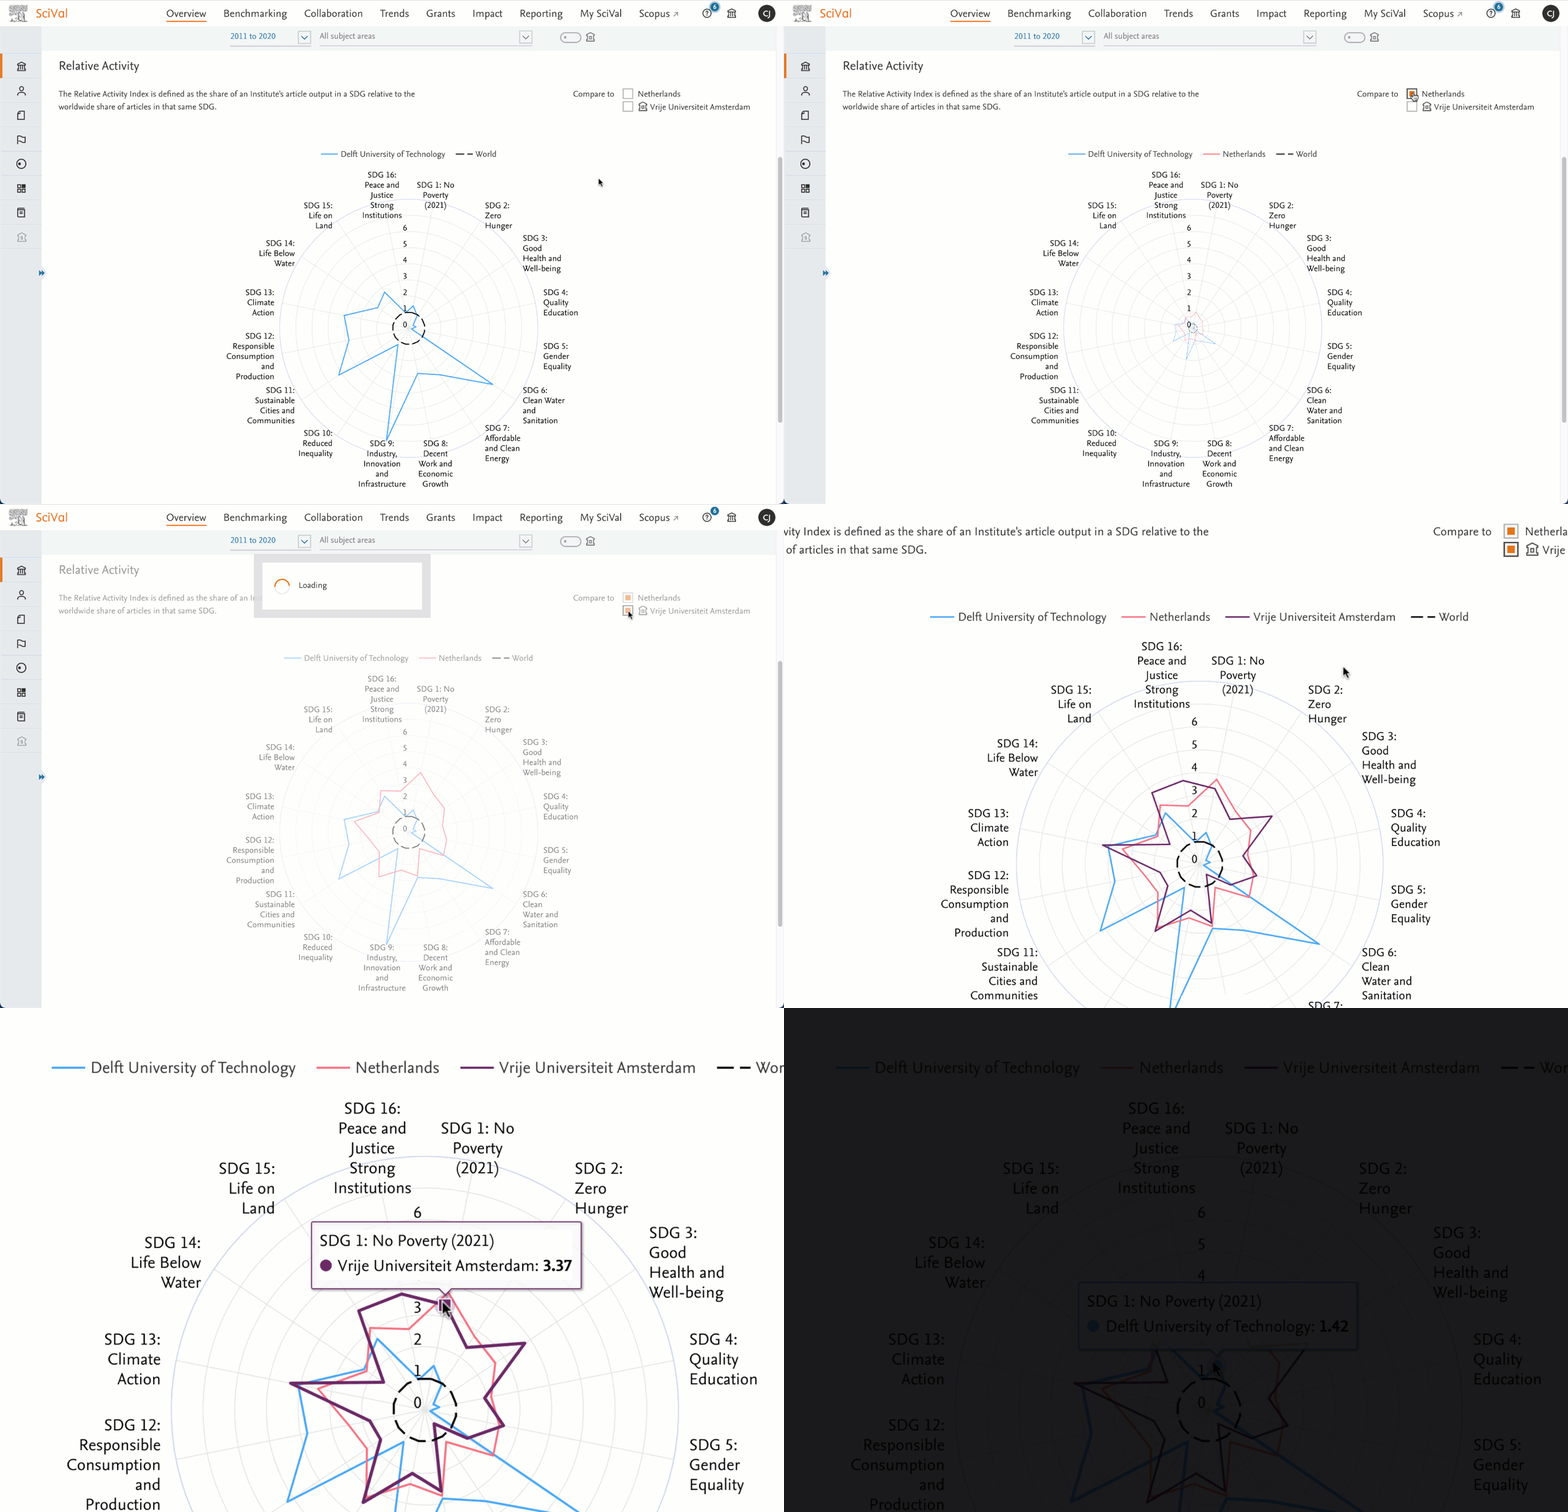
The new Relative Activity Chart for publications mapped to each SDG (2021 queries) allows you to evaluate an entity’s publications per SDG relative to the World average, the average for the country of your institution, and the average for your home institution.
The new visualization is available for Institutions and Countries in the Overview module, under the ‘Published by SDG’ tab.
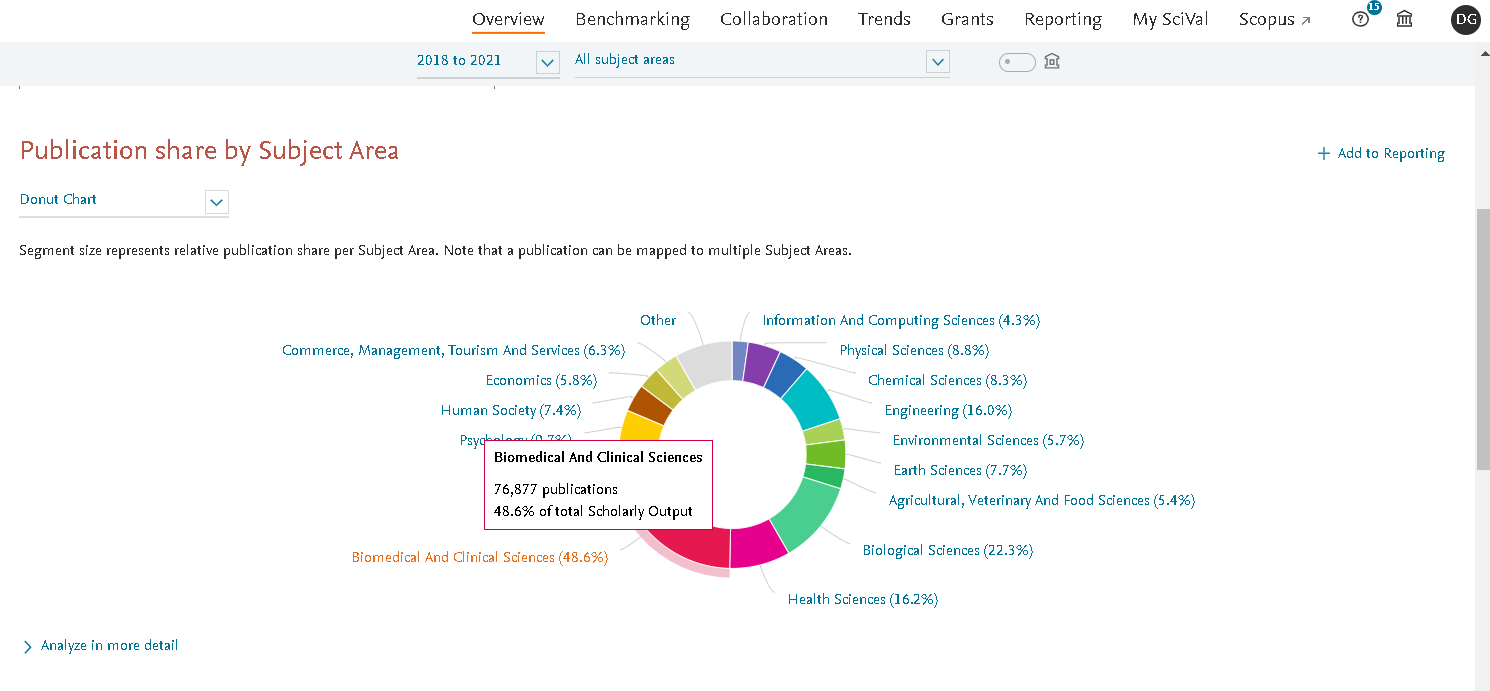
- New Bar Chart visualization for Publication share by Subject Area and improvements to existing visualizations
The new bar chart visualization, which is available in the Overview module ‘Summary’ tab, shows an entity’s publication share by subject area relative to the total Scholarly Output of that entity – enabling you to quickly see the distribution of Scholarly Outputs across different fields of research.
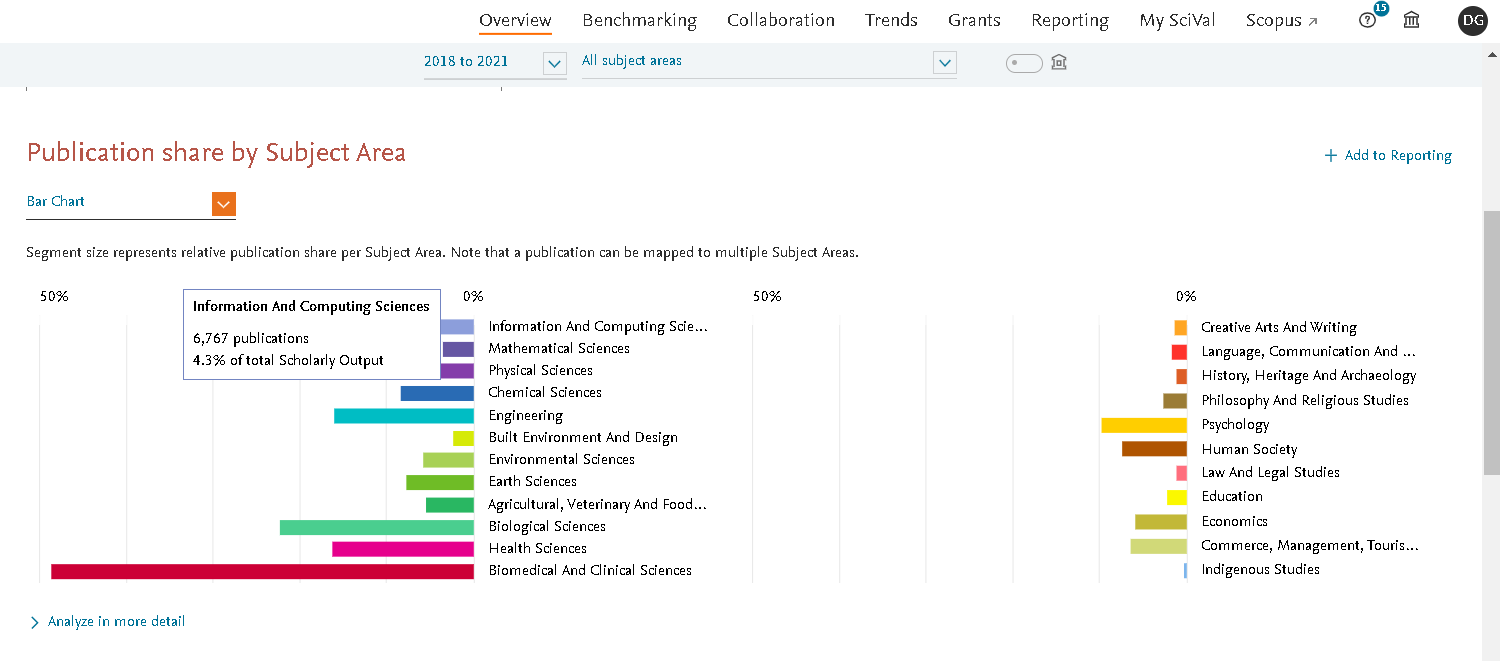
We have also changed the way percentages are calculated in the existing chart visualizations – the percentages now relate to the number of Scholarly Outputs mapped, as opposed to previously when the number of Scholarly Outputs used counted a publication multiple times if it was mapped to several subject areas.
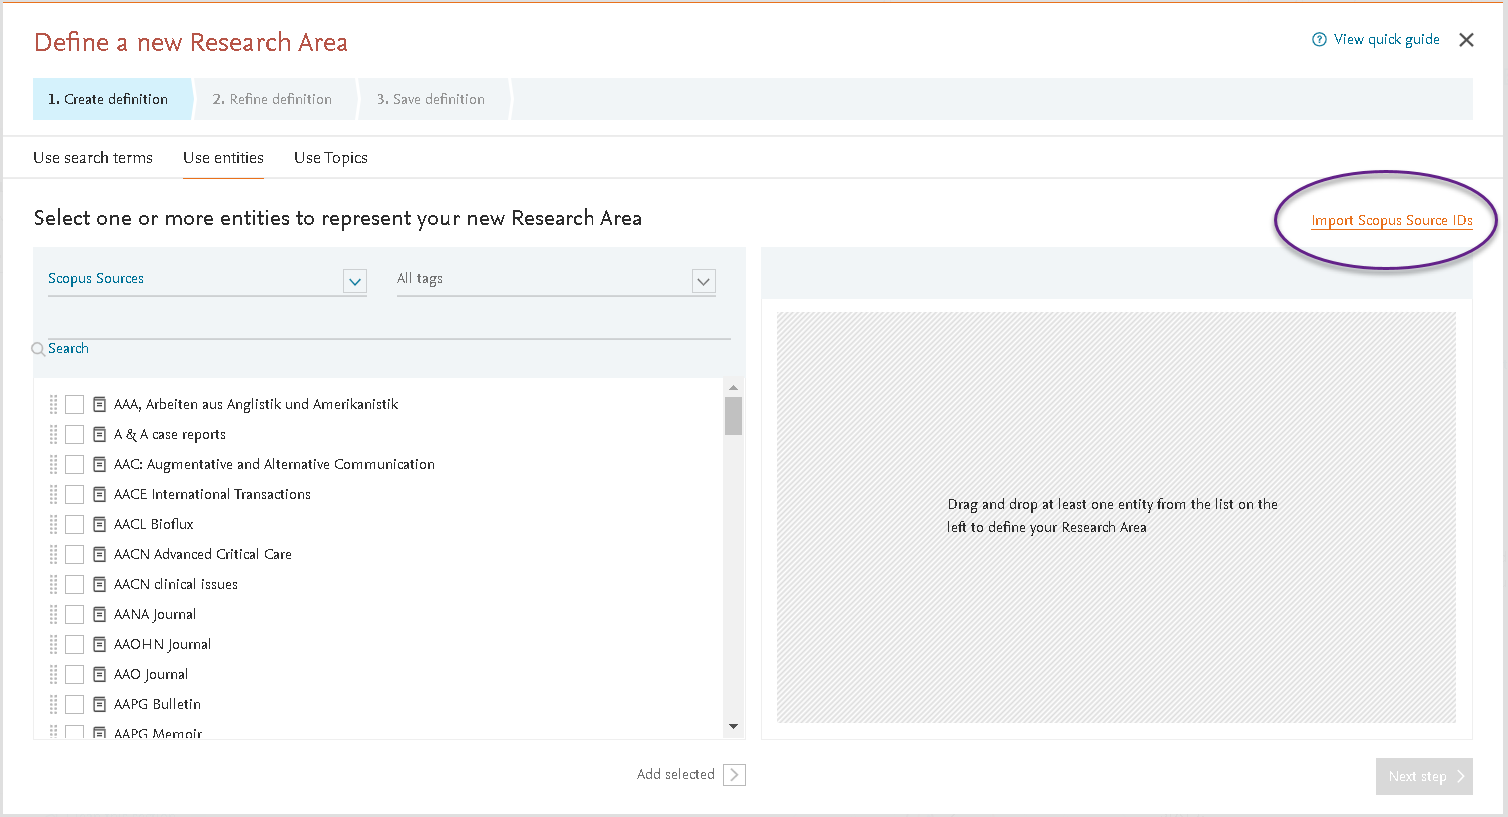
- Create Research Areas based on Scopus sources by importing Source IDs
Creating Research Areas based on the Scopus Sources you want to analyze has now become easier with the new option to import Scopus Source IDs into the Research Area definition modal. You can import up to 5000 Scopus Source IDs at once, using a plain text file or copying the IDs directly into the modal window.
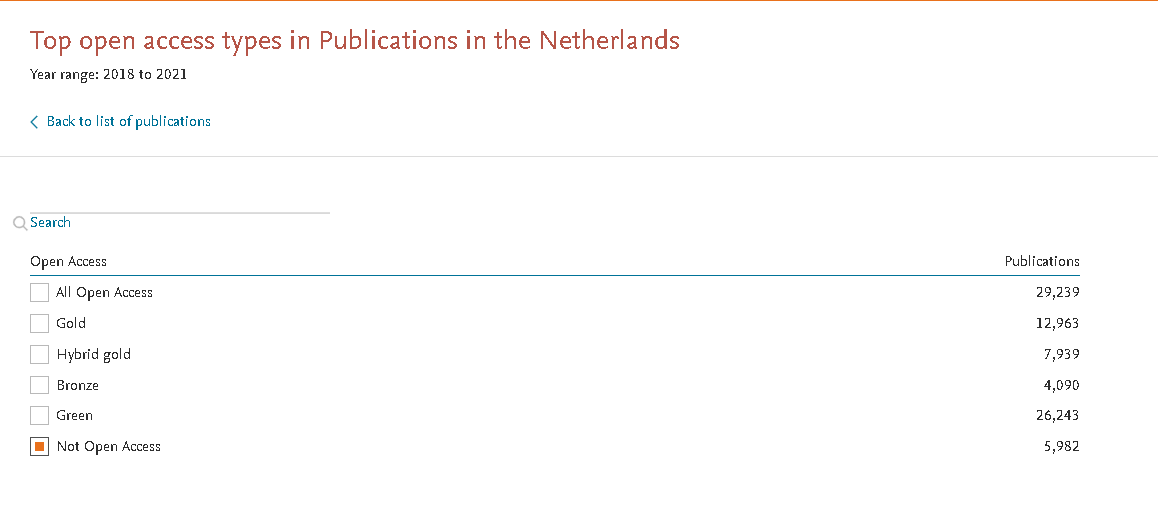
- Exclude Open Access publications from the publication results with the "Not Open Access" filter
You can now focus your analysis on publications that are not classified as Open Access by filtering them out in the publication modal. The “Not Open Access” filter is available in the “View all” option in the Open Access filter section.
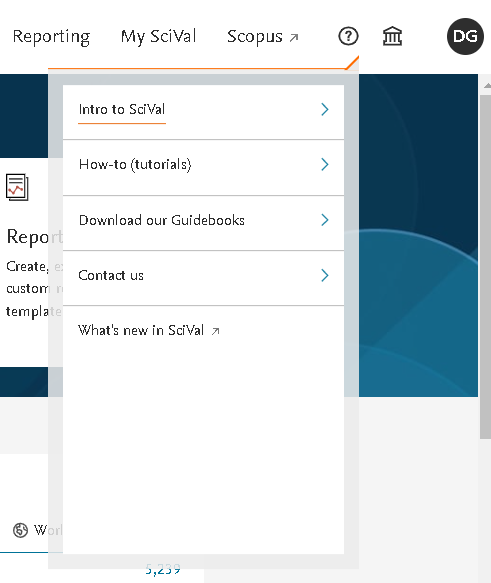
- New integrated help menu
Quickly access supporting materials, such as How-to tutorials and Guidebooks, directly in SciVal with our new integrated help menu.
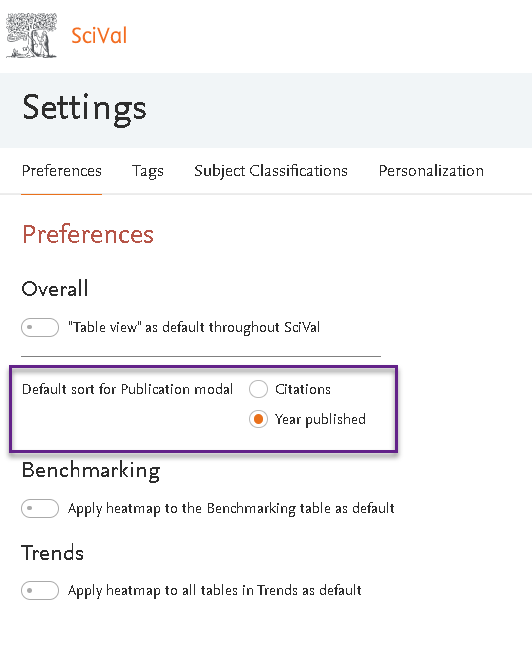
- Customize your default sort order in the publications modal
You can now choose to sort your publication results by publication year as default. The option can be found under the “Preferences” section in your Settings and will result in publications being sorted from newest to oldest in the publications modal.
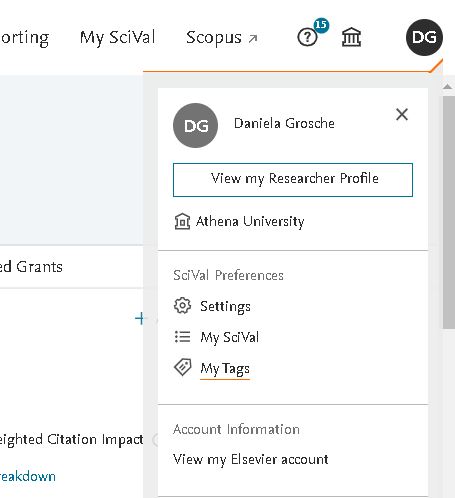
We also gave the user-profile menu a new look so you can access your connected researcher profile and SciVal preferences more easily.
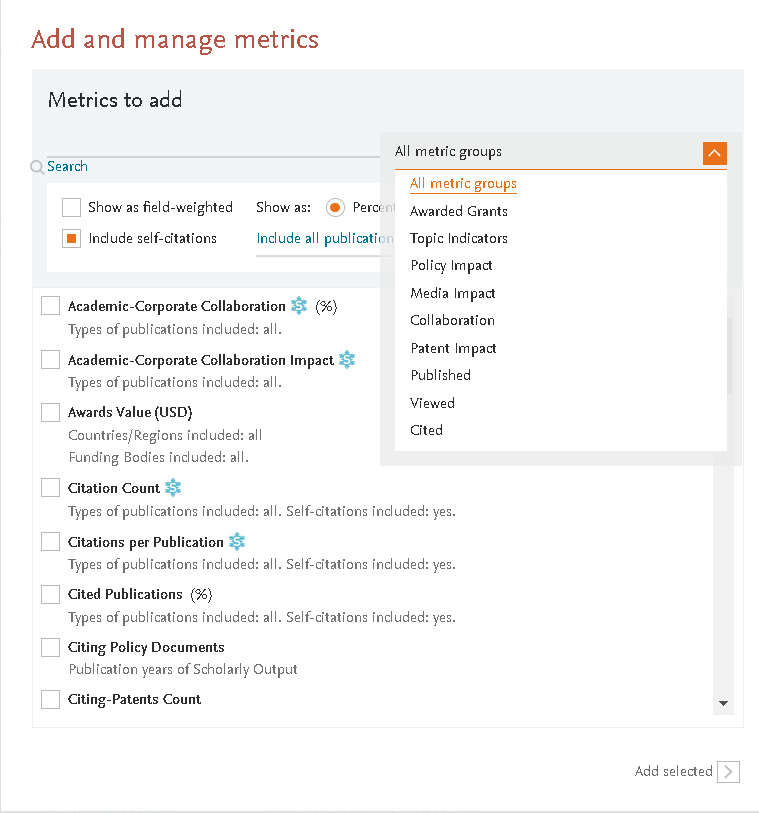
- Filter on groups of metrics in the metric selector in Benchmarking
We have introduced an additional filter option in the metric selector in Benchmarking, which allows you to filter on the group of metrics you are looking for, making it easier to navigate the modal when you want to add multiple metrics at once.
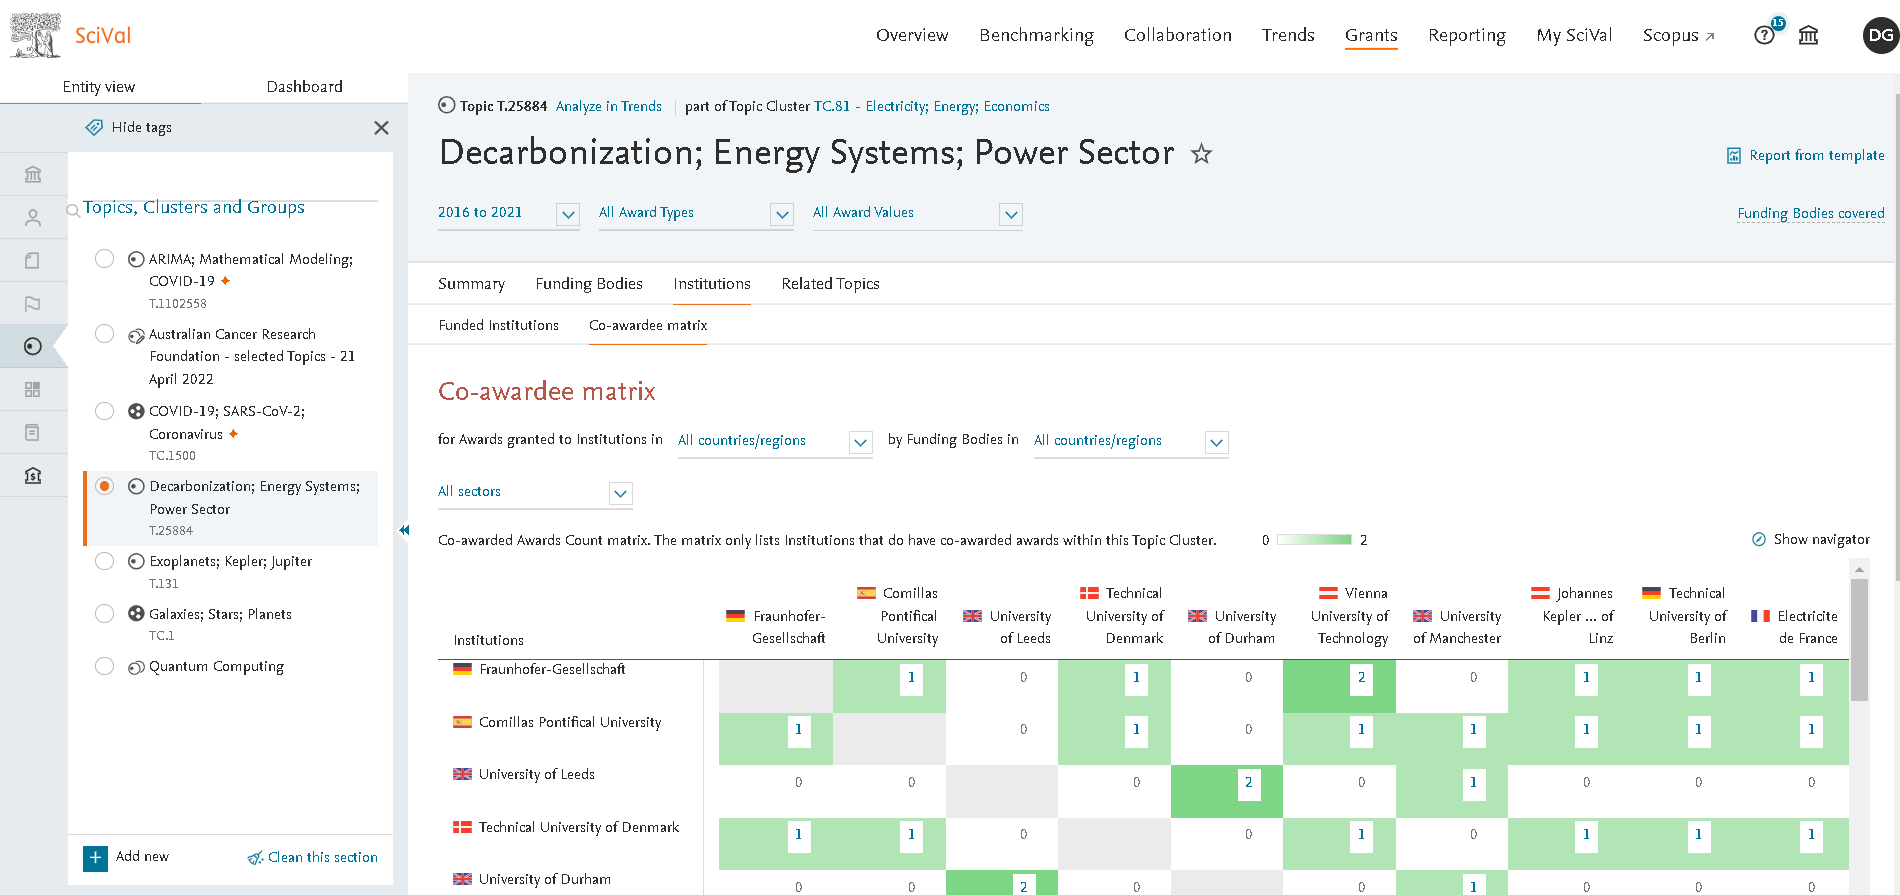
- Visualize Institutions collaborating on funding awards in SciVal Grants
You can now view and analyze which Institutions have collaborated on awarded grants with the new Co-awardee matrix. The matrix is available for Topics, Topic Clusters and Topic Groups under the Institutions tab in the Grants module.
- View the role of Institutions in awarded grants in the Grants module and filter by sector
The new bar visual in the SciVal Grants module indicates to what extent institutions have been the only institution on successful grants, or a co-awardee in a leading or non-leading role.
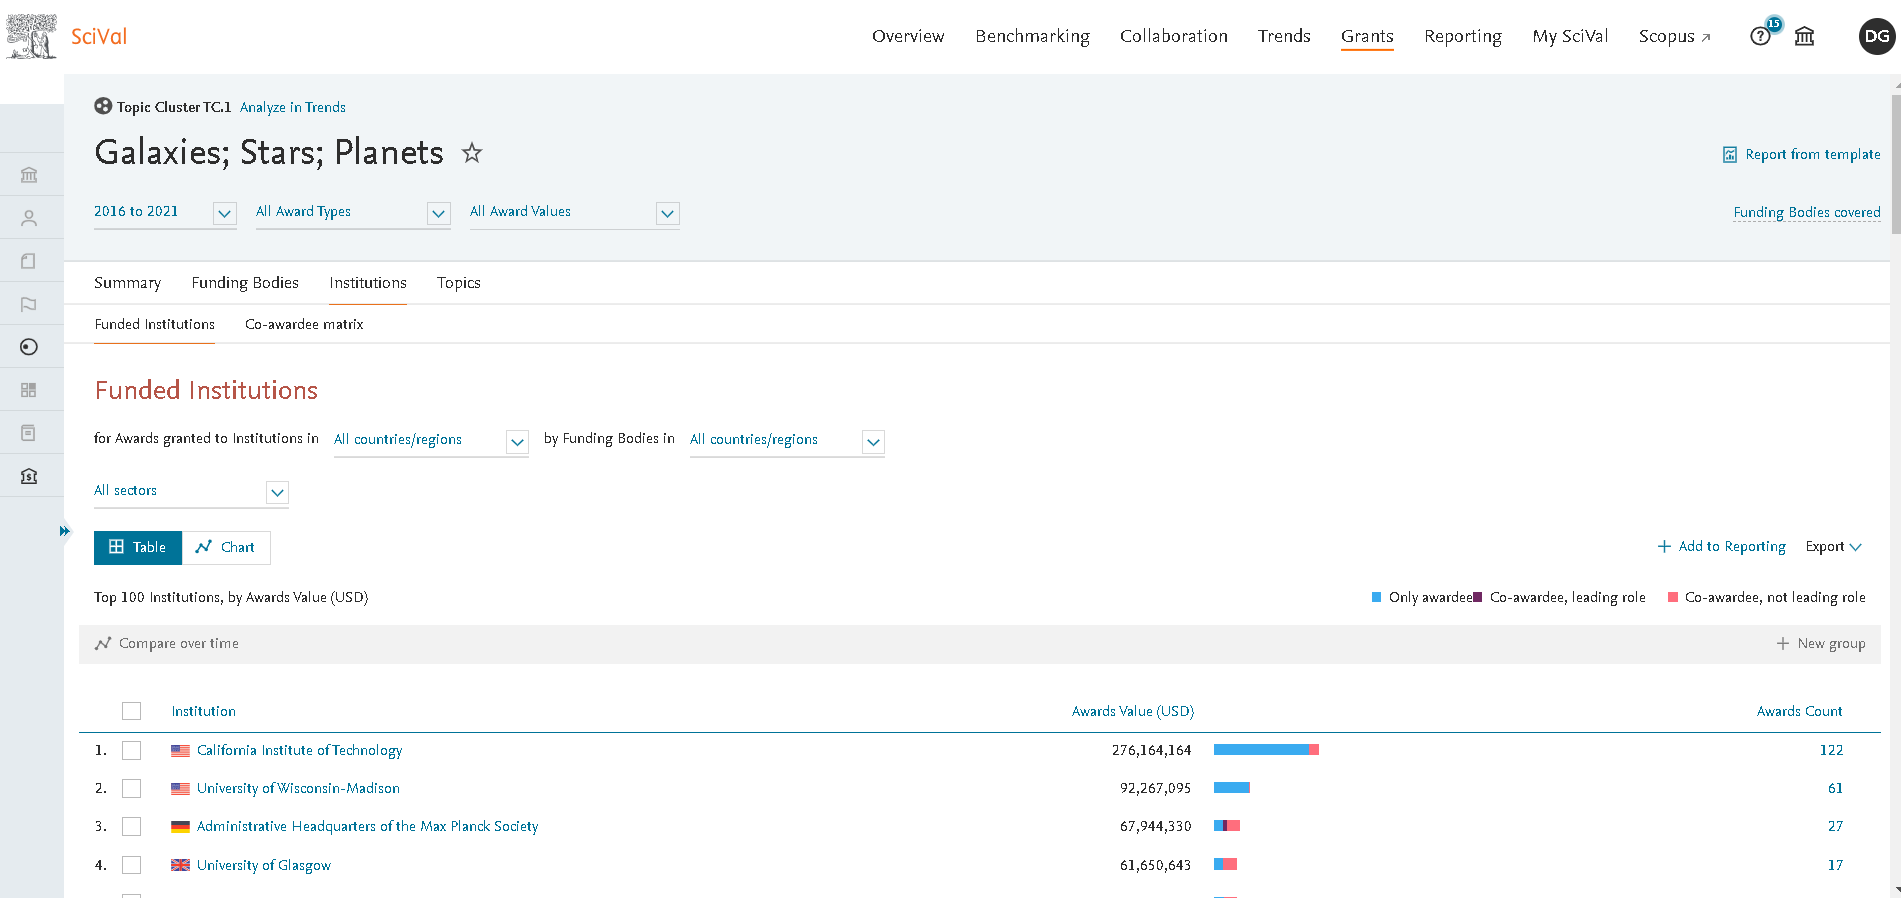
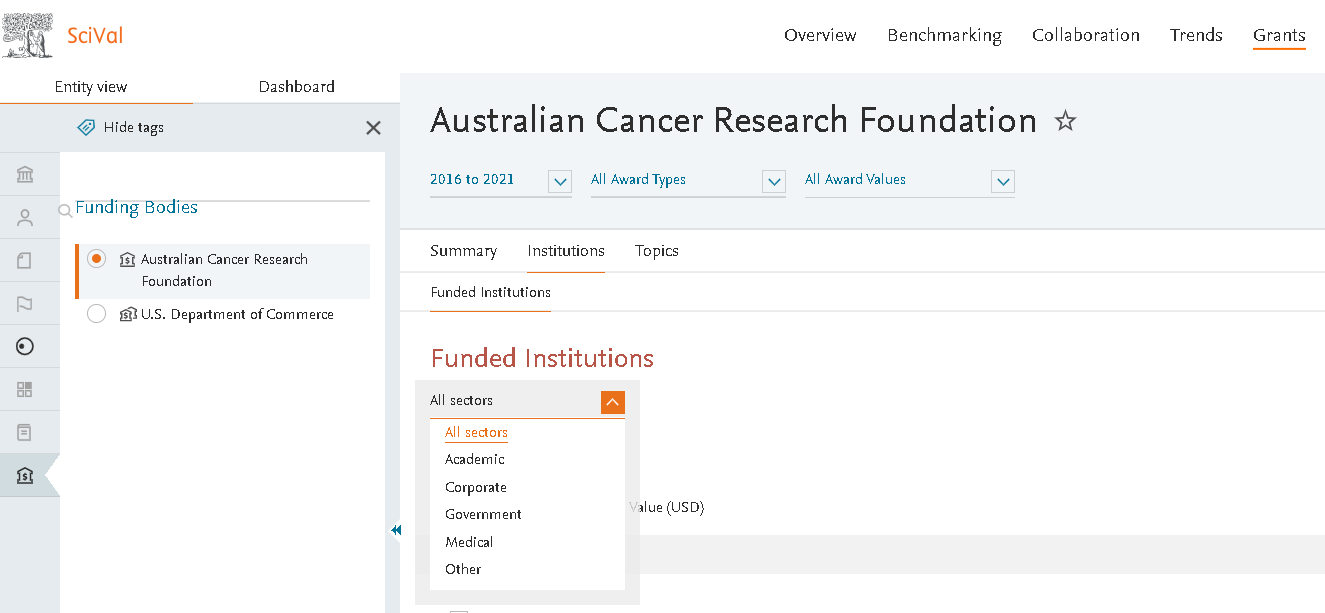
It is now also possible to filter on Institutions by sector in various places throughout the Grants module.
Other release items:
- Enhanced file names for publication exports: The file names will now reflect the entity viewed and the selected filters, making it easier to find the file you are looking for in your downloads.
- Improved filtering of search results on the entity selection panel: your search results from the panel will carry over into the “Advanced search” modal to help you filter down further.
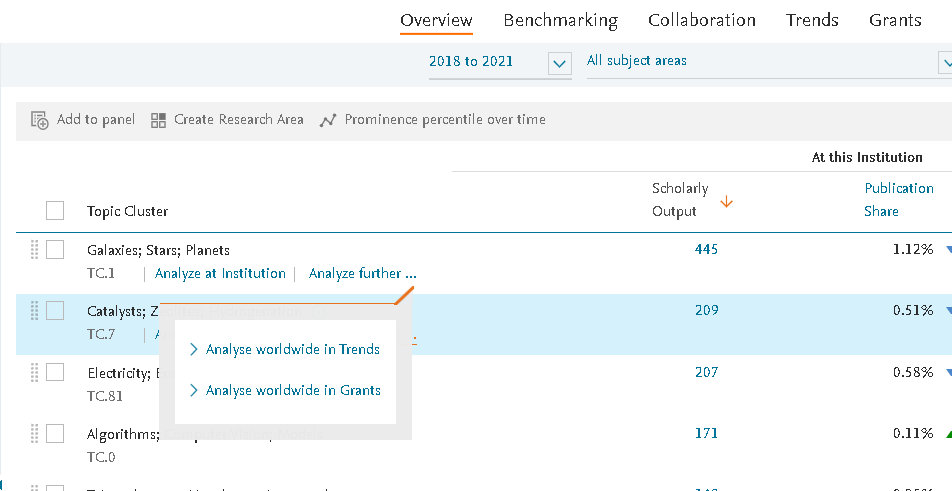
- For subscribers to the Grants module, a new shortcut is available for Topics and Topic Cluster listings in the Overview module, to enable deeper analysis of the funding landscape in your Topic of interest.
With the April 2022 release, we would like to encourage you to be aware of your personal Carbon footprint. Understanding the impact of your behaviour - from travelling to the energy you use at home - is an important first step when it comes to assessing how you can help tackle climate change.
The Carbon release will be split in 2 phases. The April 26 release brings the ability to export the full publication date, easily filter on your home institution for Research Areas, increased transparency for Top Citation metric thresholds and several enhancements to the Grants module. The second release, coming soon, will introduce the THE Impact Rankings to the Rankings analysis in the Overview module.
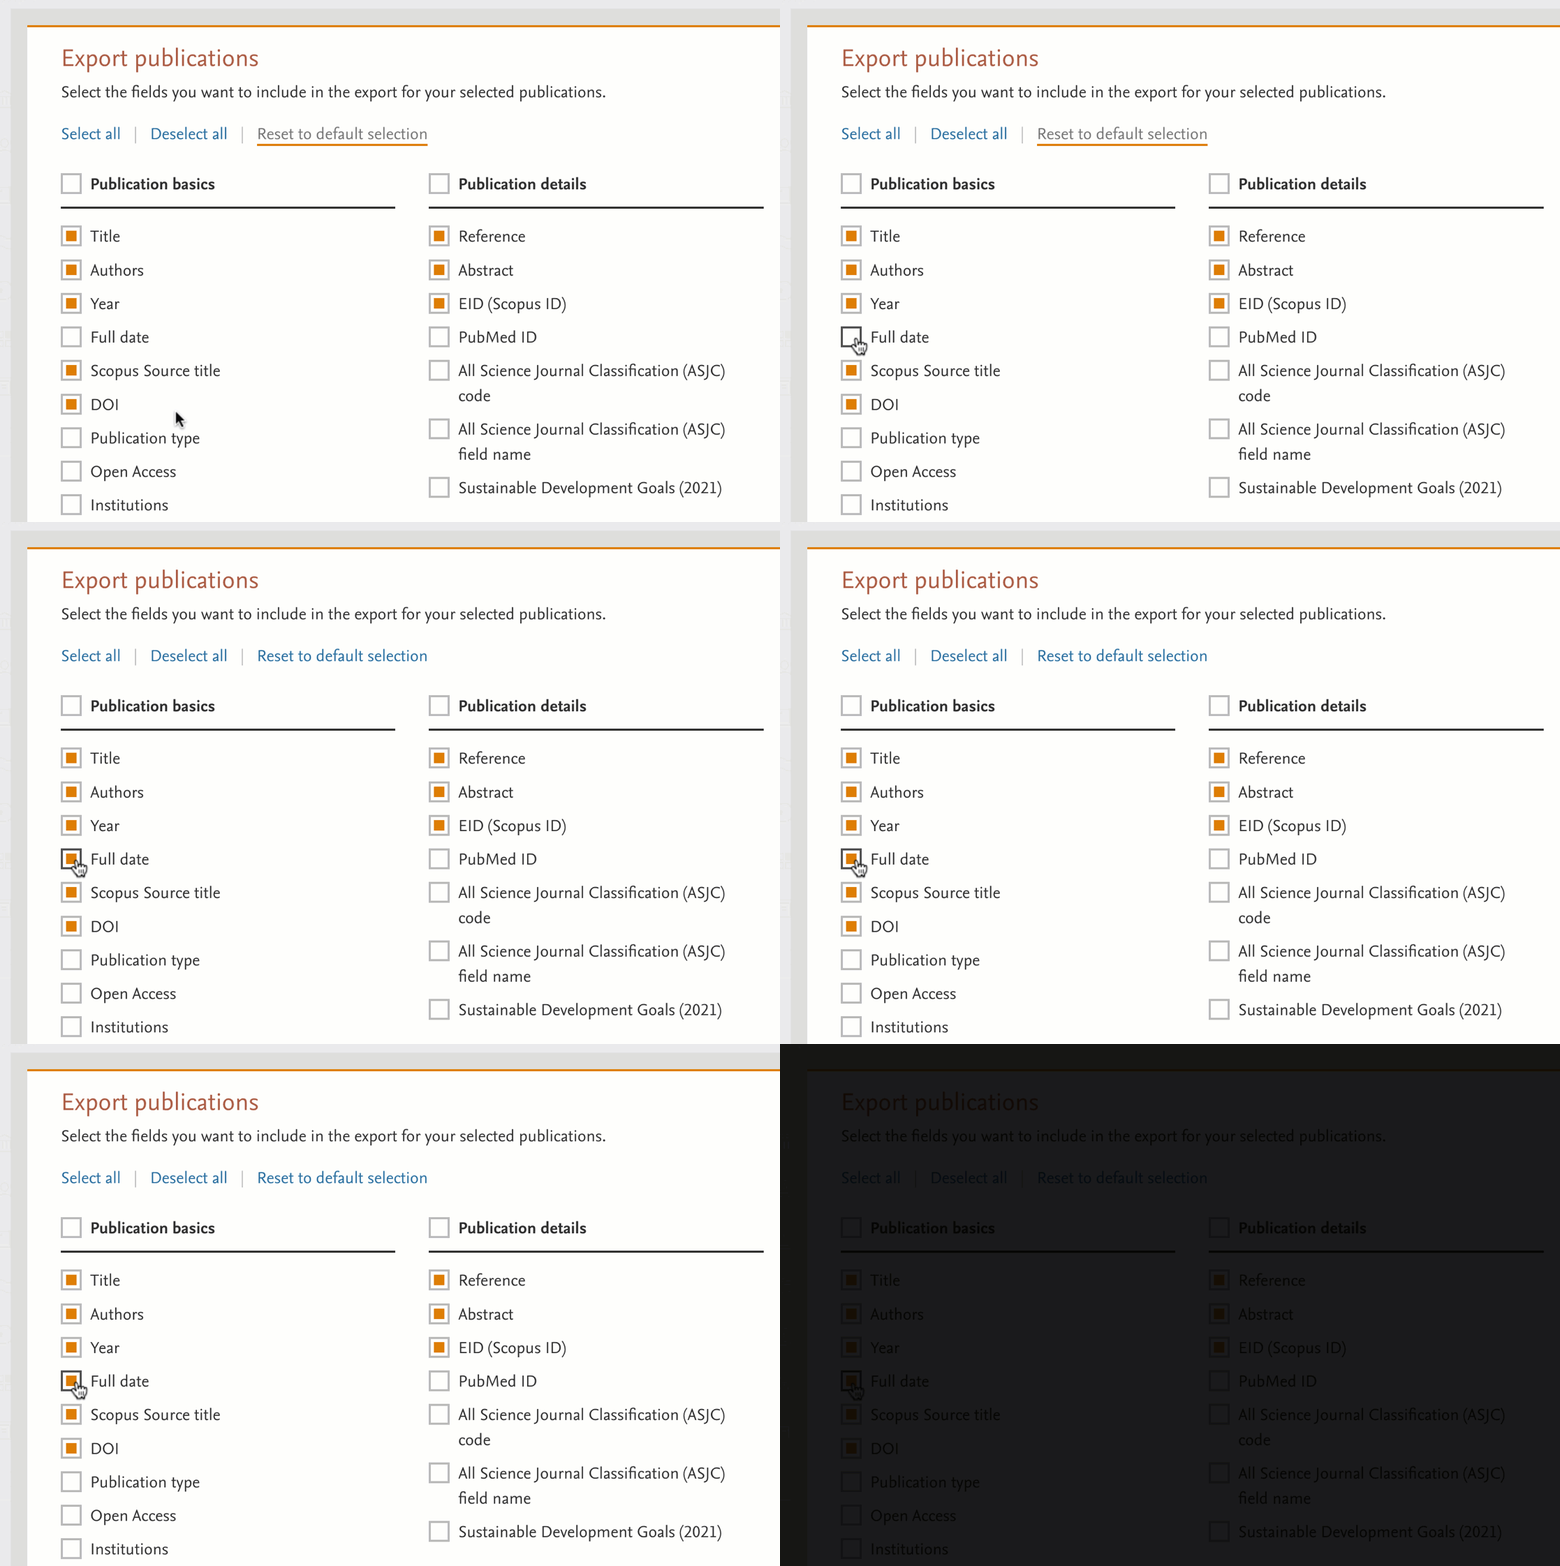
- Export the full publication date of documents for more granular analyses
The new field in the export modal allows you to retrieve the full publication date (day, month, and year) for your documents of interest. This enables you to track performance over time with more precision and allows for more granular analyses and reports on publications within a specific timeframe.
- Filter any Research Area on your home institution
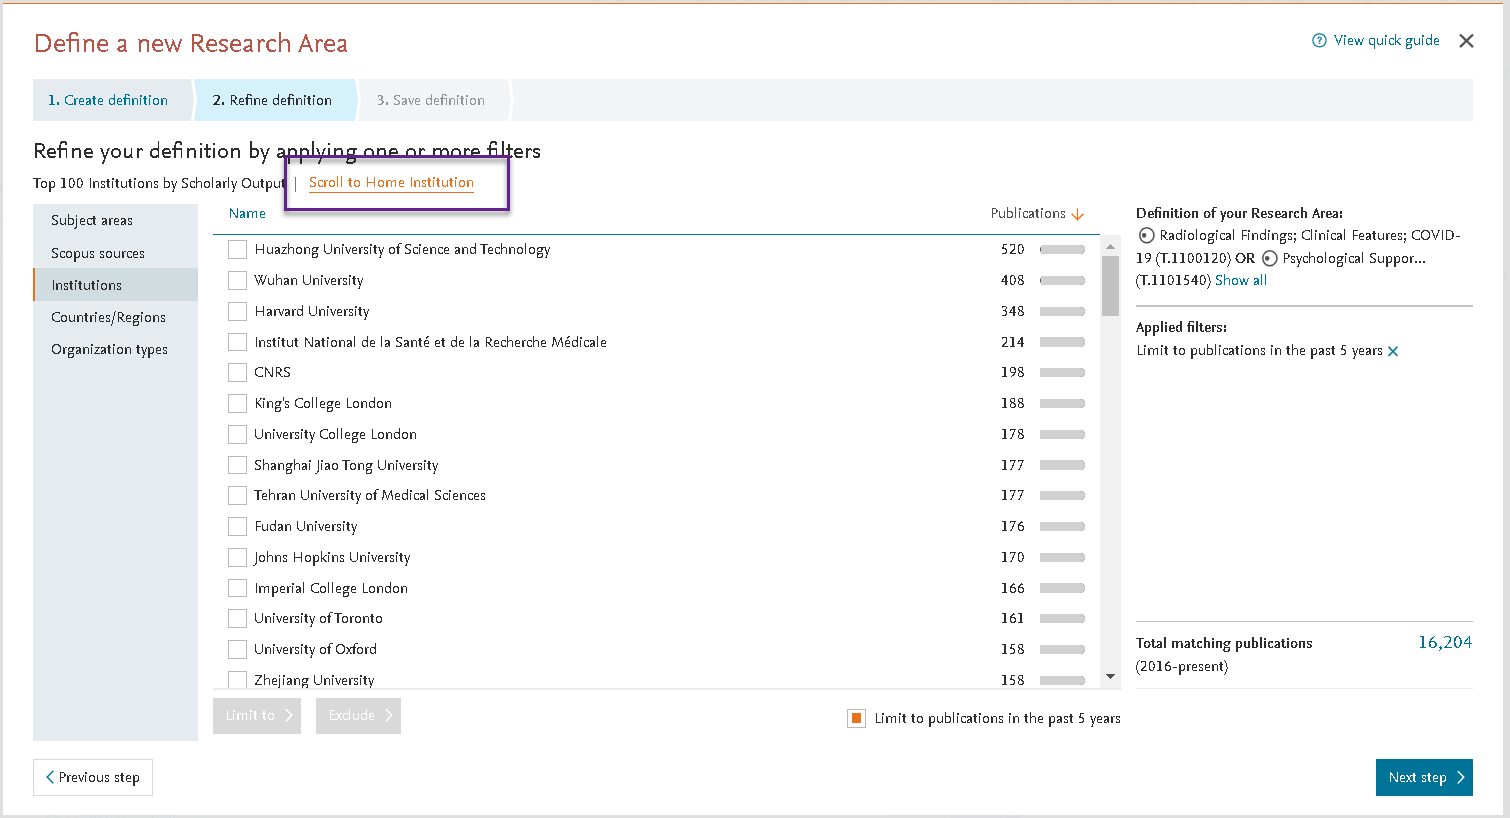
With the new "Scroll to Home Institution" link in the define Research Area flow, you can now easily find your Home Institution, even if it is not listed in the Top 100 by Scholarly Output, as long as your institution has published in the field of research. This allows you to create custom Research Areas more easily and monitor your institution’s performance in any field of interest.
- Increased transparency on Outputs in Top Citation Percentile and Top Views Percentile metric thresholds
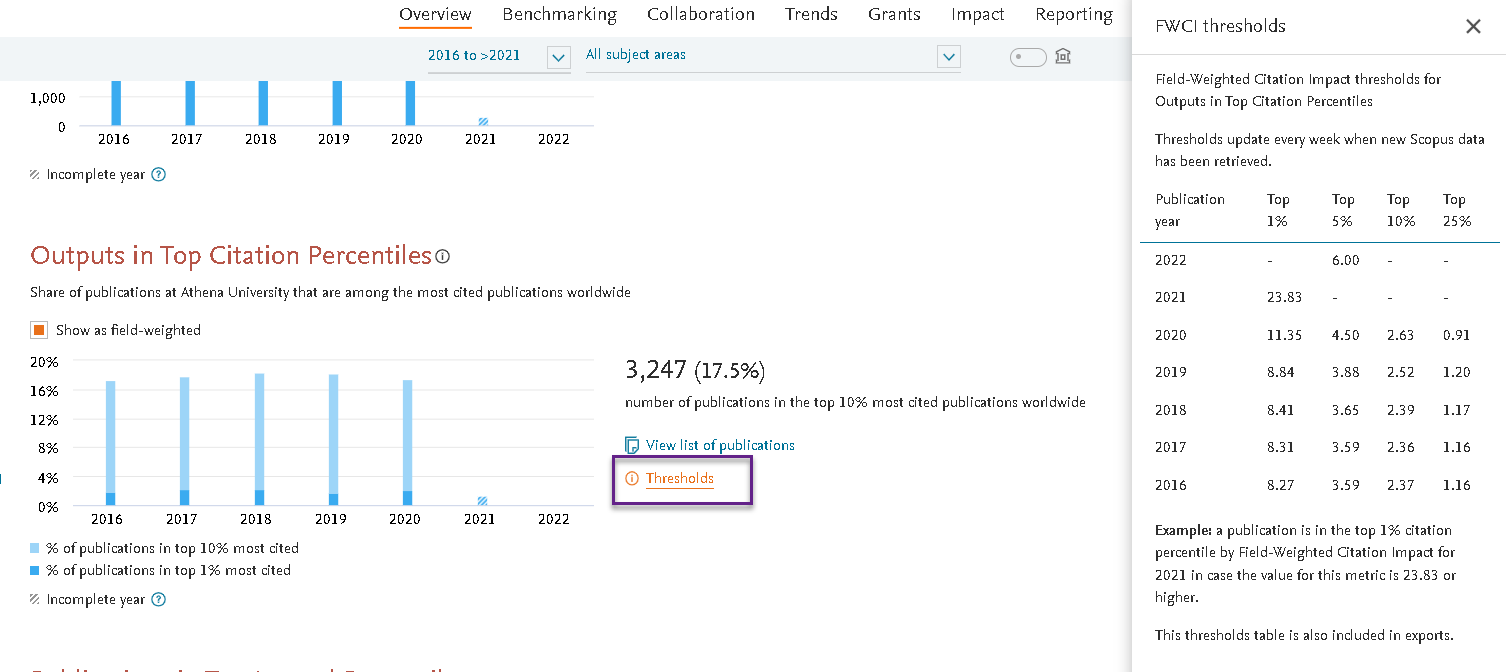
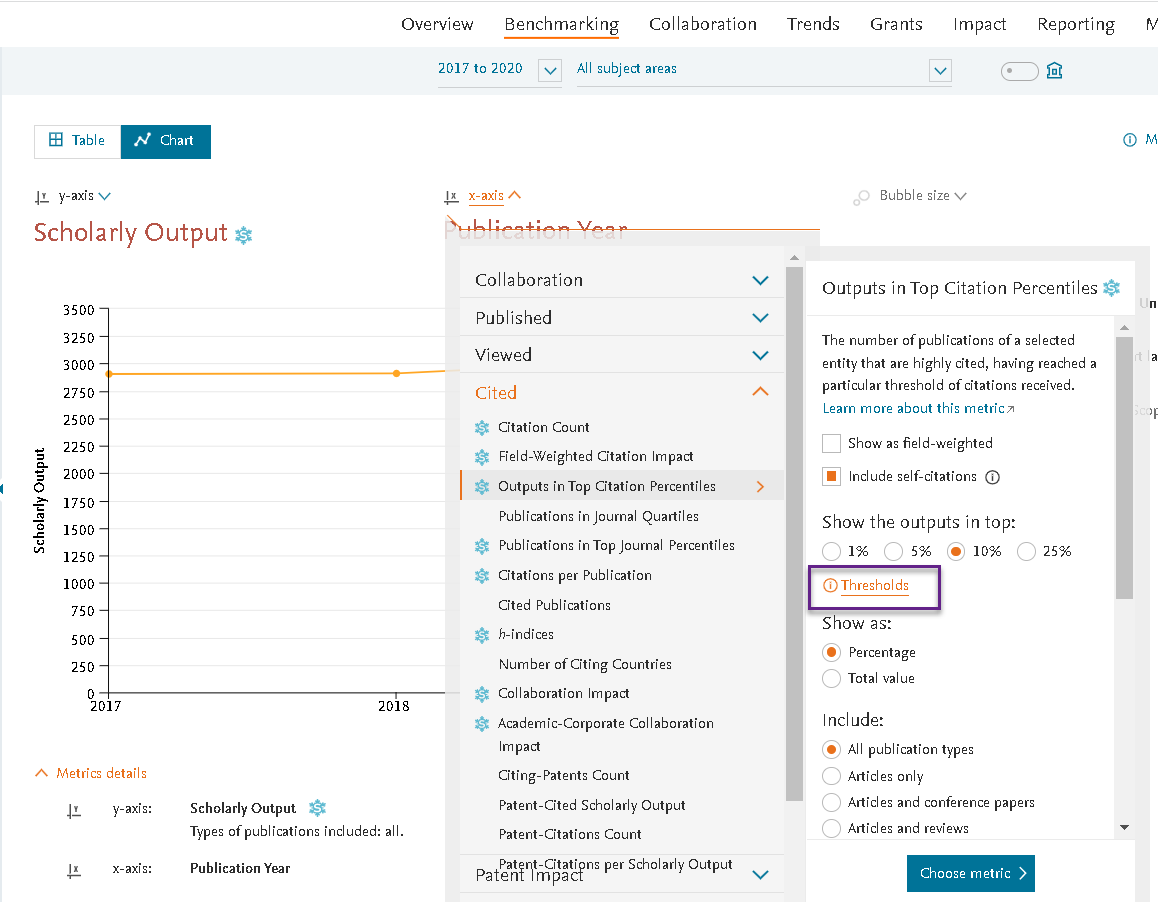
The new fly-in panels, which can be accessed from the Overview, Benchmarking and Trends modules, provide increased transparency on the thresholds used to calculate the Top Percentile metrics. You can view the thresholds for both the standard and field-weighted options. They are also included in the export file for easy reference.
- Increased transparency on Institution profile updates
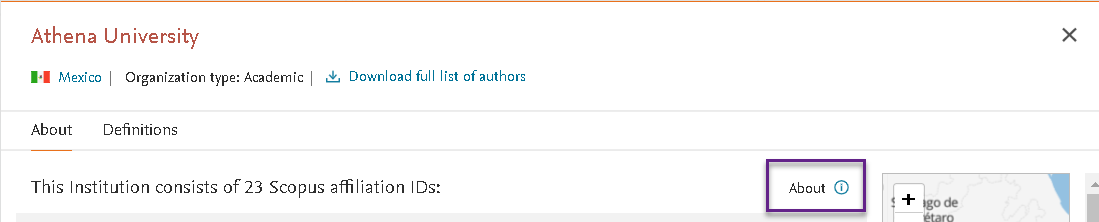
If there have been changes to the definition of an Institution profile in the past year, the new link in the Institution details modal provides increased transparency and details on any updates and corrections. The details include the date of the most recent changes, an overview of any affiliations added or removed as well as the option to export the details.
- New FWCI publication sort option
You can now sort the documents in the publications modal by FWCI, as well as citation count and year. This lets you order the publications using a normalised citation metric, to see the ones with the most citation impact.
- New labels for Societal and Economic Impact tabs in the Overview module
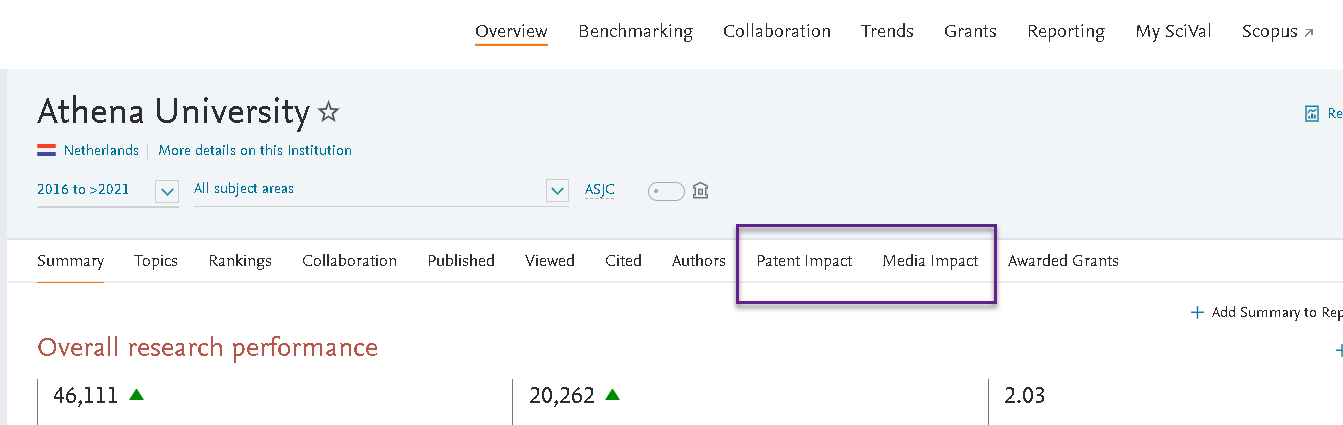
The Economic Impact and Societal Impact tabs in the Overview module have been renamed to "Patent Impact” and “Media Impact" to better reflect the information that can be found in each section. The new names also reflect in the metrics selector in Benchmarking.
- Updated Fields of Research (FoR) subject area classification
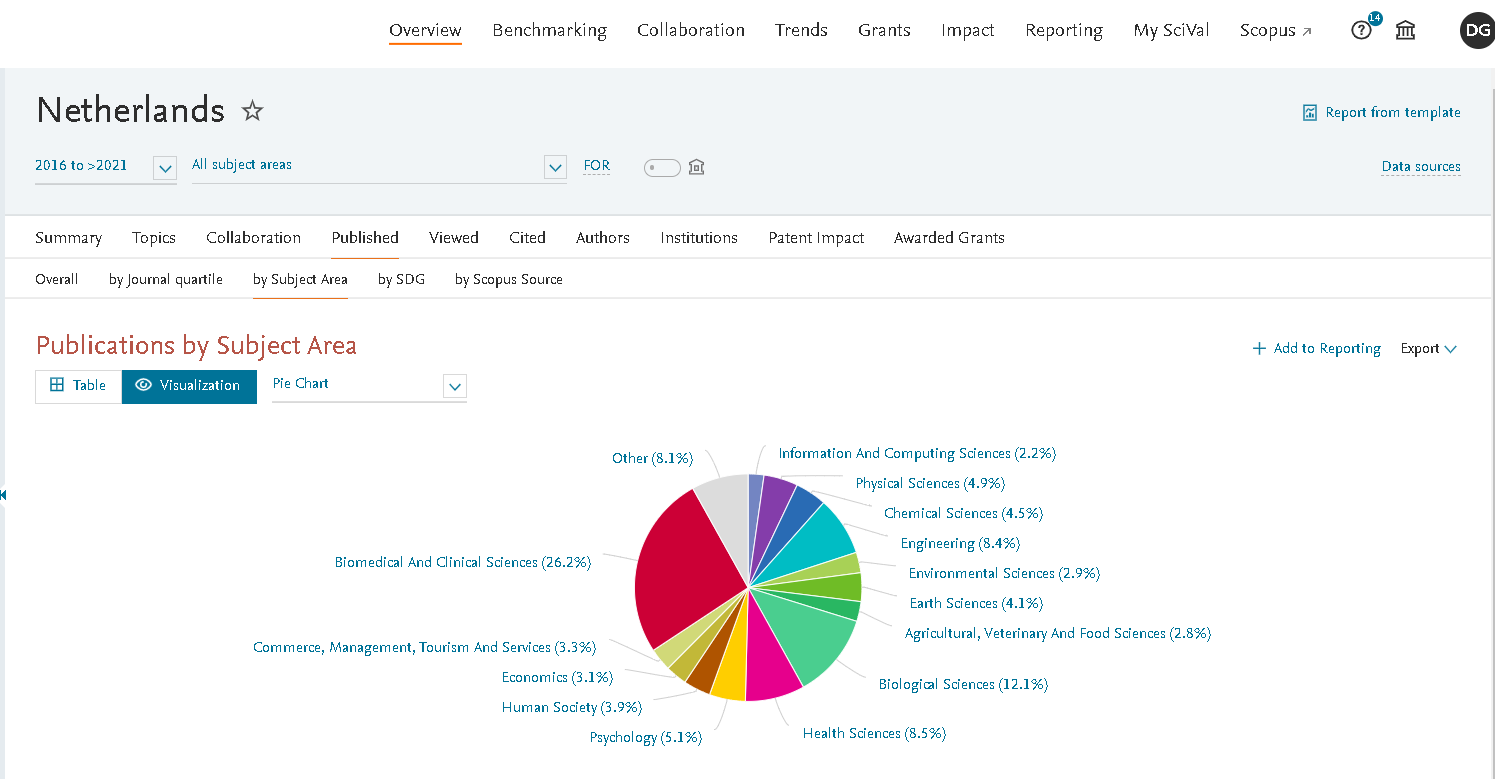
We have updated the Fields of Research (FOR) classification, which is part of the Australian and New Zealand Standard Research Classification, to the newest version (FoR 2020), providing you with the latest subject categories for your analysis. Learn more about the new mappingopens in new tab/window along with the conversion of the reports with the old mapping to the new mapping.
- Get a balanced overview of the funding landscape for a Topic with the new Topic Grants report template
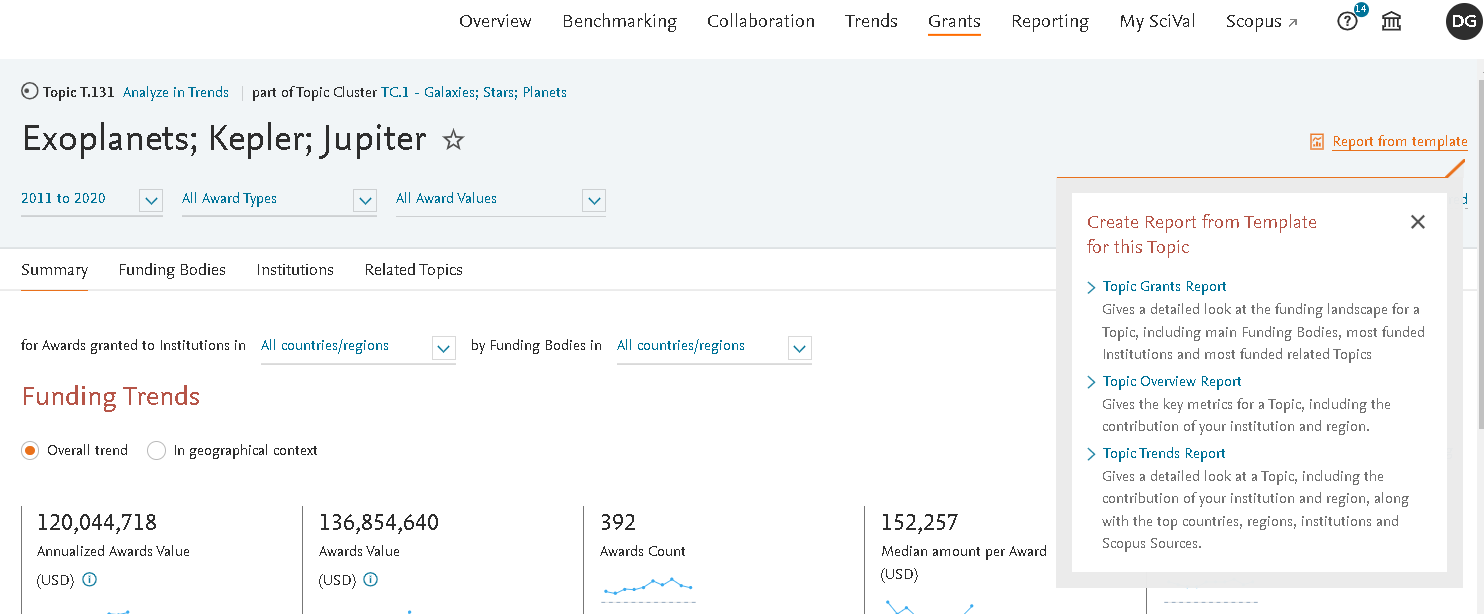
A new Grants report template is now available for Topics, Topic Clusters and Topic Groups, providing a balanced overview of the funding landscape for your research fields of interest. The template includes summaries of the main Funding Bodies, as well as the Institutions and related Topics with the highest funding levels. The link to the report template is available for Grants subscribers on the Topics pages in the Grants and Trends modules.
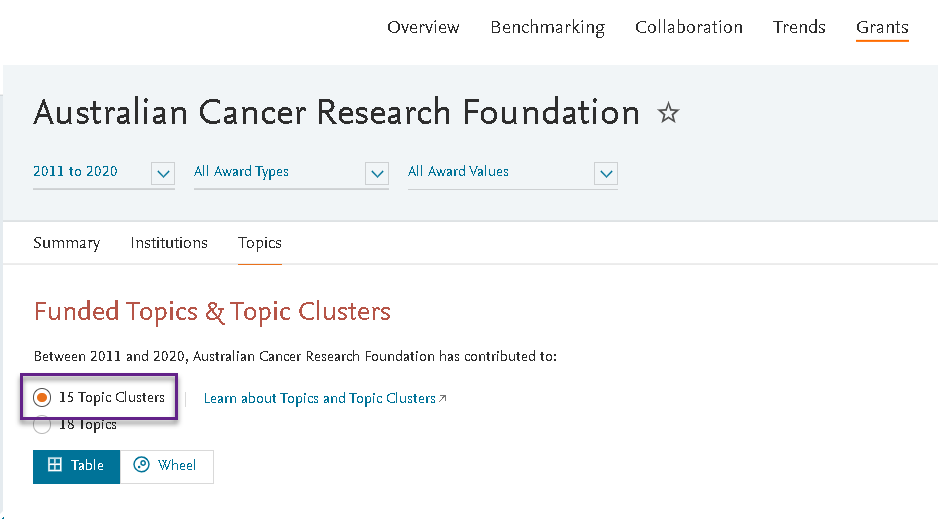
- Funded Topic Clusters for Funding bodies in SciVal Grants
It is now possible to view the Topic Clusters that a Funding Body has contributed funding in, allowing for a high-level analysis of research focus areas per funding body.
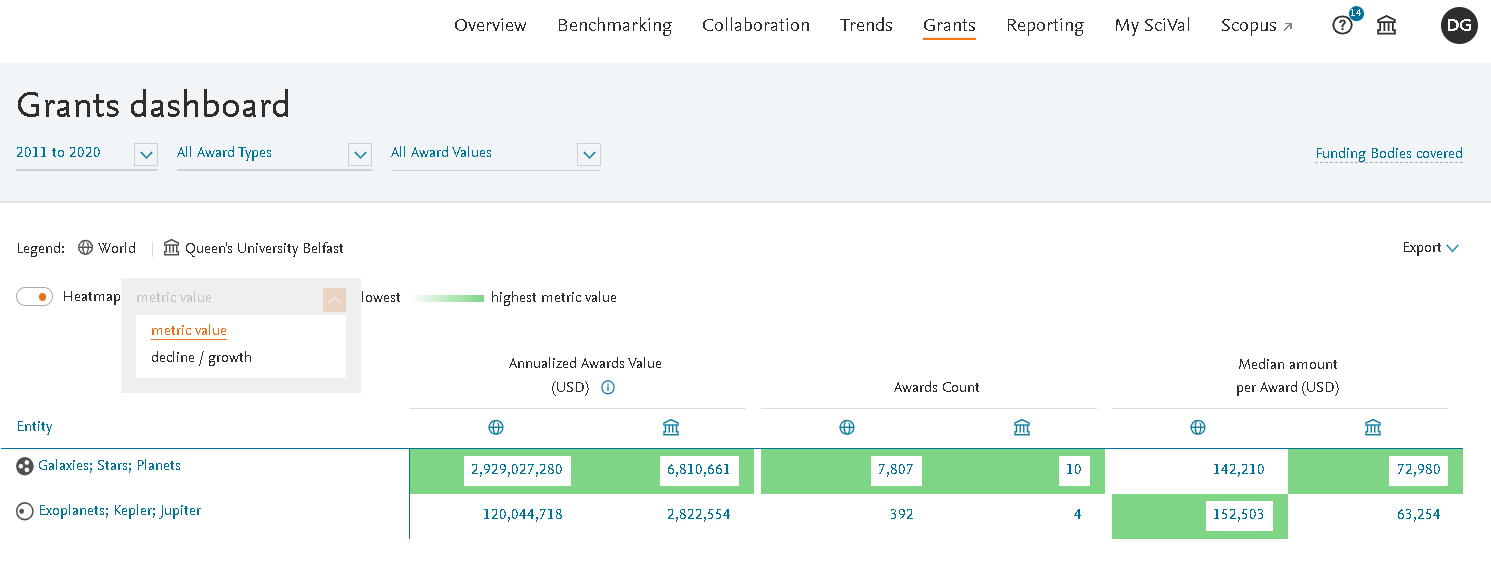
- Enhanced heatmap option and export from SciVal Grants Dashboard
You can now choose "metric value", in addition to growth and decline, for the heatmap visualization in the Grants Dashboard. We have also added an export option to the Dashboard.
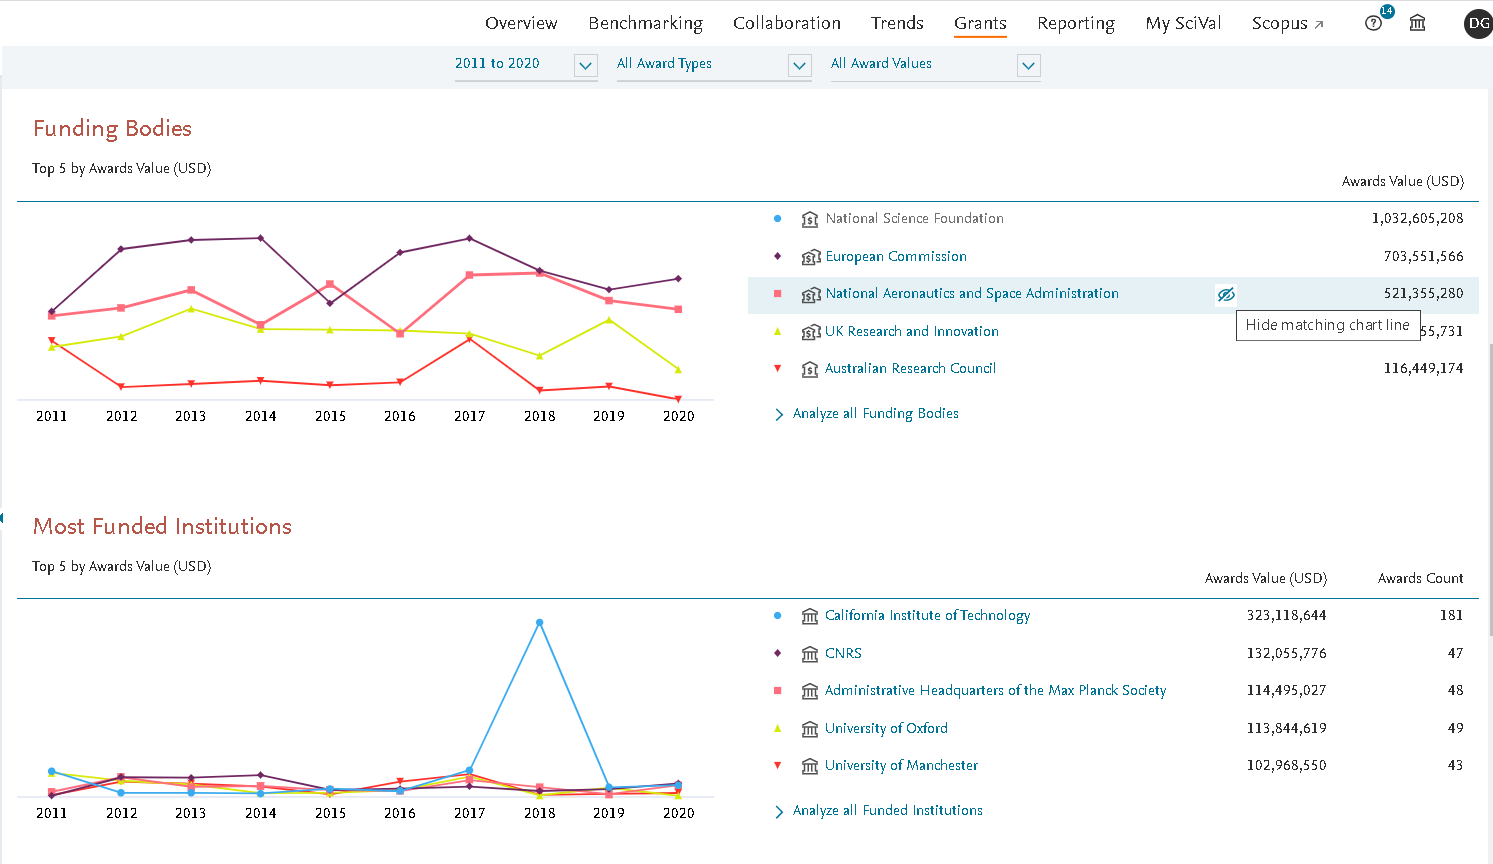
- Enhanced charts for Funding bodies and most funded Institutions in SciVal Grants
Hide funding bodies and institutions from the charts to focus your analyses specifically on the ones of interest.
Additional release items:
- We have changed the way we identify the primary affiliation displayed for authors. This information is now taken directly from the Scopus Author Profiles pages, creating consistency between the 2 products.
- The "Publications with datasets indexed in Data Monitor" Research Area has been updated with publications up to March 13, 2022.
The March 2022 release is dedicated to the Bike. Studies have shown that choosing a bike over a car just once a day contributes significantly to the reduction of an average citizen's carbon emissions from transport. Mobility is also considered an essential element of development strategies to achieve the Sustainable Development Goals (SDGs). Cycling can be linked to several SDGs: besides decarbonizing transport, it is a sustainable and affordable mode of transport, enabling access to education, jobs, or food markets, as well as contributing to good health. Let's cycle towards the goals!
The Bike release brings you additional options for merging Publication Sets, the ability to export the full list of authors from any institution, and an expanded export functionality of filter options in the publication modal.
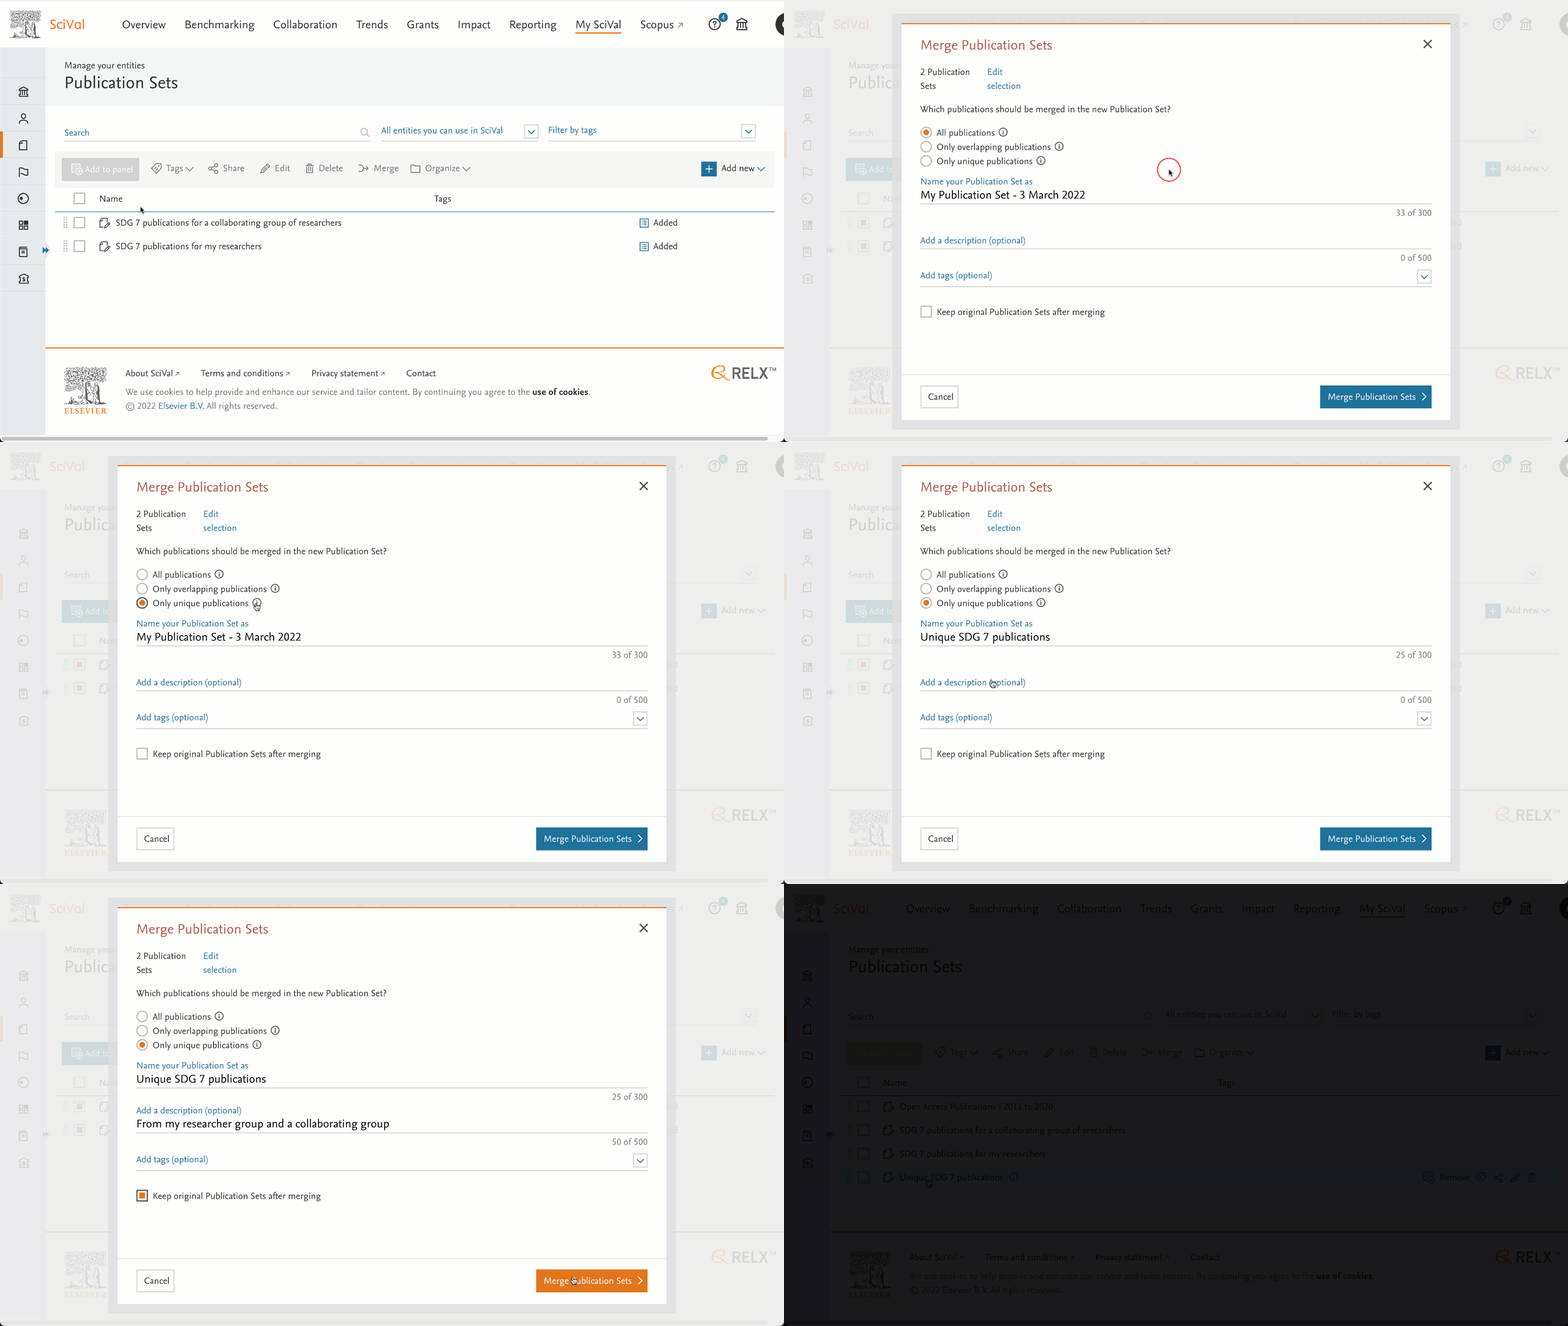
- Easily create more custom Publication Sets with additional options for merging Publication Sets in My SciVal
There are now two new options for merging your Publications Sets.
- Merge publications that are overlapping in the original Publication Sets, or
- Merge publications that are unique in the original Publication Sets.
The option to merge all publications remains available and you can choose to remove or keep the original Publication Sets after merging.
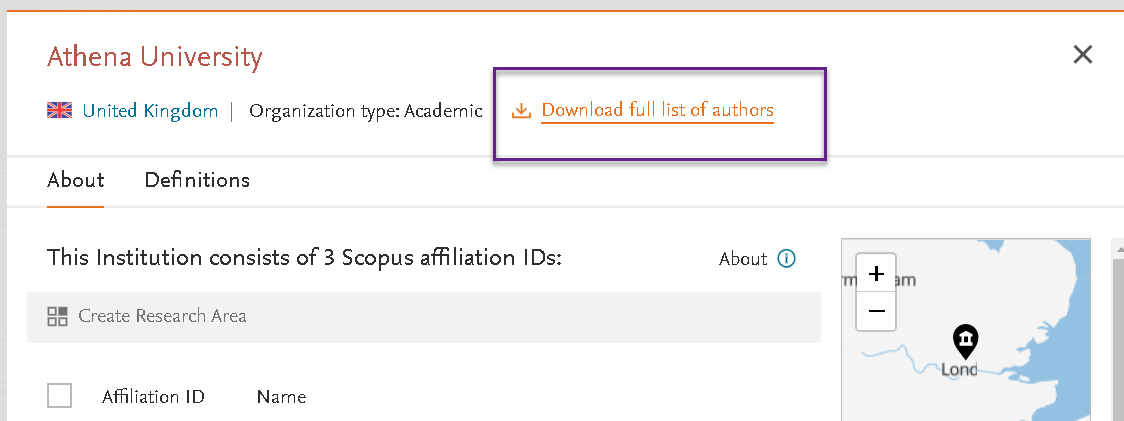
- Export the full list of authors from any institution
The November 2021 release introduced the option to download the full list of authors for your Home Institution along with an array of 6 metrics. This export option has now been made available for every institution in SciVal, allowing you to select any institution you are interested in and download their authors list to identify potential candidates for collaboration or hiring.
The export option can be found in the Overview module Authors tab, as well as in the Institution details modal and will provide you with a list of authors who have published at the institution between 2011 to present.
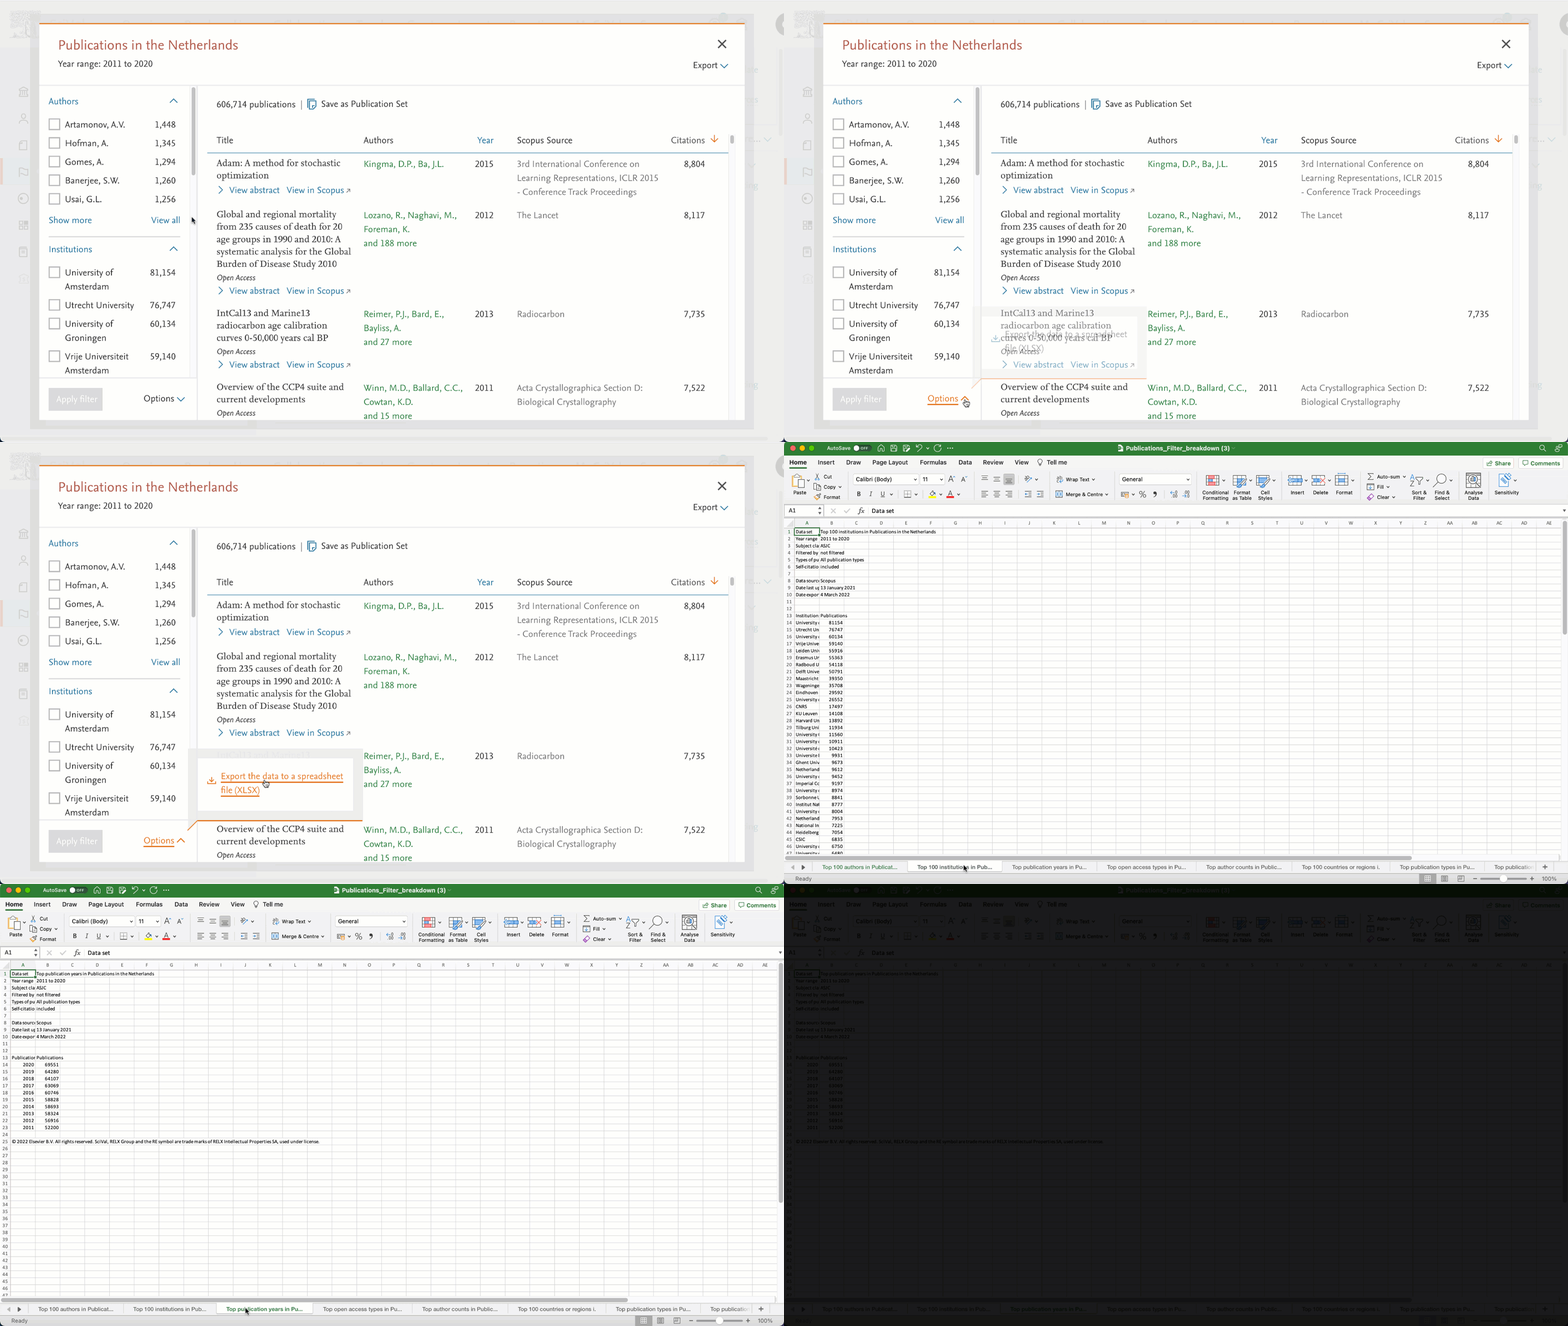
- Expanded export functionality of filter options in the publication modal
The new export option in publication modals allows you to export the top filters (up to 100) for every filter category into a single spreadsheet for further analysis. Simply click on “Options” at the bottom of the filters to download the spreadsheet, which will contain the breakdown for each filter category in a separate worksheet tab.
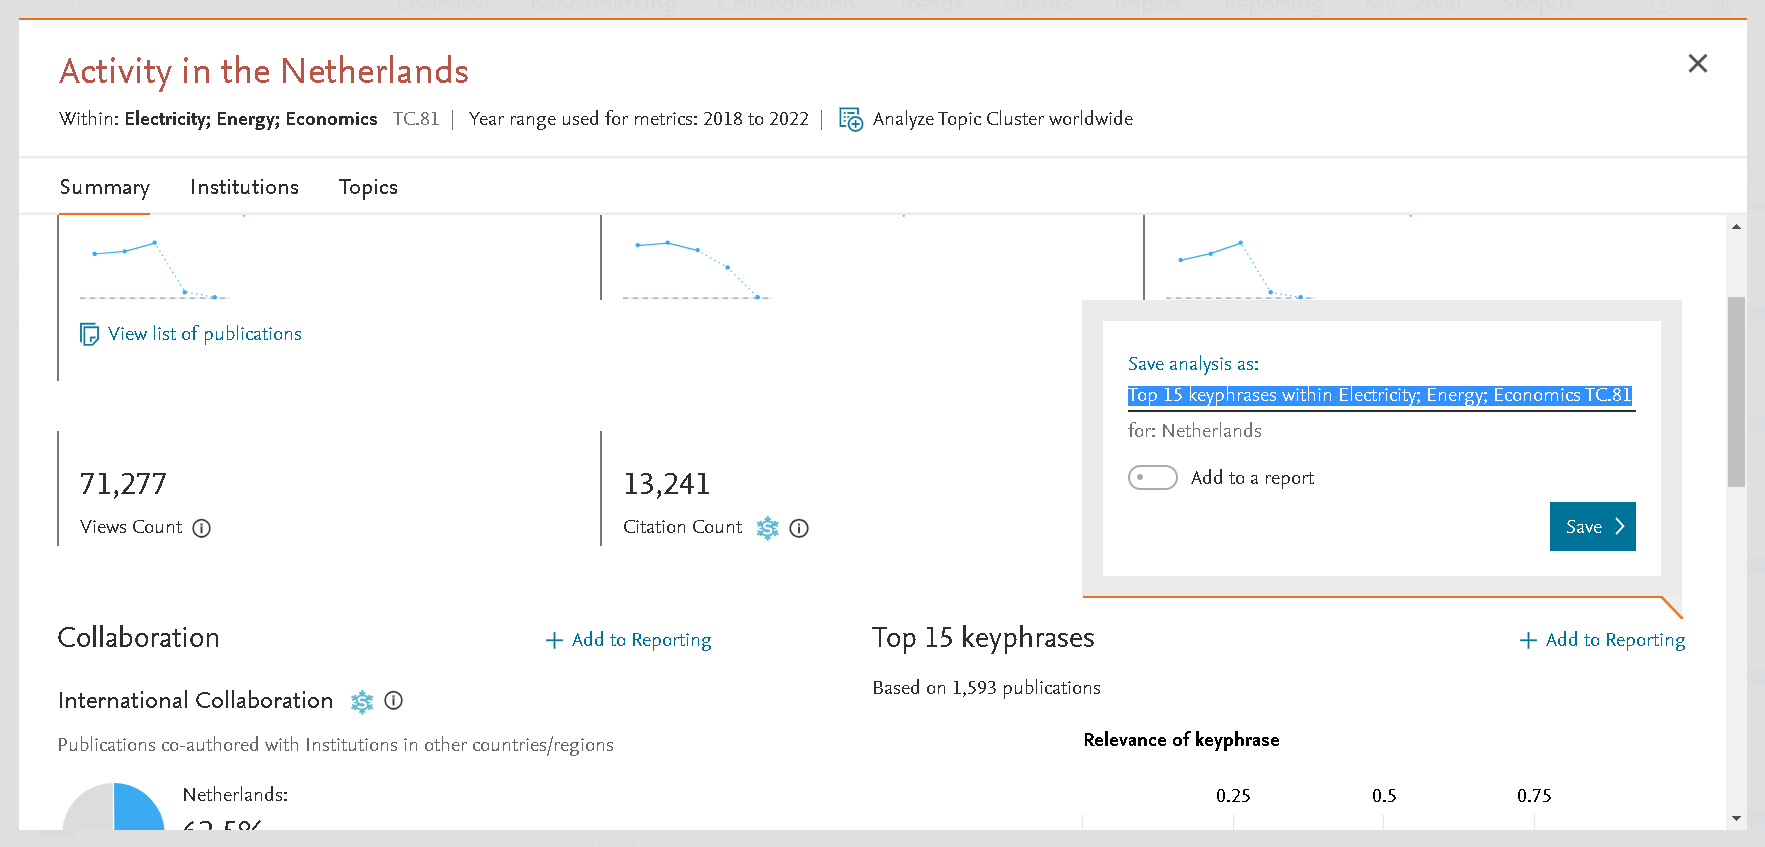
- Improved default naming of analyses when using Add to Reporting
When adding analyses to Reports from the activity modal for Topics, Topic Clusters or SDGs (2021), the default name of the analyses now provides more context by specifying the module section and the name of the respective Topic, Topic Cluster or SDG. This makes it easier to identify analyses within your Report or analyses library, reducing the need to manually rename them.
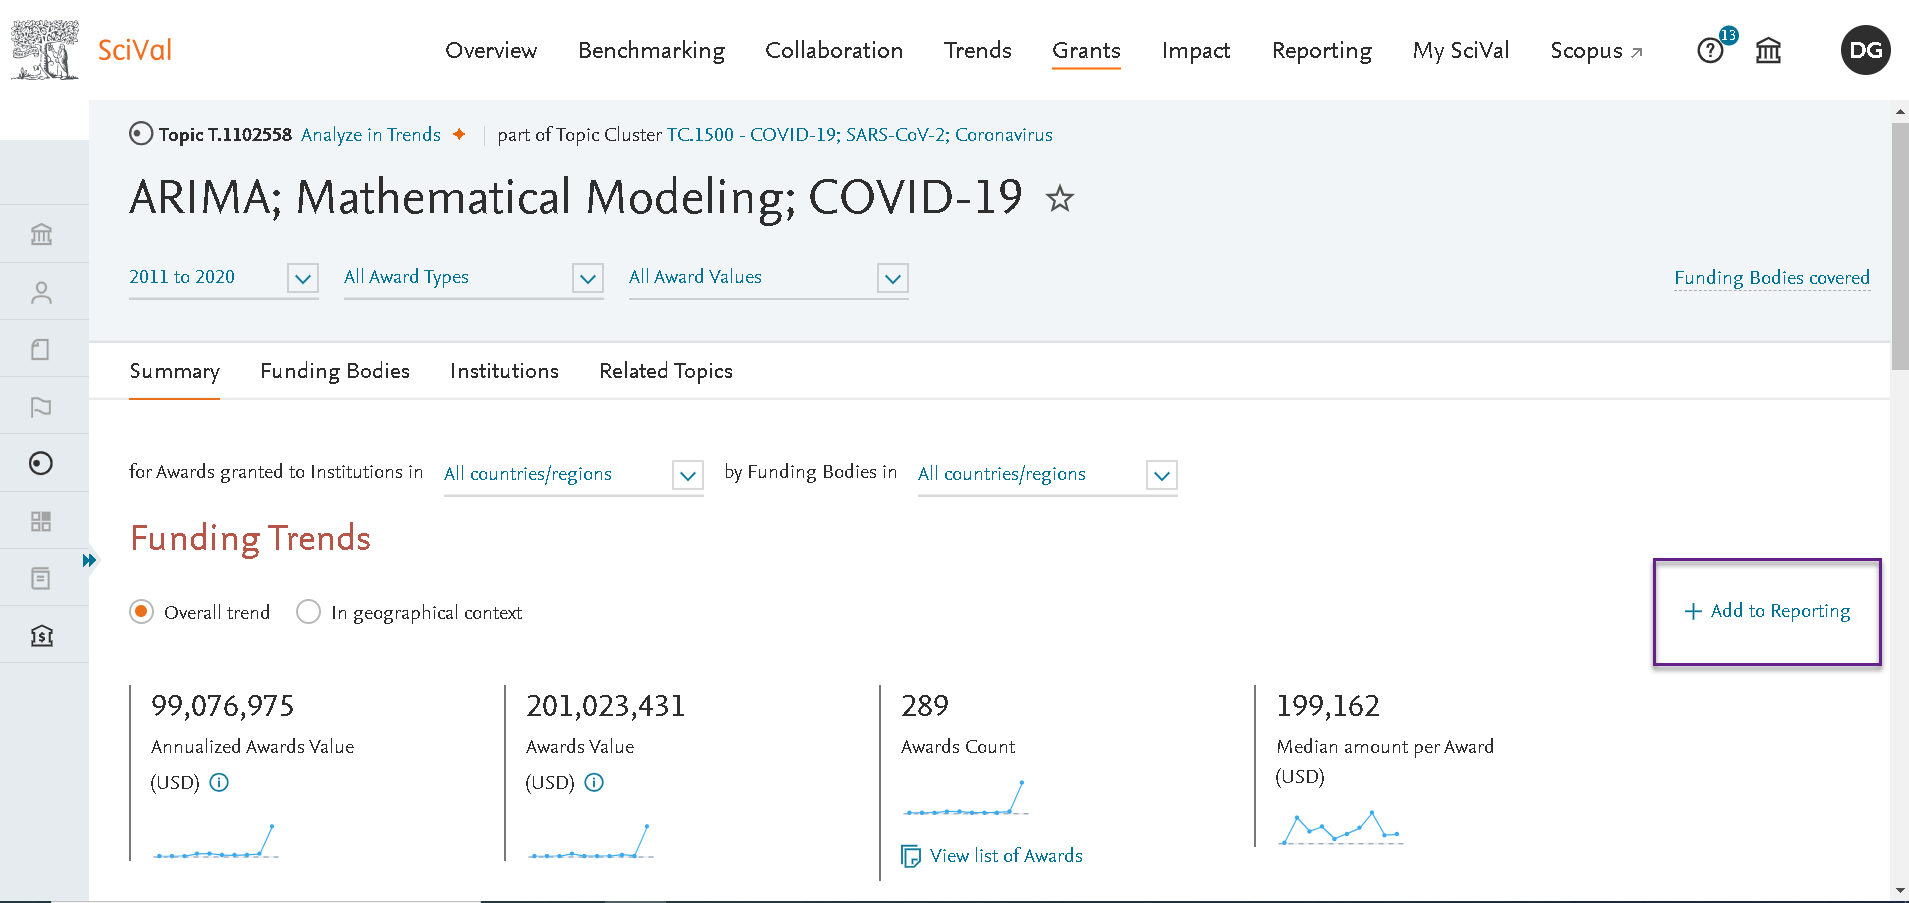
- Enhance your Reports with more analyses from the SciVal Grants module
You can now add additional analyses from the SciVal Grants module to your Reports. The option to “Add to Reporting” is now available in 9 places across the Grants module, including on all main pages as well as in a number of details modals.
- Improved Topic names
Topic names have now been updated based upon the latest version of the Elsevier Fingerprint Engine. For about 2/3 of the Topics, one Keyphrase has been updated to more accurately reflect the Topic. The full Topic download file has also been updated to reflect these changes.
New year – new release names: with climate change becoming an ever more pressing global issue and presenting one of the biggest challenges of our time, we are dedicating our release names to actions that can contribute to tackling climate change.
In that spirit, we are kicking off 2022 with the Take Action release, which brings you enhancements to the Topics scatterplot, the ability to filter publication results with more precision, and improved Topic names.
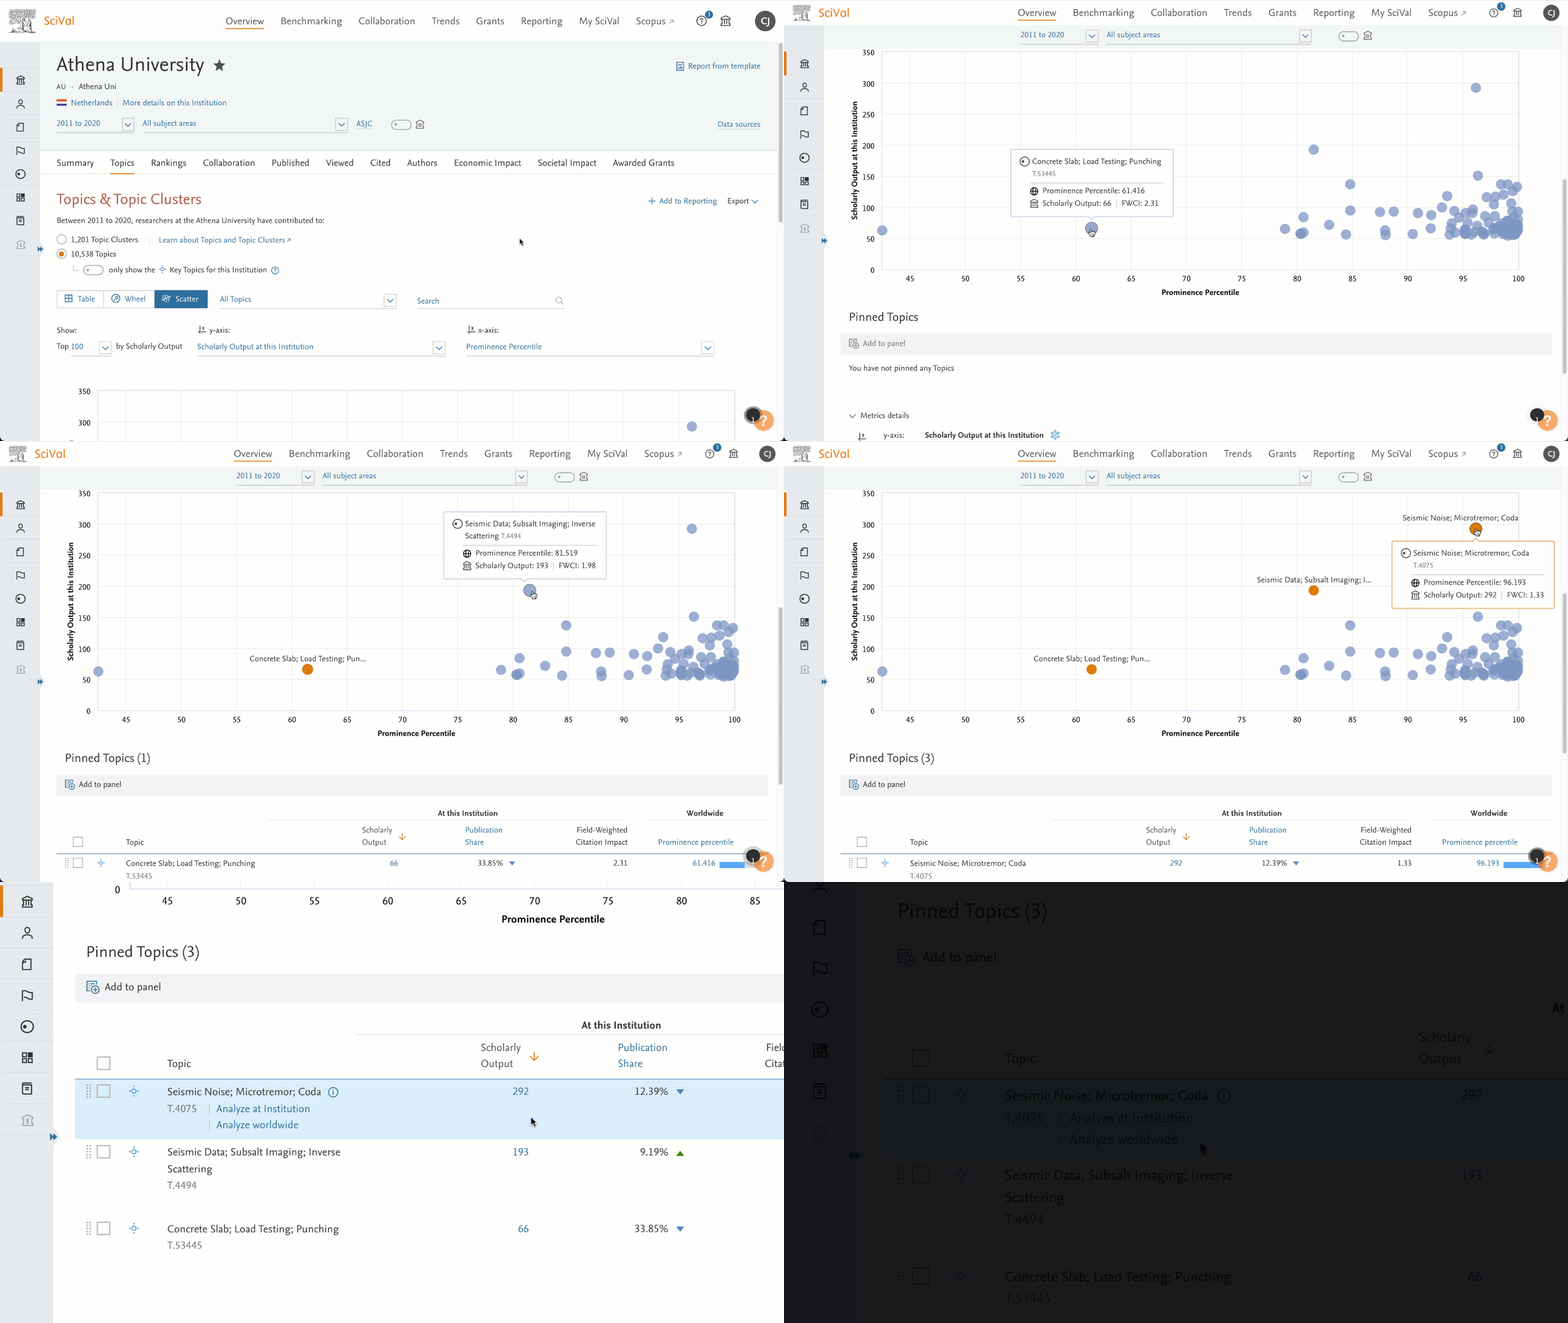
- Clearer comparison through pinning Topics and Topic Clusters on the scatter plot
Selecting Topics or Topic Clusters from the scatter plot will now pin them, along with a set of metrics, in a table underneath the scatter plot. This allows you to quickly enhance your comparison of those Topics and Topic Clusters. From the table, you can also select and add the pinned entities to your left-hand panel.
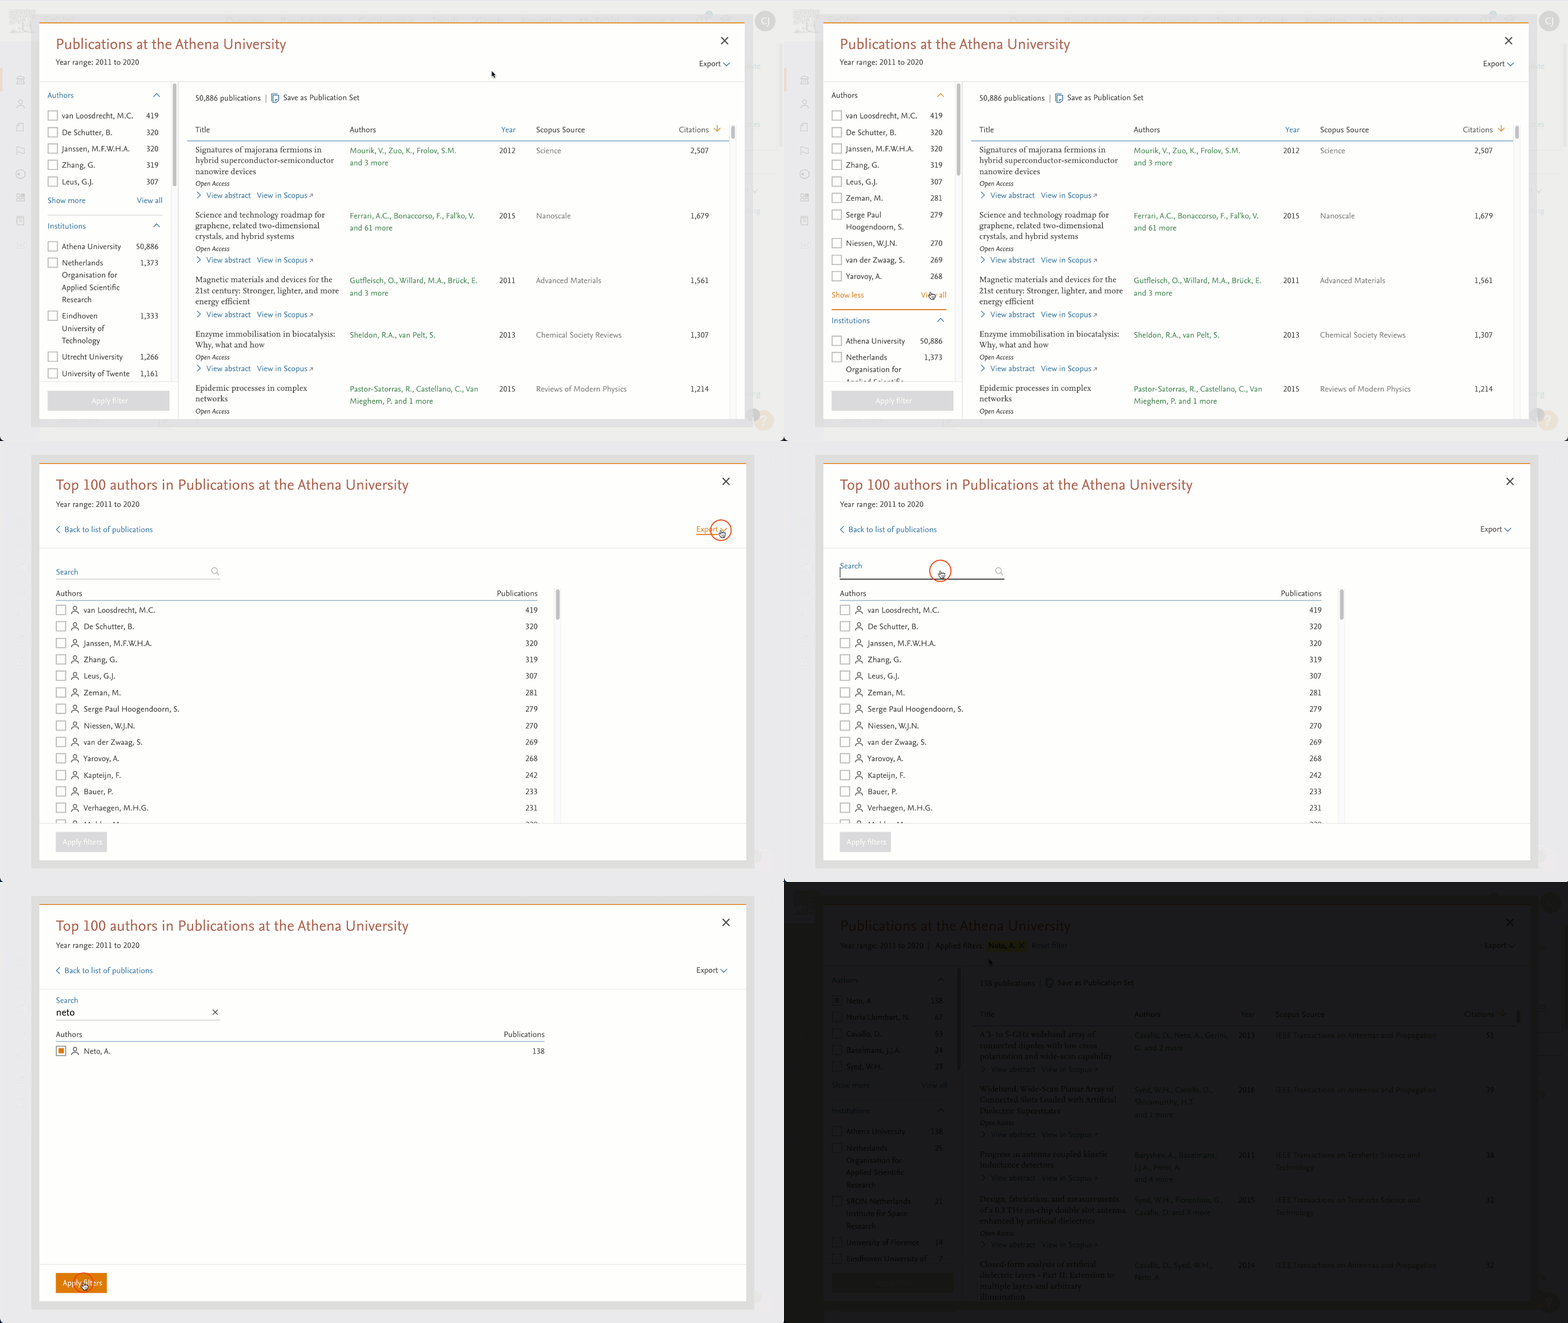
- Filter publication results with greater precision with the new search and export functionality in the publication modal
Filtering down a list of publications to find exactly what you need has now become easier with the new search option in the publication modal. Clicking the new “View all” option in a filter category shows you the available filters (up to 100), ordered by number of publications. You can then search to find the filter you need quickly. You can also export the list of filter options within the category as a csv for further analysis.
- Coming soon: Improved Topic names
We will update Topic names based on the latest version of the Elsevier Fingerprint Engine implemented in November 2021 shortly. For about 2/3 of the Topics, one of the Keyphrases constituting the name will be updated with a new Keyphrase that more accurately reflects the Topic – giving you a better understanding at first sight of the area of research that the Topic represents.
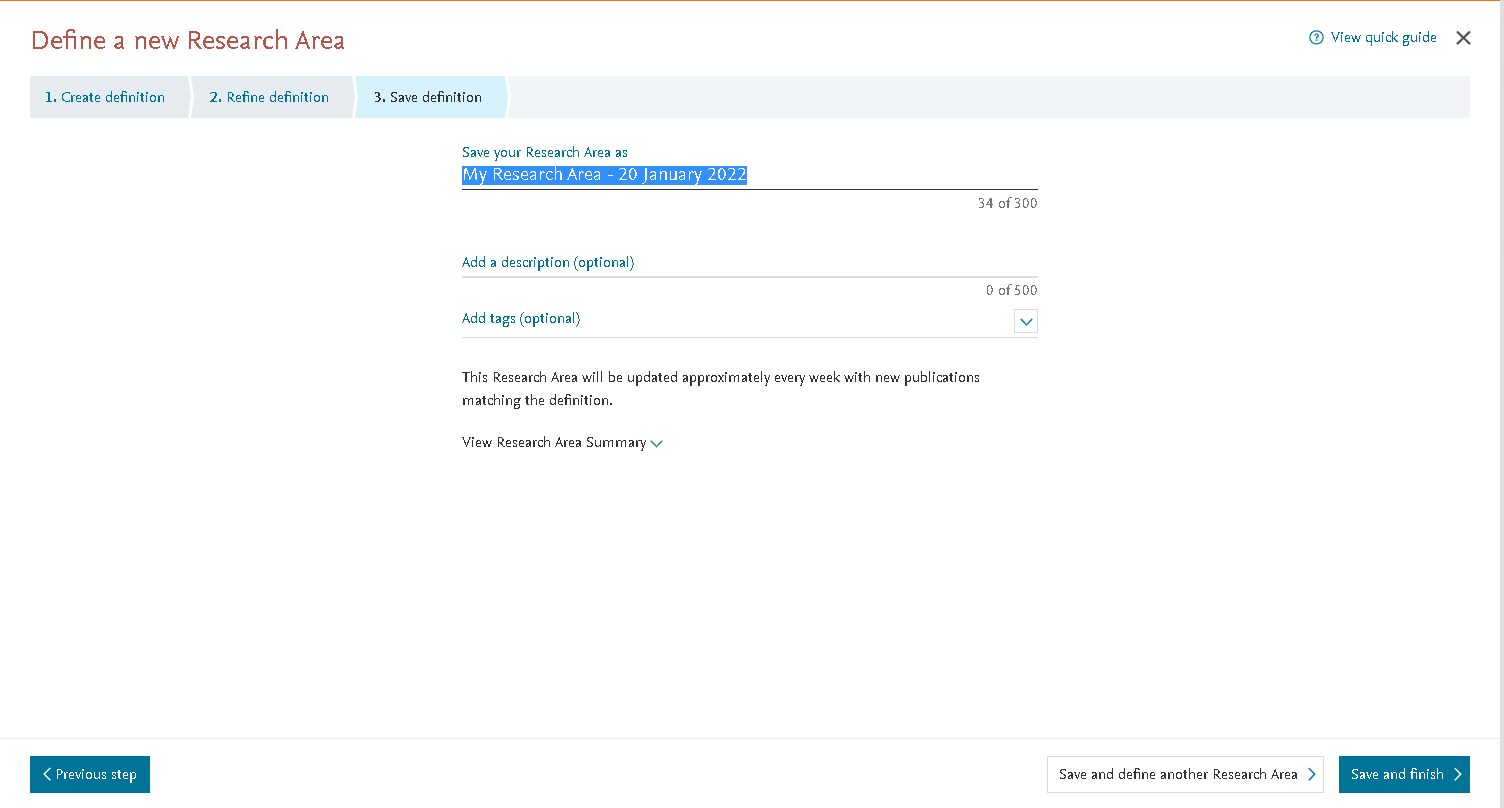
- Quicker customization of your defined entity names
When defining your own entities, such as Research Areas or Publication Sets, the default name in the last step of the define flow is now automatically selected, making it easier to delete and customize the name of your entity. This also applies to analyses you add to your Reports.
Other release items:
- The "Publications with datasets indexed in Data Monitor" Research Area has been updated to include publications up until 12 December 2021.
- A new shortcut at the top of a shared Reports gives you quick access to the Sharing modal to see who the Report has been shared with, or who has shared it with you.
2021 release highlights
Get a highlight of SciVal’s most notable release items for 2021 in a 21 minute video, including:
- The new Rankings tab for the THE WUR
- Grants module
- 112 new Topics and 1 COVID-19 Topic Cluster
- Enhanced help and metrics guidance
- 2021 SDGs
- Reporting enhancements
- New visualizations (SDGs, Scatterplots, heatmaps, Prominence percentile over time)
- New Curated Research Areas
- Improved homepage
2020 release highlights
Get a highlight of SciVal’s most notable release items for 2020 in a 15 minute videoopens in new tab/window, including:
- Redesigned homepage
- Scopus Source as an entity type
- Create your own report templates
- 4 new visualizations (Matrix Table, Roof-Shaped Matrix, Chord Diagram and Bubble Chart)
- 2020 SDGs
- Authorship analysis
- Improved metrics guidance
- Opan Access overview
- Timeline motion chart
- Export 100k publications
The November 30, 2021 release brings a Bar Chart visualization for SDGs (2021), new ways to manage your user-defined entities in My SciVal, and increased transparency around the Institution profile considered by THE in WUR 2022.
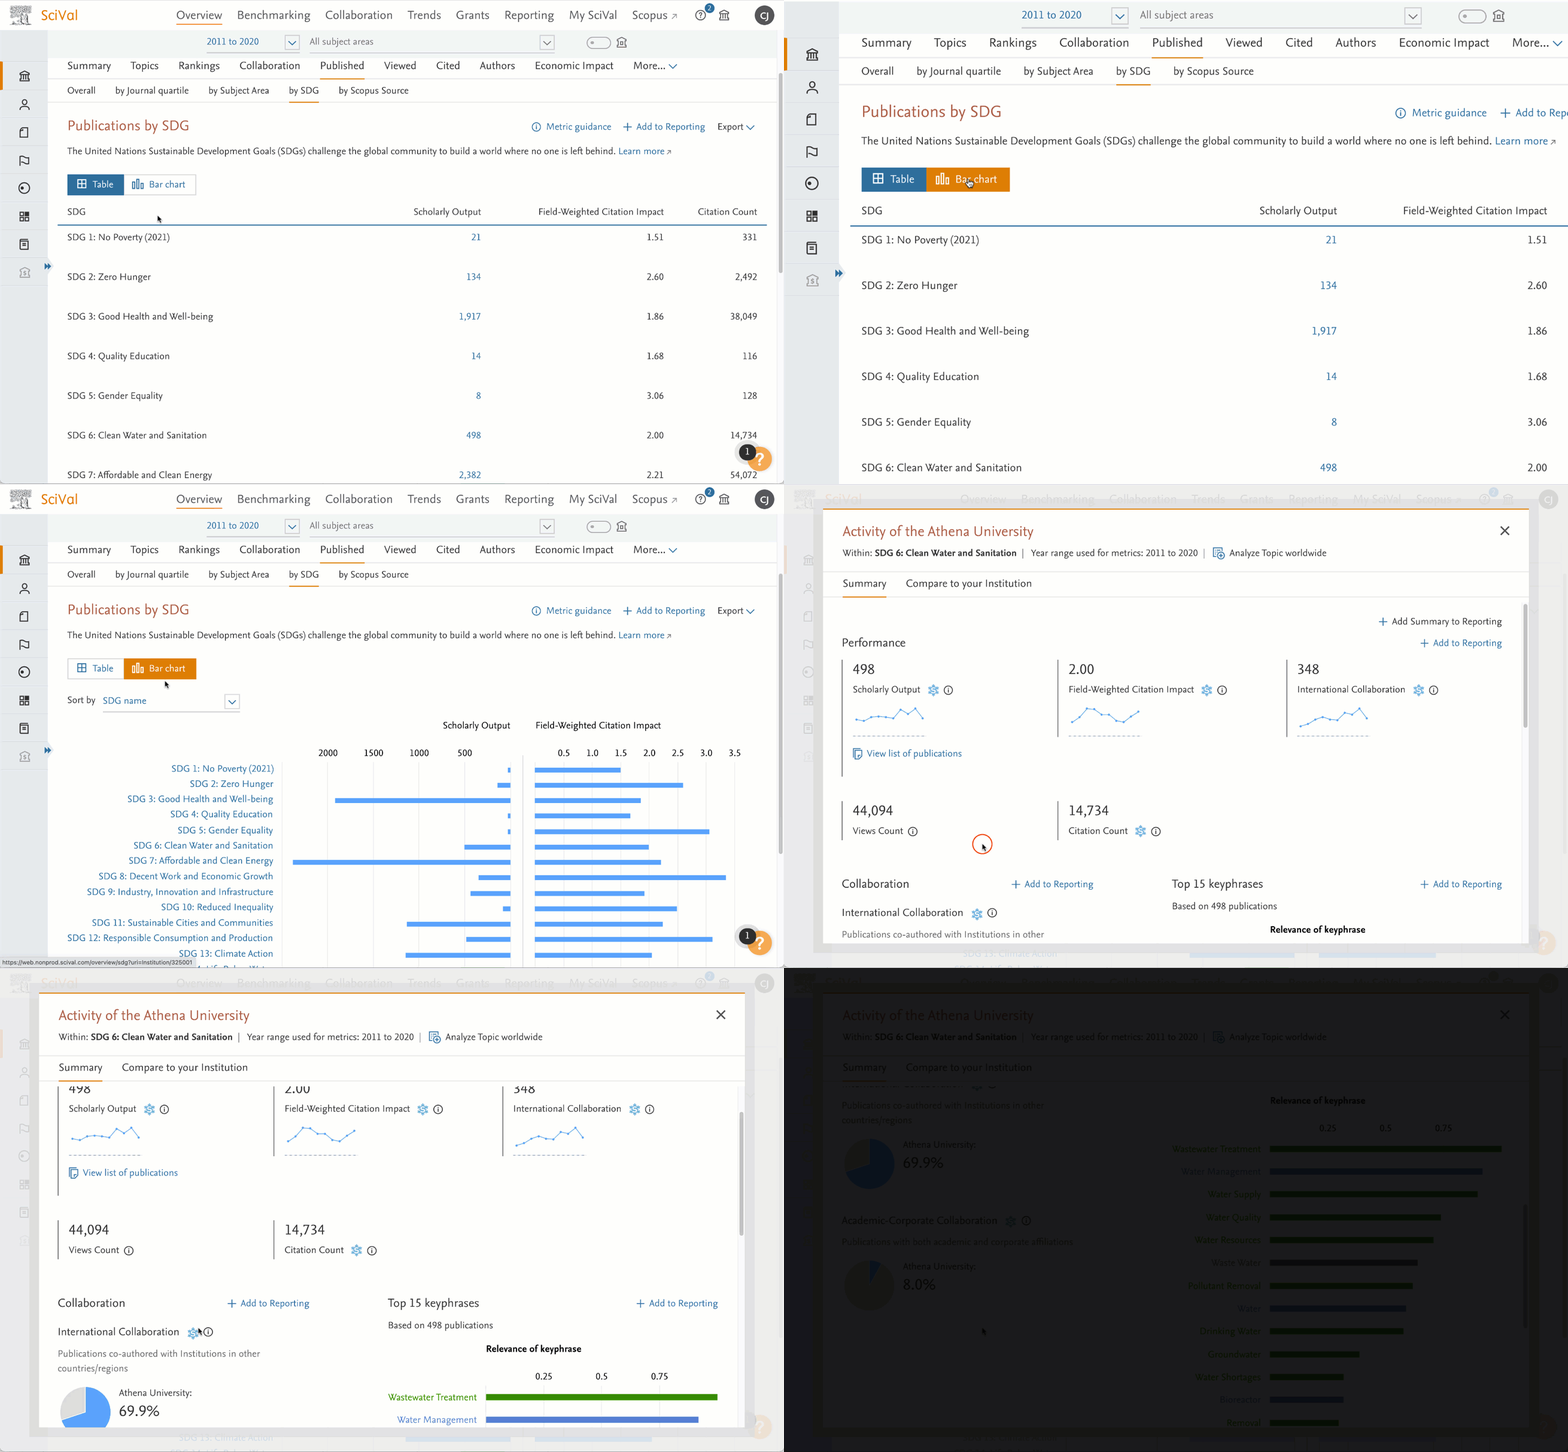
- Visualize and analyze an entity's contribution to the UN SDGs (2021) through a new weekly updated bar chart
Get an overview of a country’s, institution’s or Scopus source’s contribution to the UN SDGs with a new bar chart visualization in the Published by SDG tab in the Overview module. Analyze the contribution in terms of Scholarly Output or FWCI through a new weekly data feed, then dive deeper into their research in each SDG by clicking on the SDG name to open the details modal.
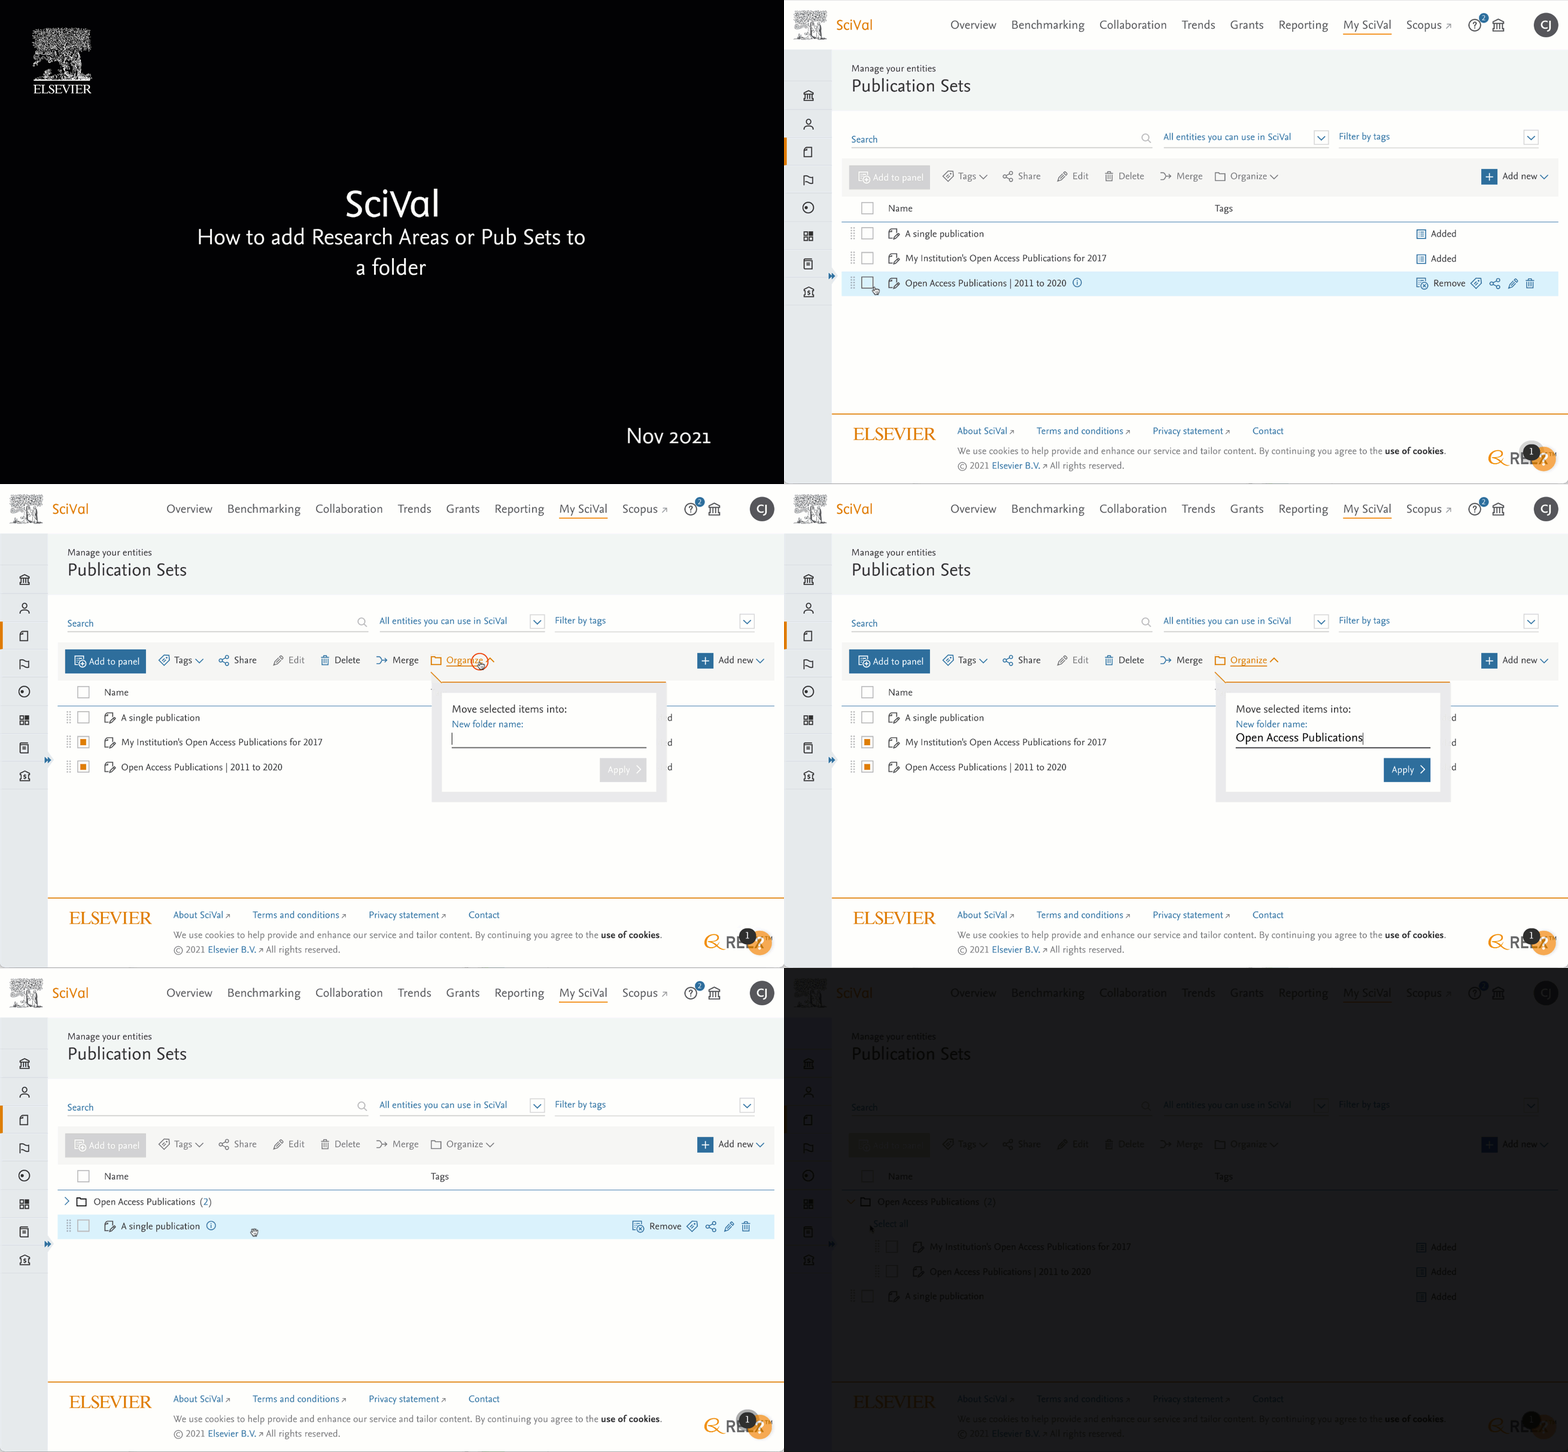
- Organize and find your Research Areas and Publication Sets in My SciVal more effectively with the ability to create your own folders and organize within new folder structures
You can now create your own folders for your Research Areas and Publication Sets in My SciVal, making it easier to organize your entities and quickly find the ones you are looking for. Folders can be one level deep and can contain any of your self-defined Research Areas or Publication Sets.
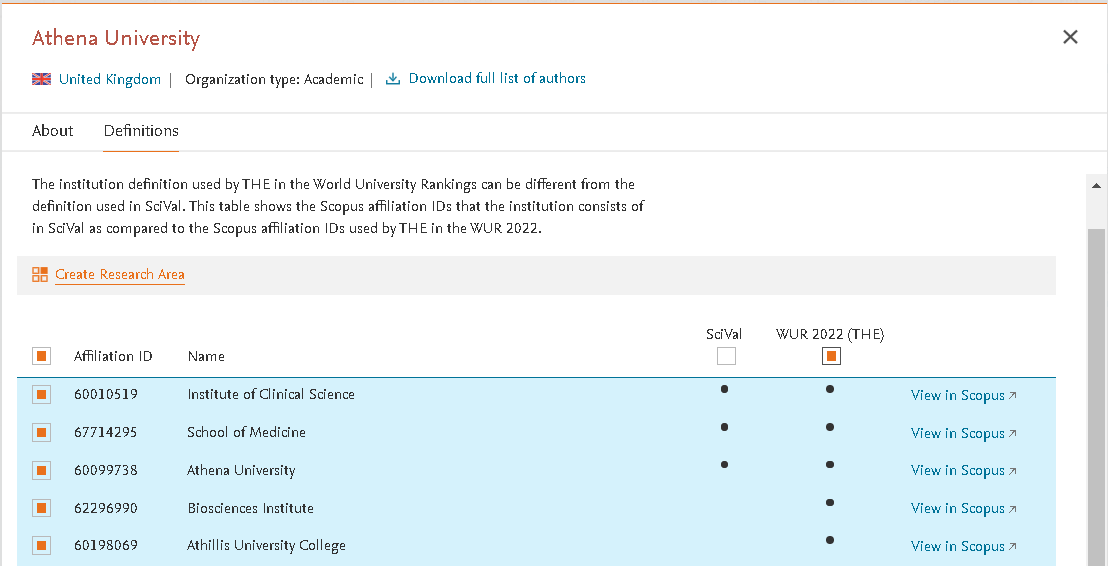
- Increased transparency around the Institution profile considered by THE in WUR 2022
The new 'Definitions' tab in the Institution details modal shows which Scopus affiliations were included in the institution profile used in the THE WUR 2022 rankings, and how this definition compares to the Institution profile in SciVal. Want to analyze the THE institution in more detail? You can easily create a Research Area based on the affiliation listing for further analysis.
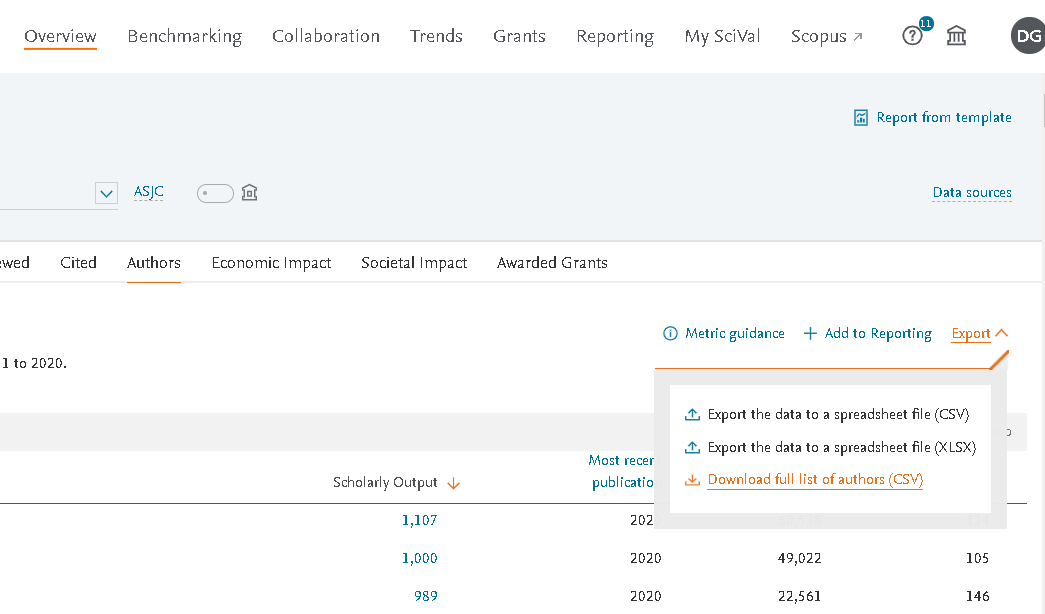
- Export the full list of authors for your Institution
The new export option is available for your Home Institution. Go to the Overview module Authors tab, as well as in the Institution details modal and export all authors who have published at your institution from 2011 to present. The export, which includes author information and an array of 6 metrics, enables you to evaluate the research performance of your Institution based on author-level metrics and identify potential duplicate profiles.
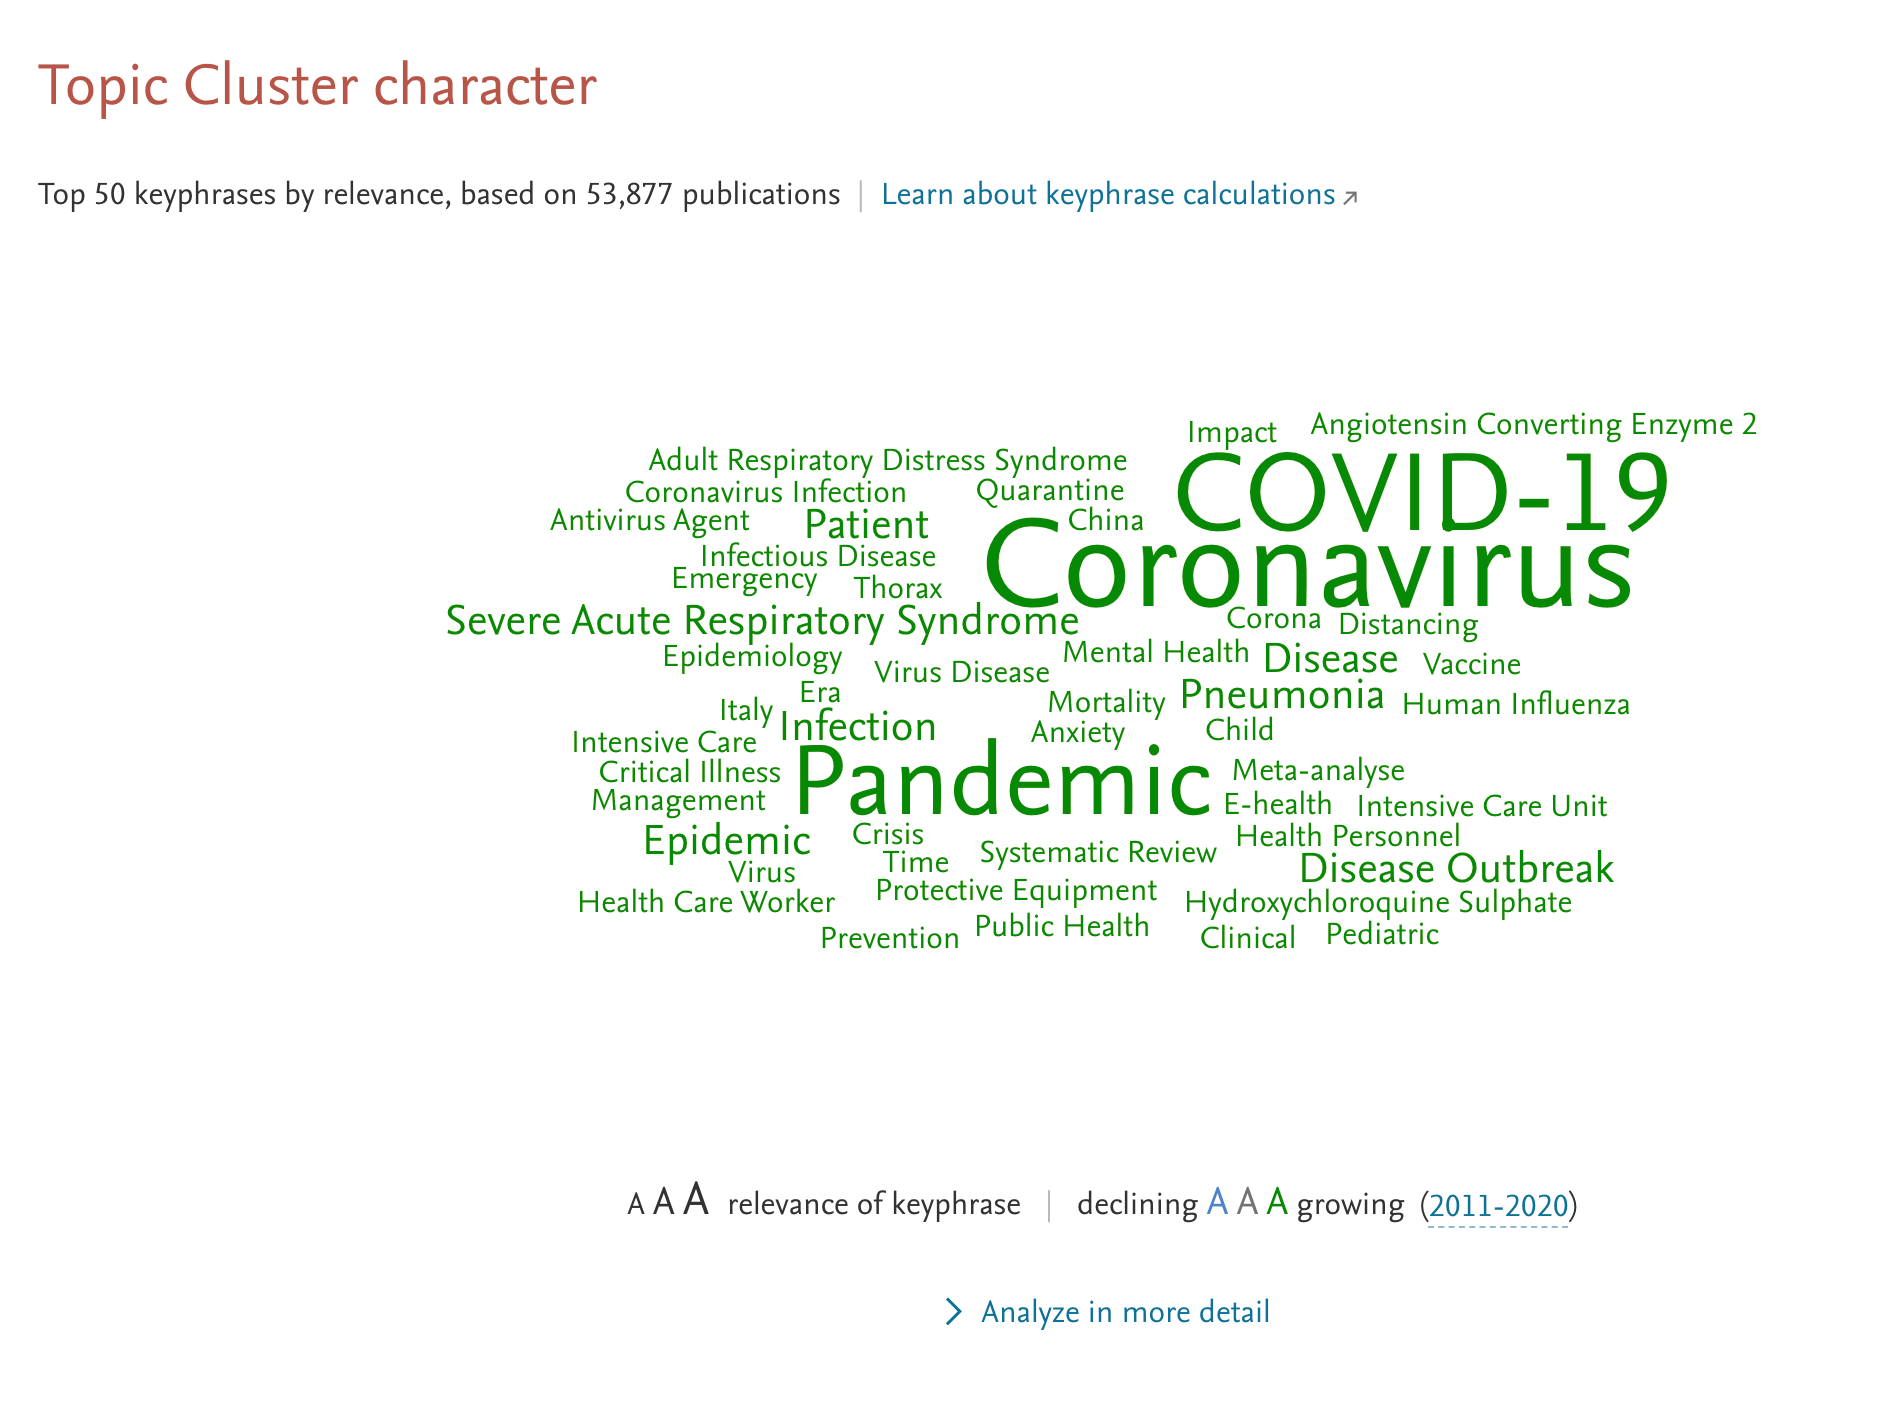
- New and improved Keyphrase analysis
SciVal has migrated to the newest version of the Fingerprint Engine (FPE8.2), providing you with new and improved Keyphrases, including on newly emerged areas of research such as COVID-19.
- Weekly updates to the SDG (2021) Research Areas
The SDG (2021) Research Areas are now being updated with new publications on a weekly basis, always providing you with the most up-to-date data for your analyses.
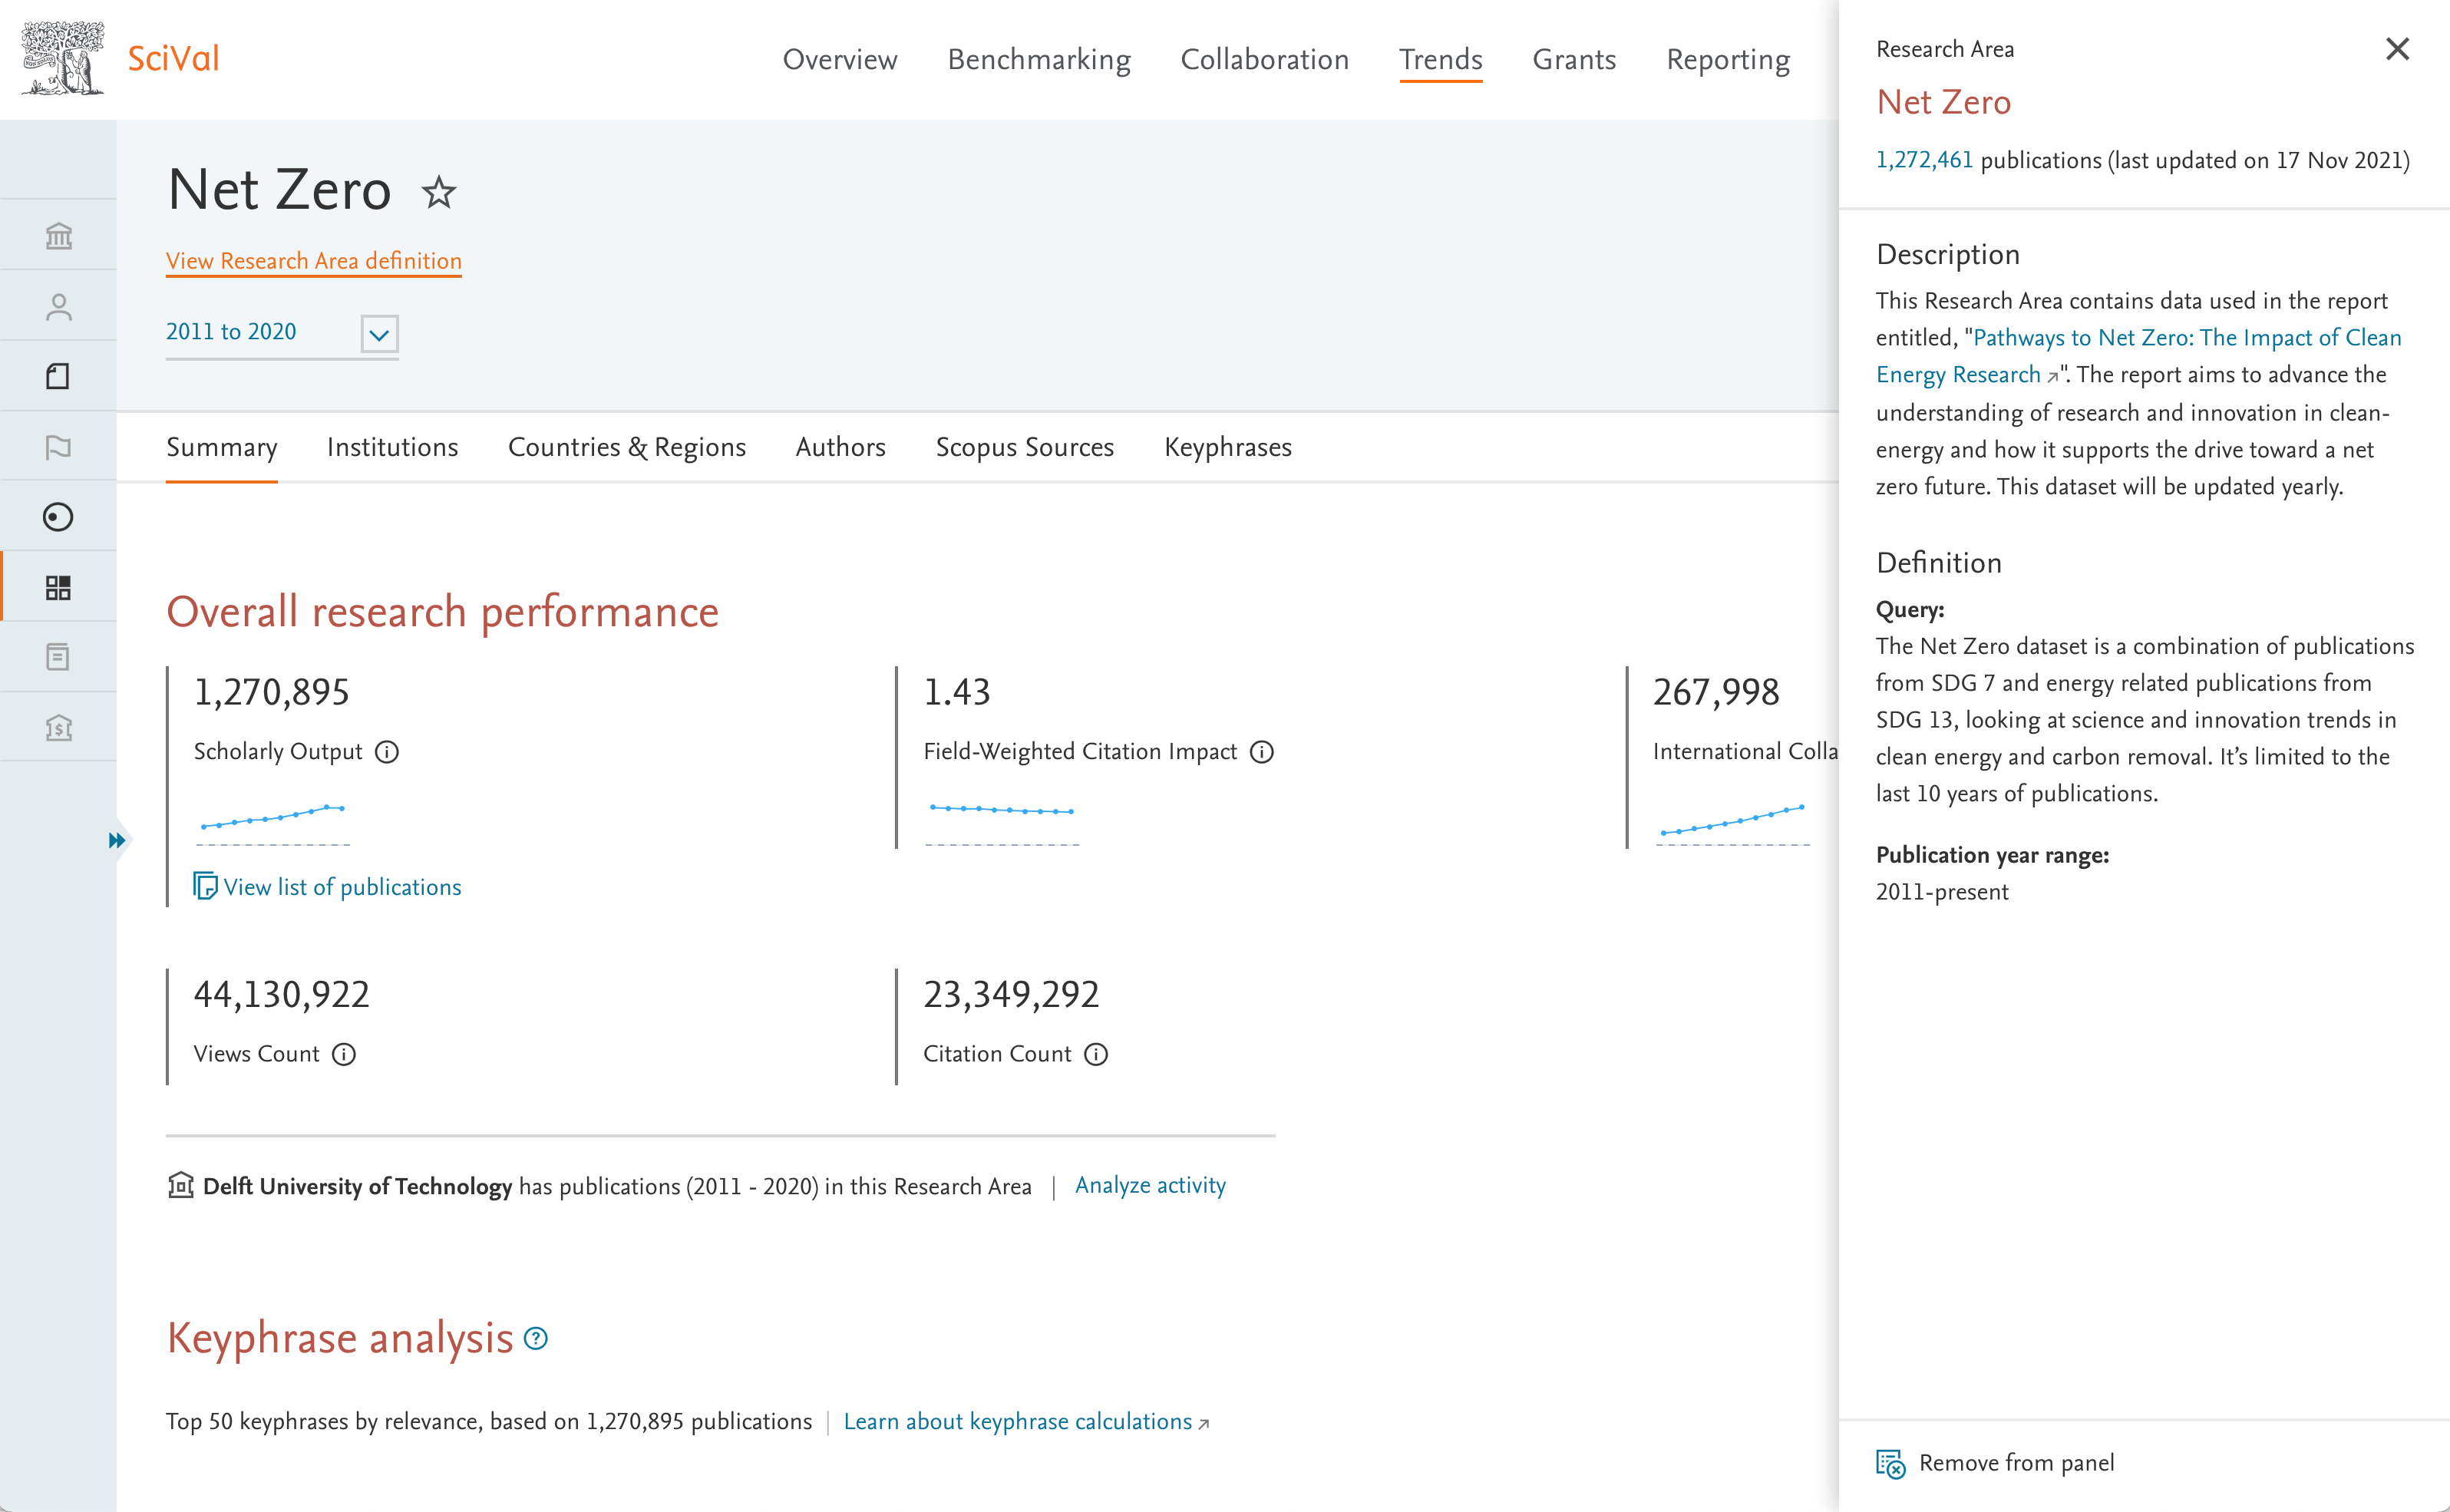
- Dive into clean energy and carbon removal research with the 'Net Zero' Research Area
The 'Net Zero' Research Area now available on SciVal enables you to profile and analyze global research using the dataset used in the recent report Pathways to NetZero: The Impact of Clean Energy Researchopens in new tab/window published by Elsevier Analytical Services. The report analyzed datasets created with SDG 7 and part of SDG 13, looking at science and innovation trends in clean energy and carbon removal.
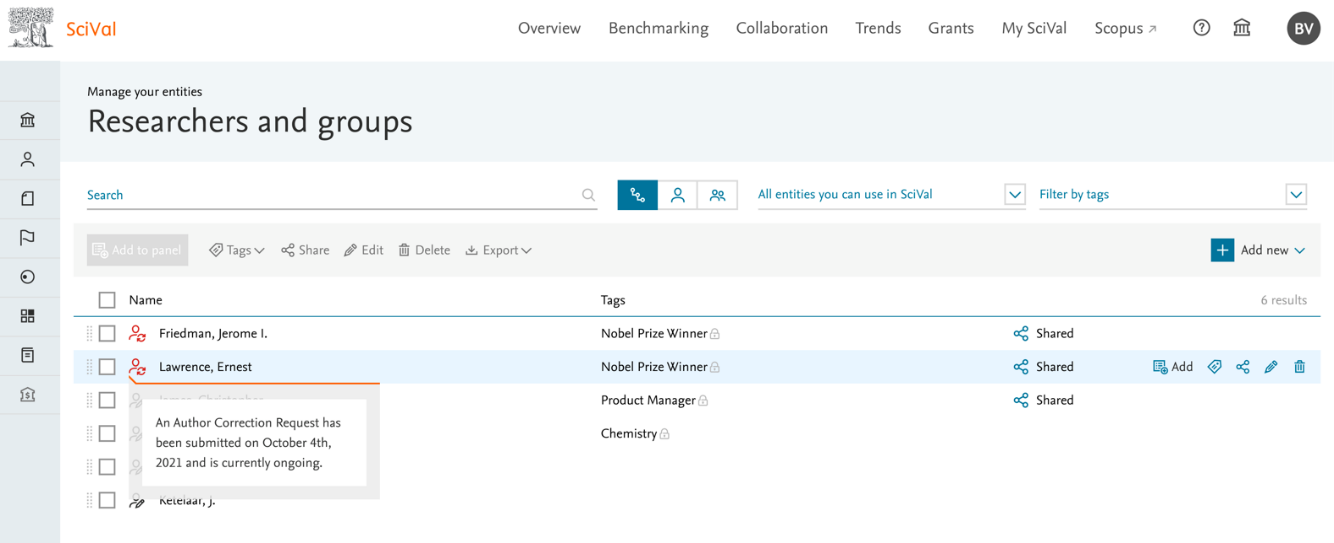
- Identify researcher correction requests you submitted that are still ongoing
A distinct icon will indicate that an Author Profile correction request has been submitted to Scopus and is currently being processed. The icon, which will be displayed in My SciVal as well as in the Researcher Group define flows, allows you to keep track of when, and for which Researchers, you have submitted profile correction requests. The ongoing status is also indicated in any export. Once the correction is complete, the icon will disappear.
Other release items:
- You can now add the Scatterplot visualization for Topics and Topic Clusters to your Reports.
- Create a Topic Group from Related Topics in the SciVal Grants module.
- Metrics guidance is now available in even more places across SciVal.
The October 19, 2021 release brings a new visualization option for Topics and Topic Clusters in the Overview module, expands the analyses that can be added to Reporting, provides a more personalised experience for researchers and many other usability improvements.
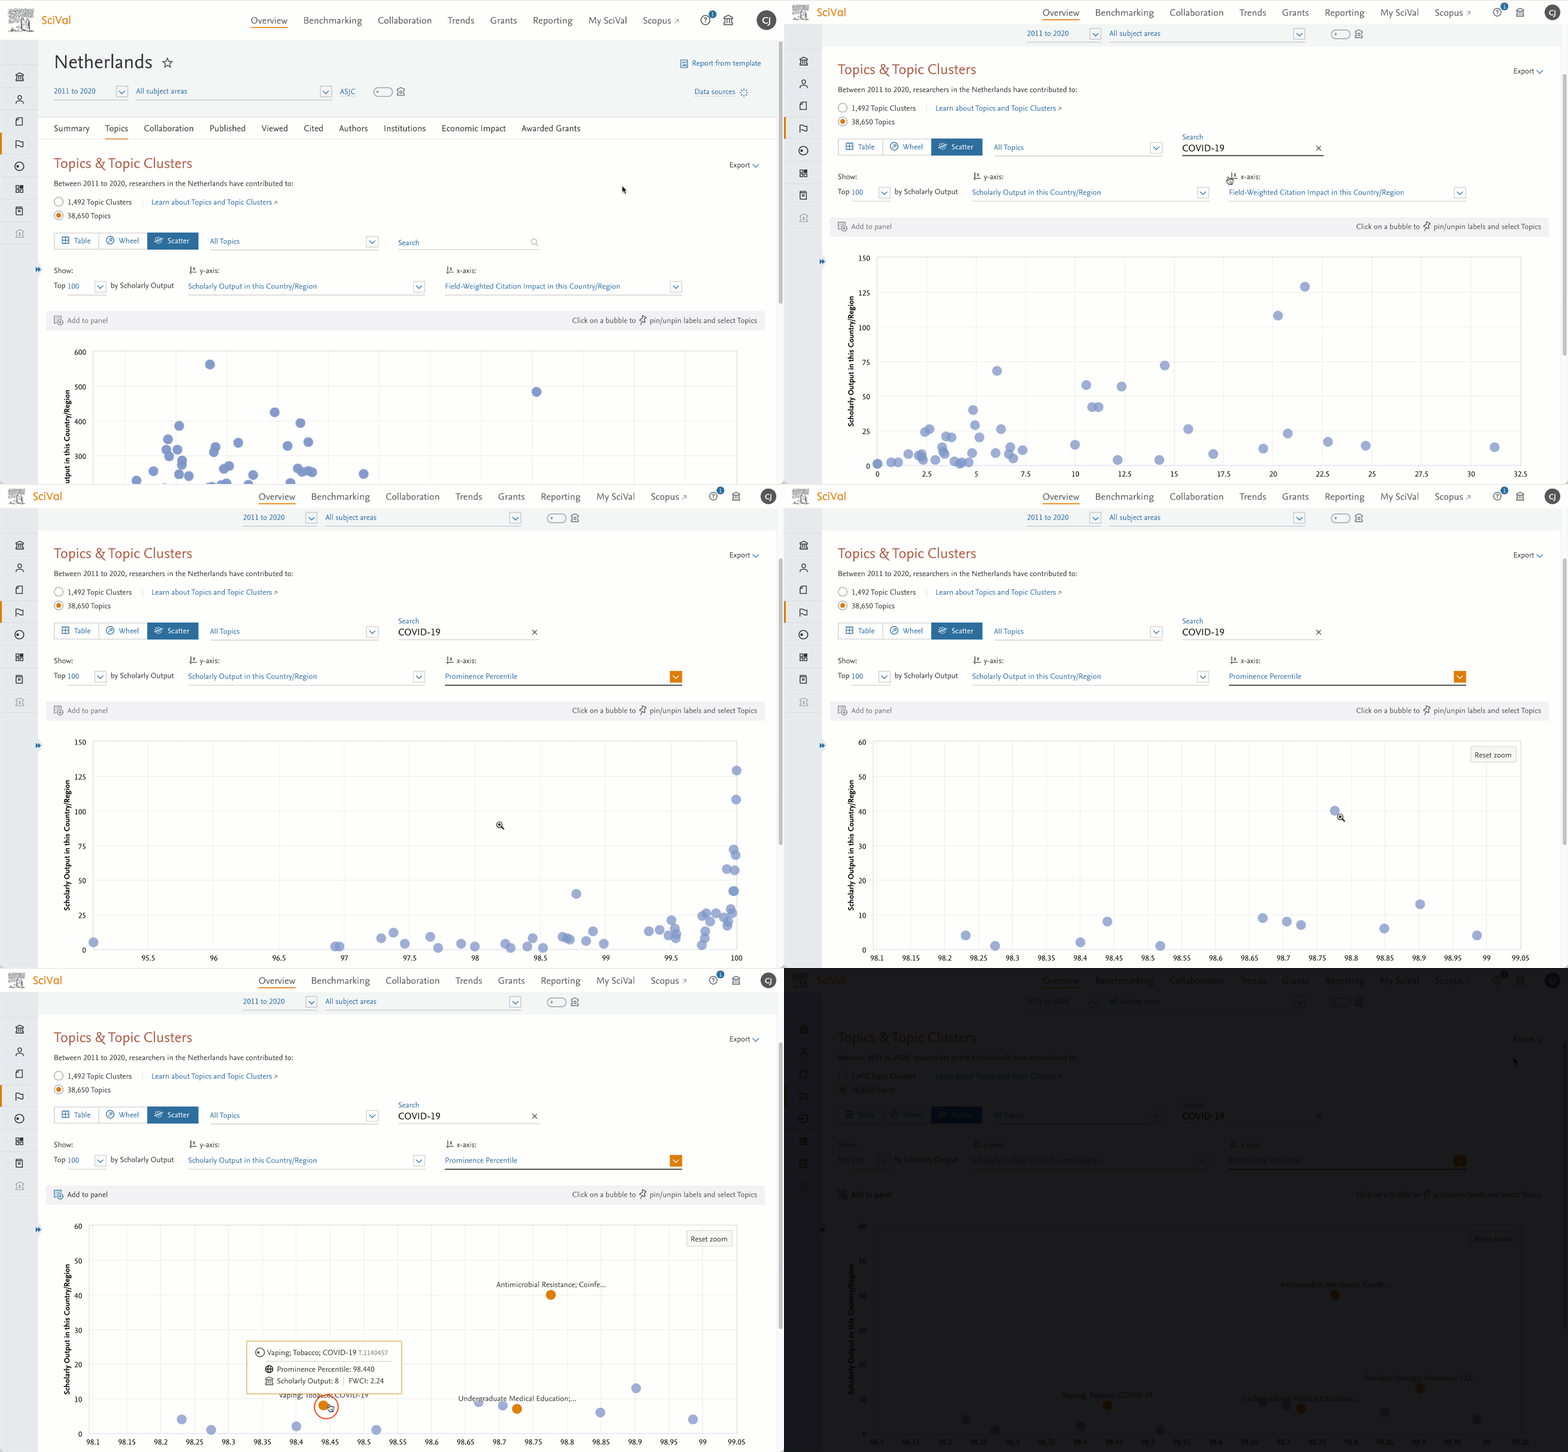
- Visualize the distribution of Topics and Topic Clusters across three metrics in a scatter plot
Identify patterns and outlier Topics with a new scatter plot visualization option. The chart provides a graphical overview of how an entity’s Topics and Topic Clusters are distributed in terms of their Scholarly Output, Field-Weighted Citation Impact or Prominence percentile. You can also select an area on the scatter plot and zoom in for a more granular view and further analysis.
The scatter plot view is available in the Topics tab in the Overview module.
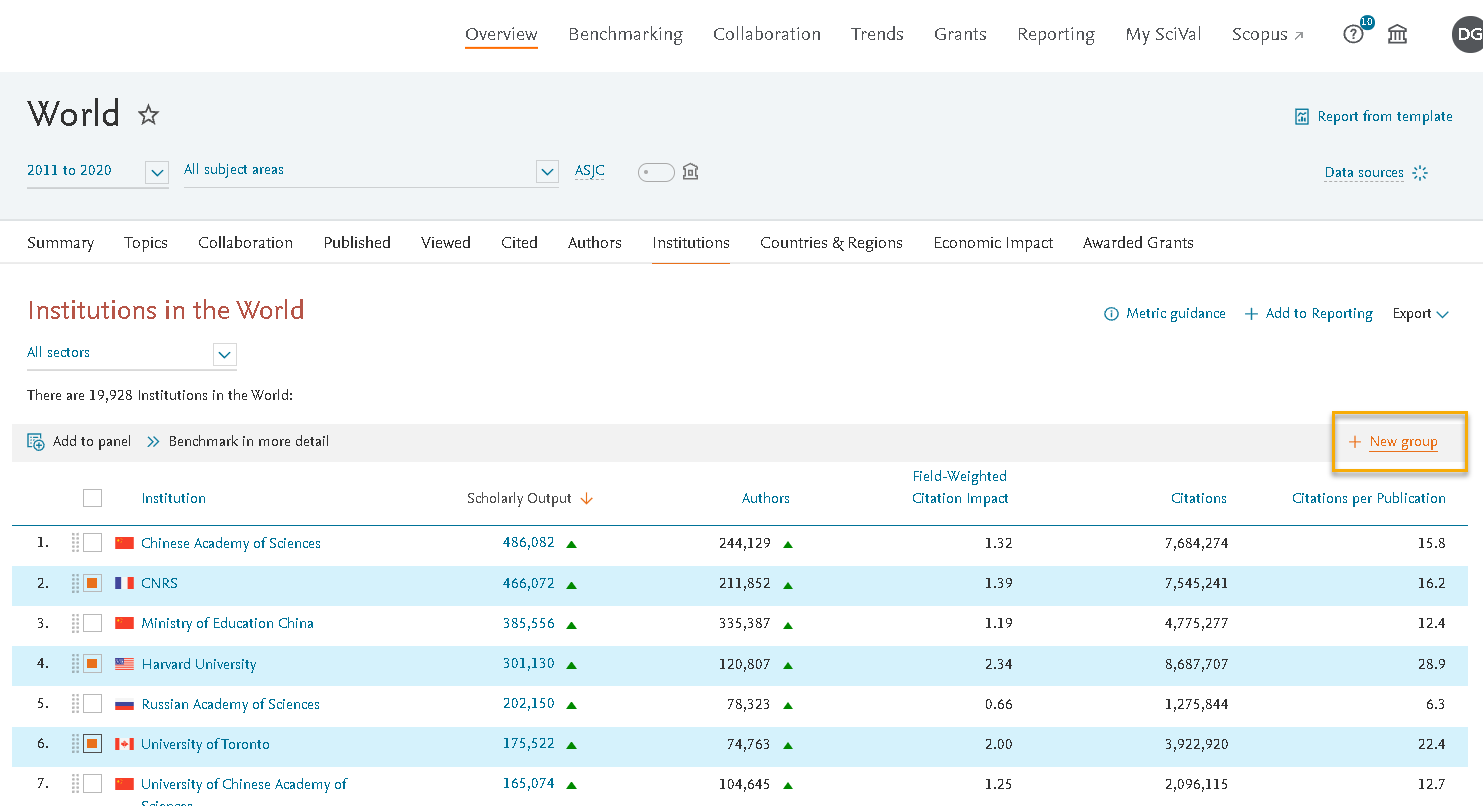
- Easily create groups from table listings
Quickly and easily create groups of Researchers, Institutions and Countries directly from tables – simply select the entities you are interested in analyzing as a group and click on 'New group'.
This feature is available in the table views in Overview and Trends.
- Add THE metric benchmarking and SDG analyses to your Reports
The 'Add to Reporting' option is now available for THE metrics in Benchmarking for a single ranking year as well as for multiple years. You can also add the yearly breakdown by FWCI, and the Ranking Years Comparison, from the Overview module, to your reports.
Furthermore, this release also introduces the option to add the breakdown by SDG (2021) to reporting for Institutions, Countries & Regions and Scopus Sources, which can be found under the Published tab in the Overview module. - Interactive chart for rankings FWCI
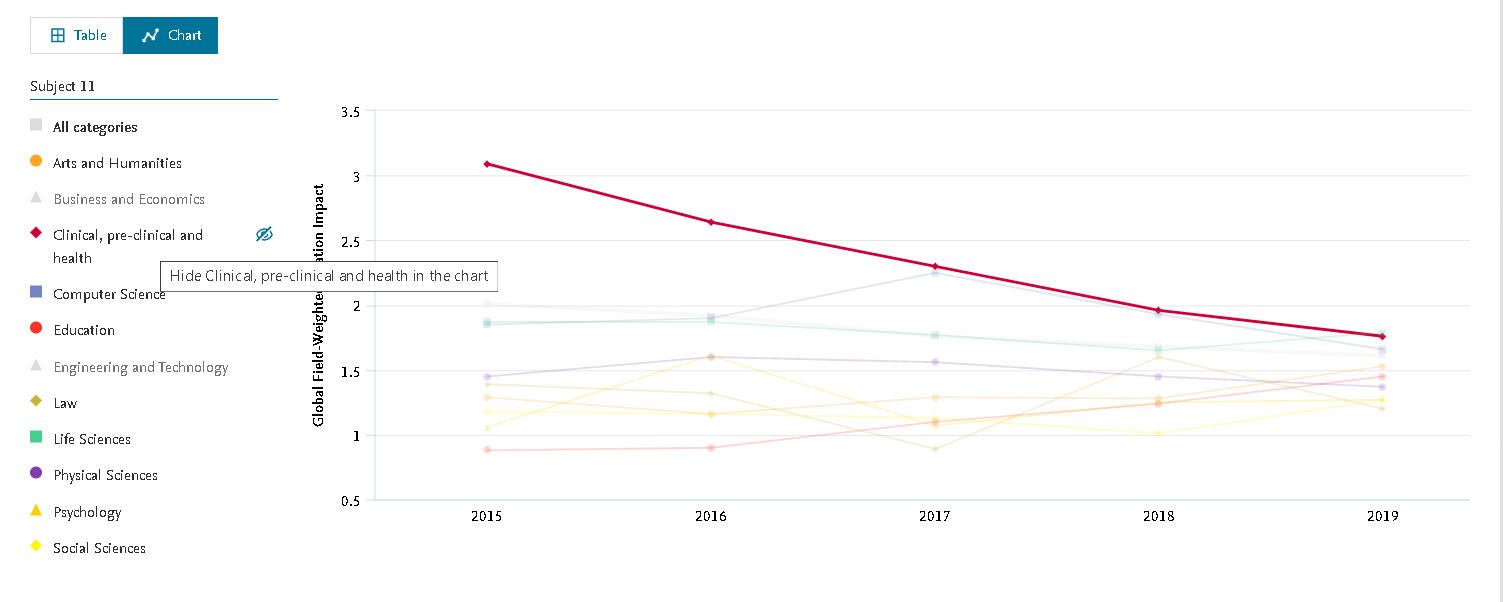
The interactive chart allows you to highlight the category you are interested in and to hide subject categories to focus your chart specifically on the ones you want to analyse.
- New ways to connect and personalize your profile
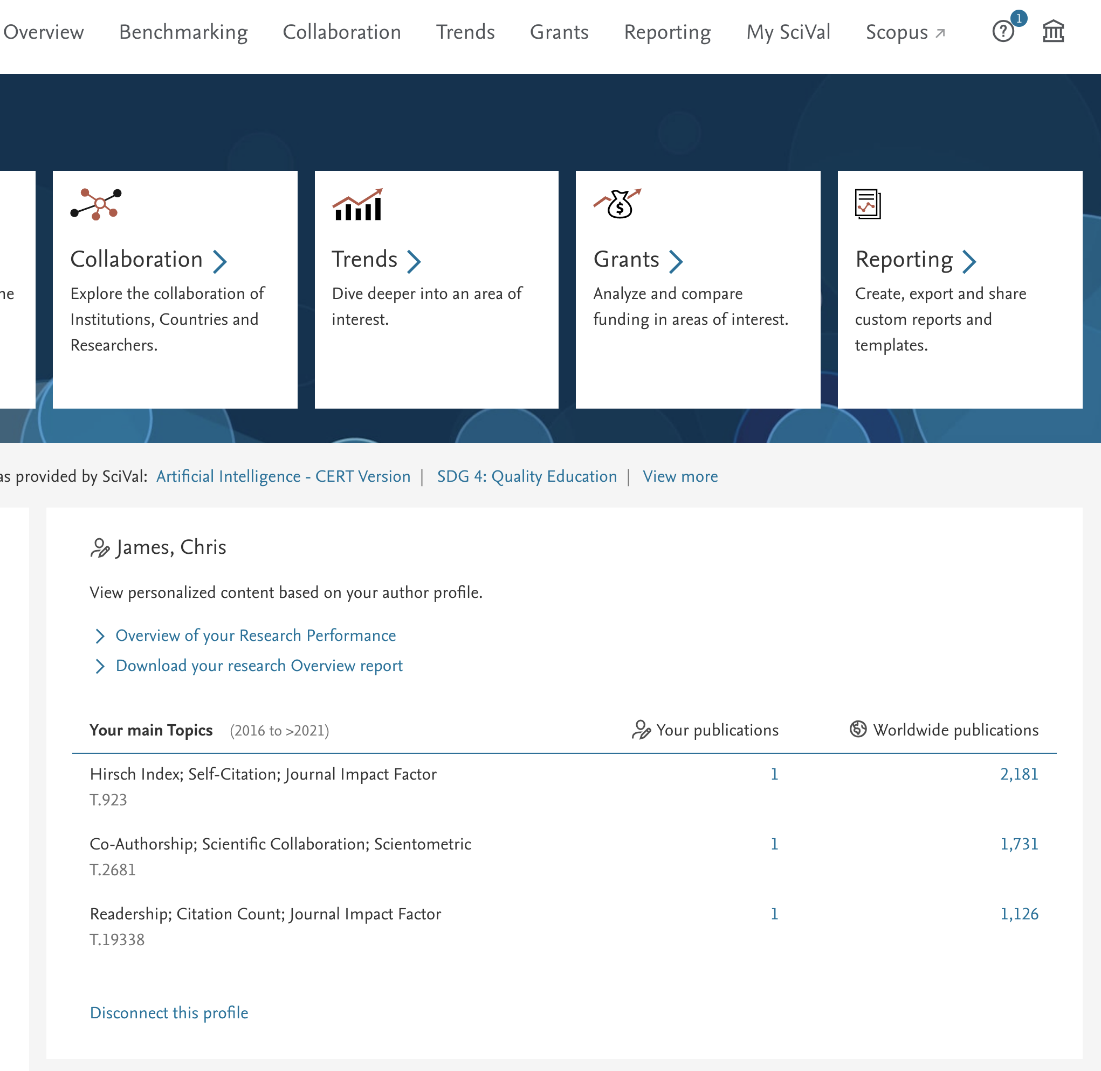
There are now more ways to connect your researcher profile to your user account for a more personal SciVal experience. You can connect your profile when defining a researcher, from the entity panel, from the header in the Overview module or in the new Personalization tab in the Settings section.
Connecting your profile will pin your researcher entity in the 'Your profile' section on the left panel for easy selection. It further offers you tailored content on the homepage, such as shortcuts to your own profile, the Topics you've published in most frequently and to an overview report of your research performance.
- Improvement to the import researcher flow
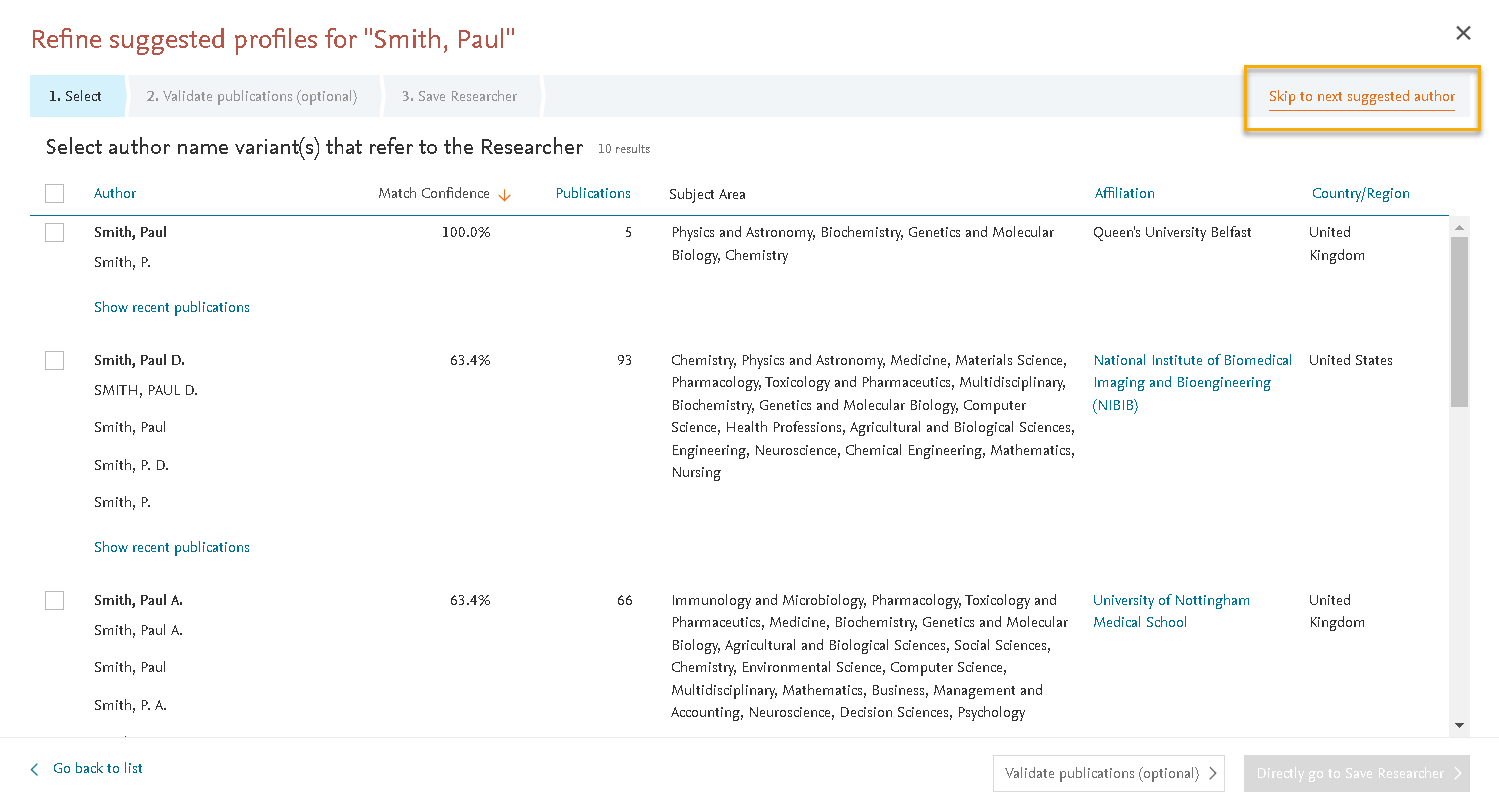
A new 'Skip' option lets you easily navigate between profiles that need refinement, or that you want to come back to later, after you have imported a list of researchers to SciVal.
- Expansion of Grants funding bodies
20 additional funding bodies from Australia, the United Kingdom and the United States are available in the Grants module.
The Xie release on September 21, 2021 adds the ability to view an entity's publications mapped to the by UN Sustainable Development Goal, more metrics guidance and heatmaps to help you analyze the Rankings FWCI.
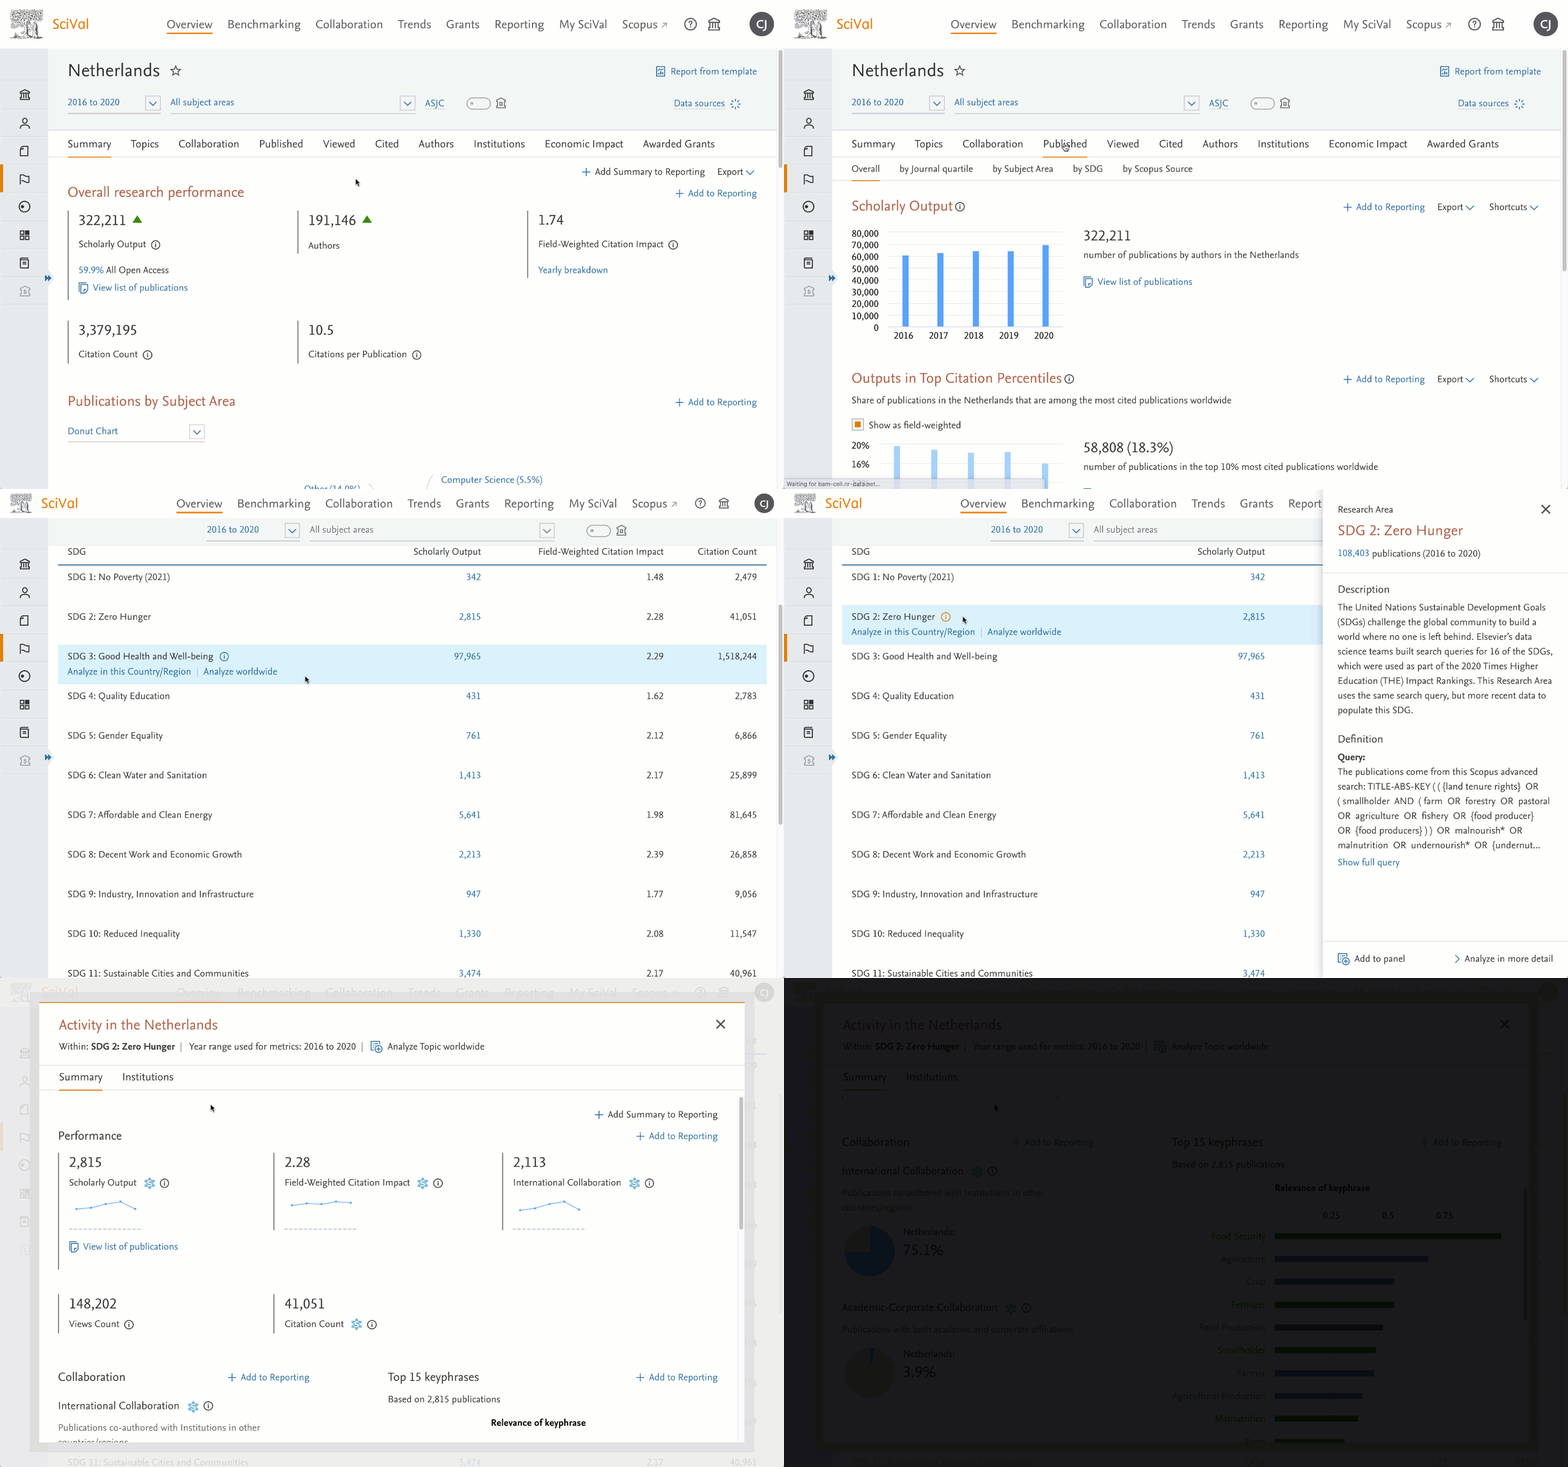
- Analyze an entity's publications per SDG
Analyze the publications produced by institutions, countries and regions, and Scopus Sources per SDG in Overview, to help understand the entities contribution to the UN SDGs. Dive deeper to understand these publications by creating Publication Sets. The publications per SDG can be found under the Published tab in Overview.
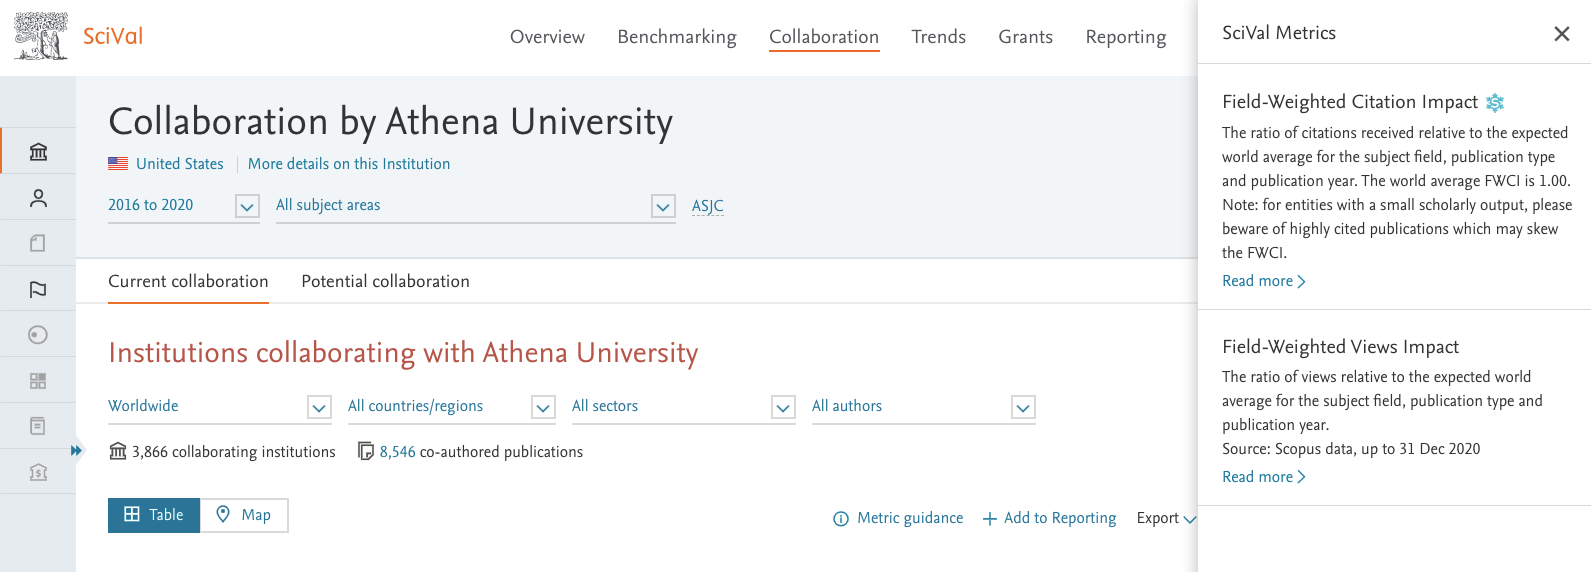
- Full metrics guidance now available in Benchmarking, Collaboration and Trends
SciVal now brings rich information about each metric directly into the page you’re looking at within all SciVal modules. Throughout SciVal you can now learn more about the strengths and weaknesses of each metric in context, so you can better interpret its meaning. Click on the info icon or Metrics guidance link and detailed information from the Support Centre is pulled into a panel on the right.
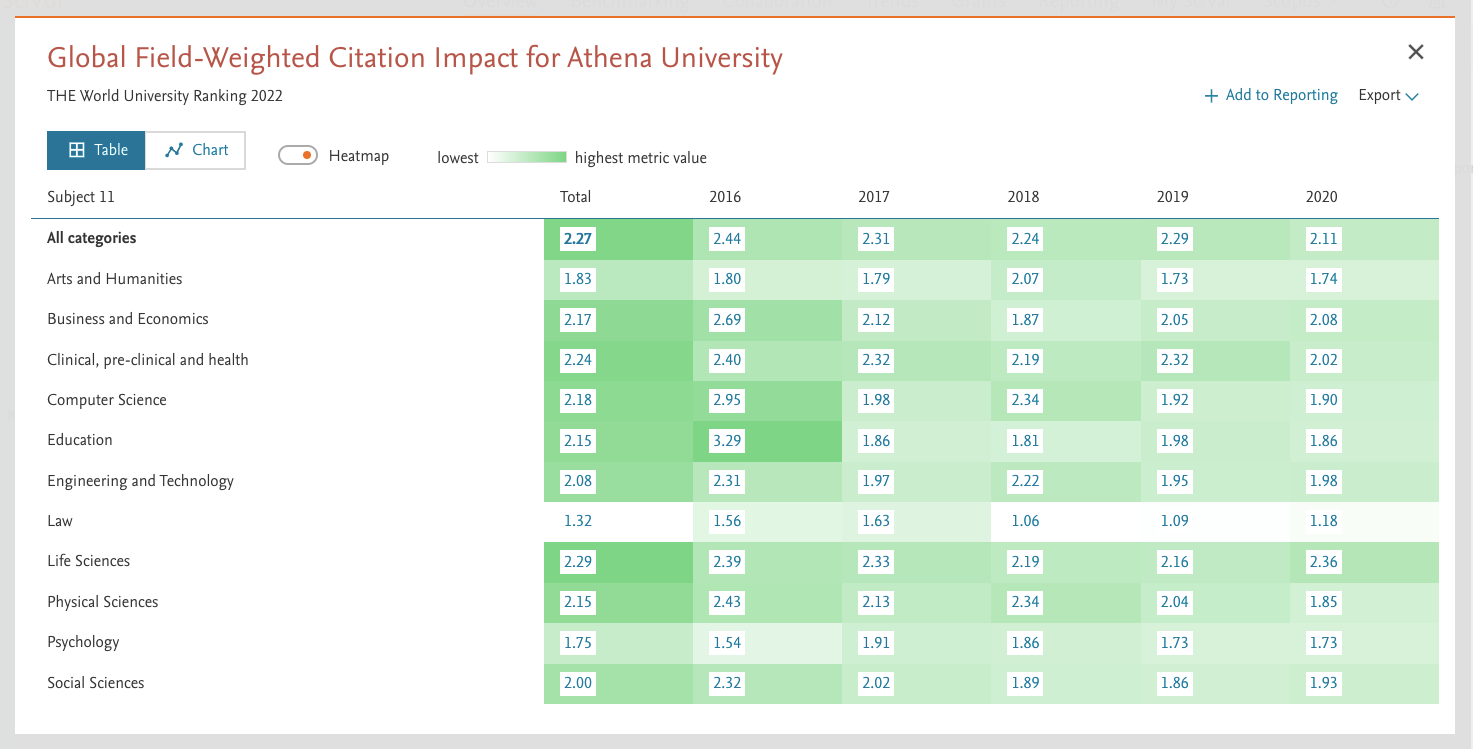
- Heatmap in rankings FWCI tables
Analyze the FWCI values table for each THE subject category quicker with new heatmaps, making it easier to see high and low metric values. You can get to this table by clicking on the Field-Weighted Citation Impact (5 year) values in the THE Rankings section for an institution on SciVal and by enabling heatmaps through the toggle.
- Improved researcher profile connection
Users coming from Scopus by clicking on the SciVal link will find it easier to locate their profile on SciVal for a more personalized experience. The user's name will be prefilled on the homepage to allow them to quickly locate their profile and get an overview of their research performance.
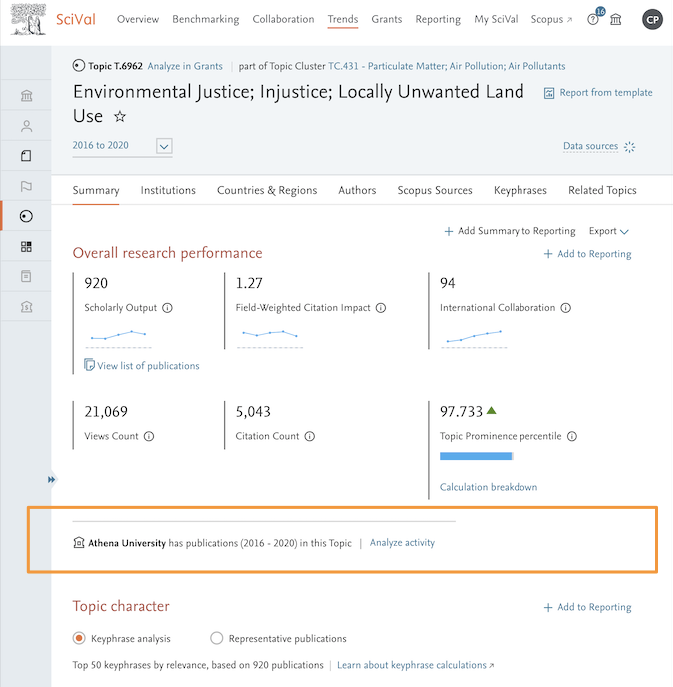
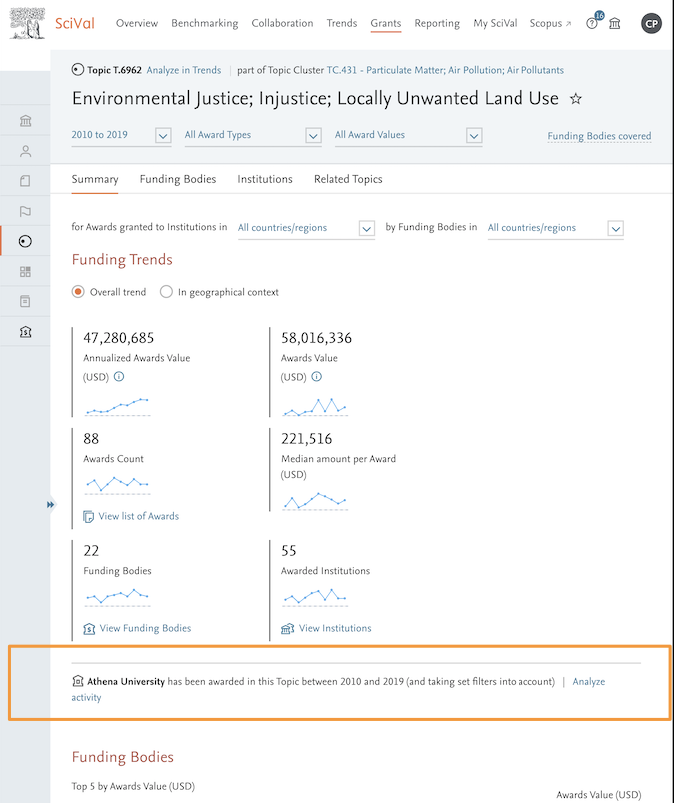
- Analyze your institutions contributions to Research fields
Analyze the activity of your institution in a Research Area, Publication Set or in Topics in Trends and in Topics and Topic Groups in the new Grants module. When your institution has publications in the selected year range in the entity being viewed, a quick link to view the summary of the performance, collaborations and top keyphrases is shown in Trends, making the analysis easier.
Similarly for customers with the Grants module, when your institution has been awarded grants in the selected year range in the entity being viewed, a quick link to view the summary of the funding performance, funding bodies, awardees, awards and resulting publications is shown in Grants, making the analysis easier.
- Benchmarking export improvements
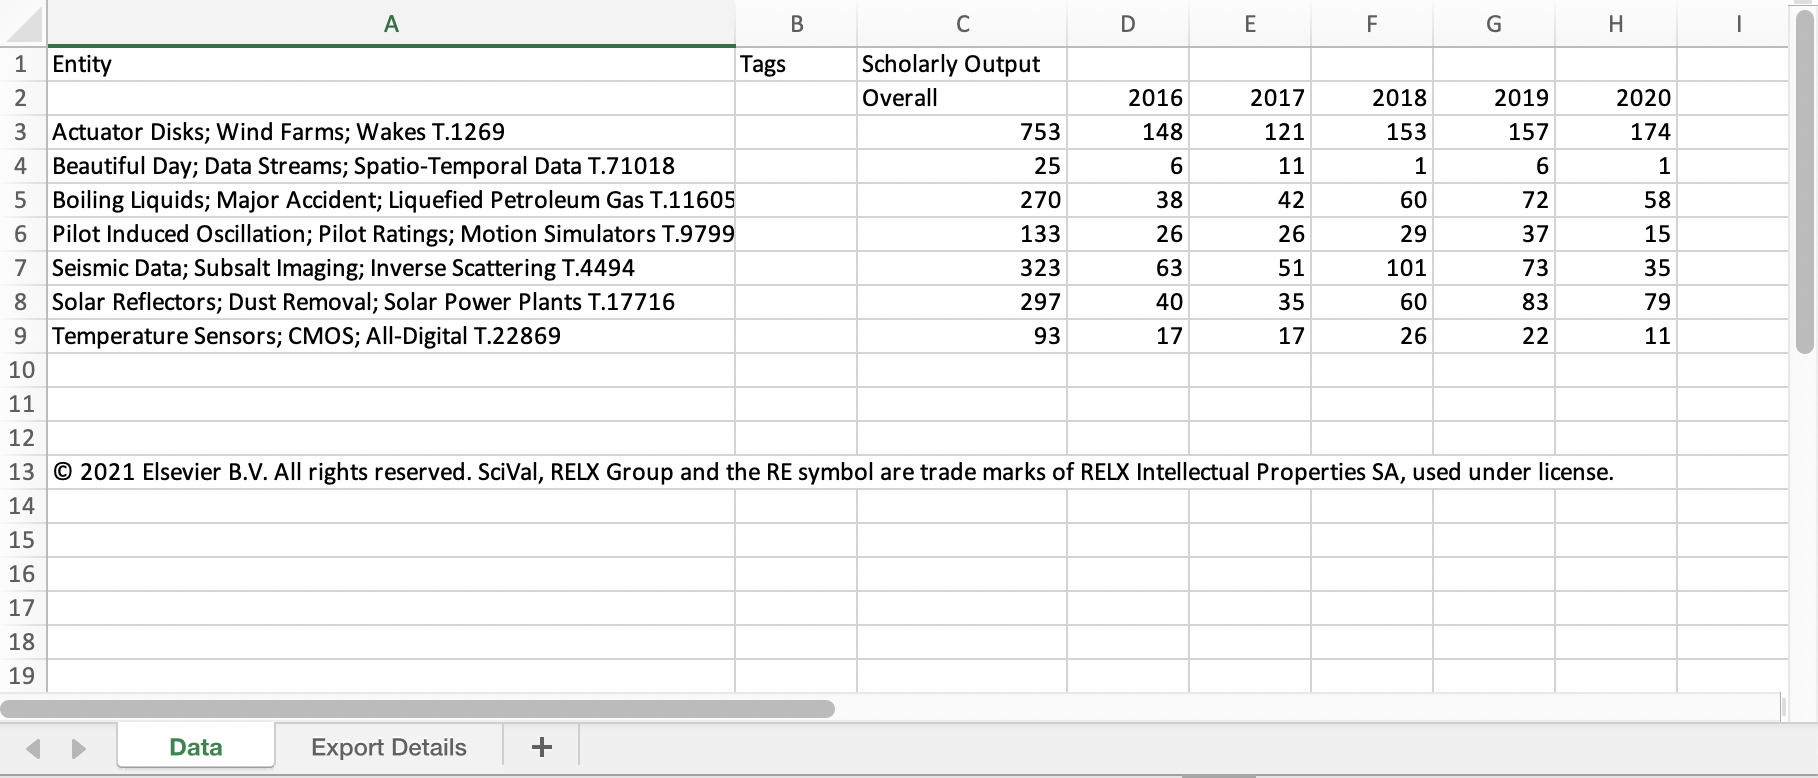
We've received feedback that you need to remove the export details when importing data from SciVal into another system. These extra steps take up time and increase the risk of errors. As a result, we've taken the export details and moved them to a separate tab in Excel to make it easier to import the data into your external systems.
- Usability improvements in Grants
Give more clarity to the composition of Topic Groups by adding a description when creating them. The description and search query used to define the Topic Group of interest are visible in My SciVal via a fly-in panel.
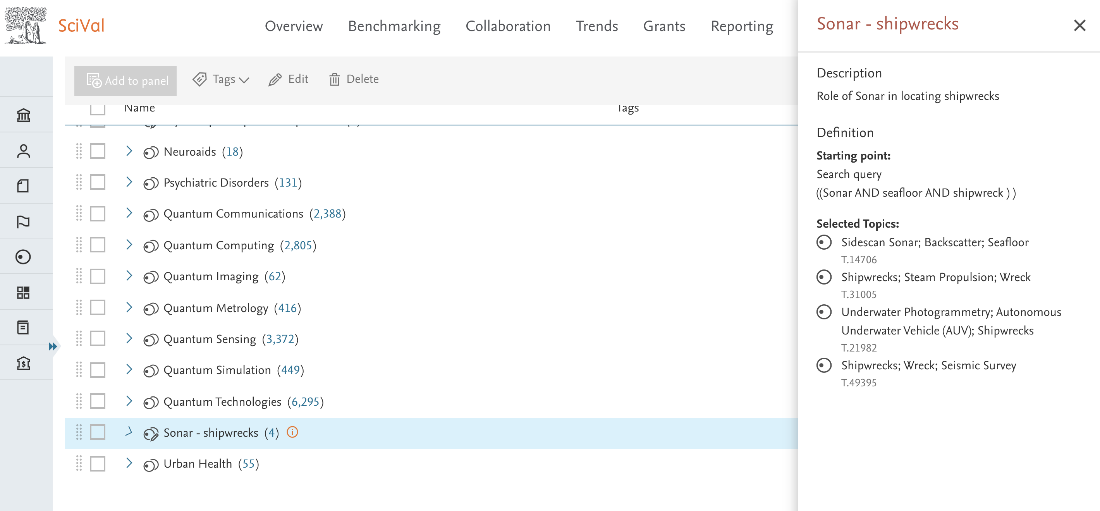
You can now also create larger Topic Groups to analyse the funding landscapes for broader areas of research focus (e.g. Climate change) with the upper limit for the size of a Topic Group now raised from 100k to 300k publications.
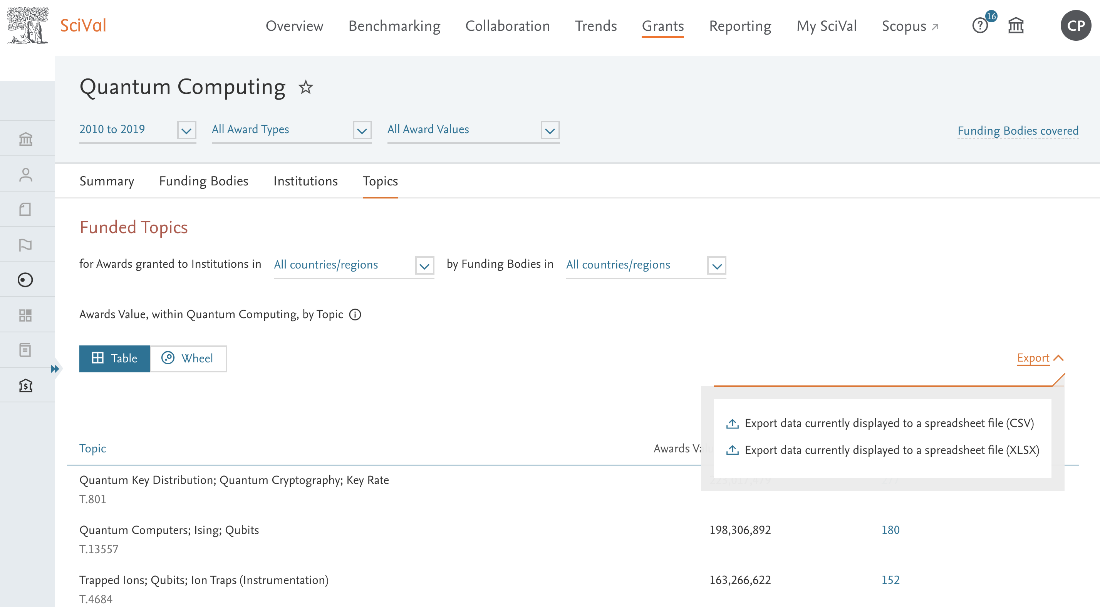
Share funding intelligence insights for entities in Grants with the ability to export (.csv and .xslx formats) lists of Topics, Institutions and Funding bodies.
The second phase of the Wolf release adds the bibliometric data underlying THE World University Rankings 2021 and 2022. It also brings the ability to analyze the change in key metrics such as FWCI (5 year) between the two ranking years, 2021 and 2022 as well as the underlying publications considered in the THE rankings.
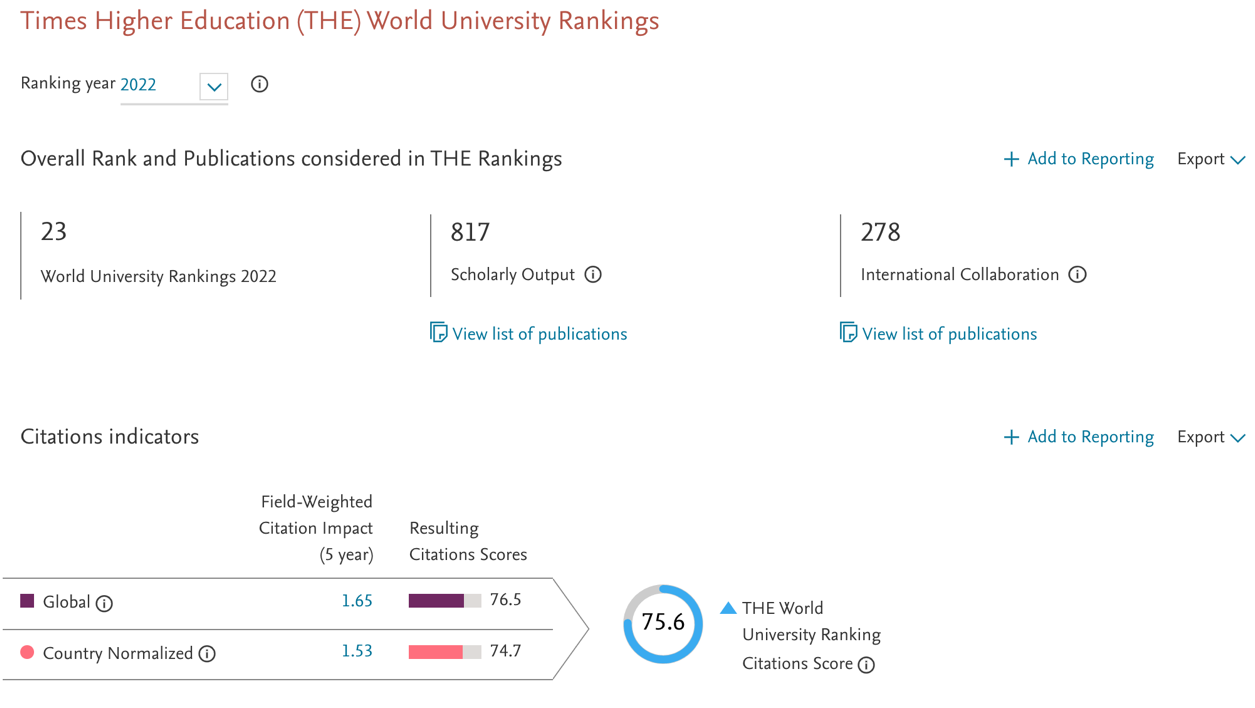
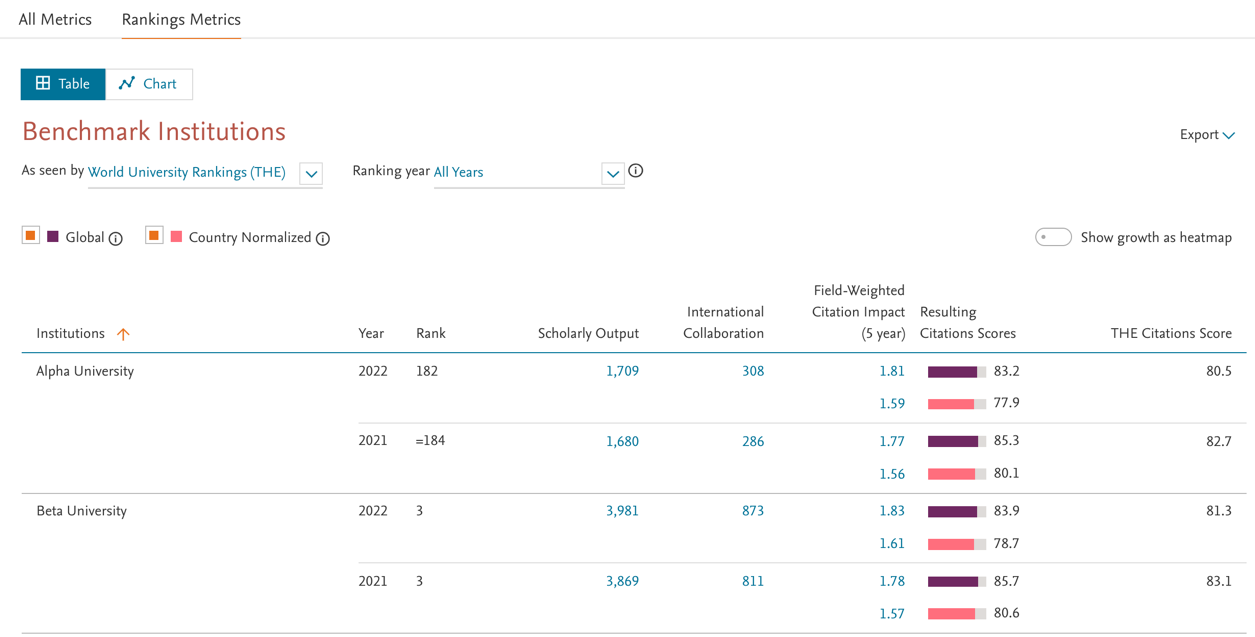
- Analyze the bibliometric dataset underlying the THE World University Rankings 2022
Gain a deeper understanding of the bibliometric dataset underlying your institution’s ranking scores in the THE World University Rankings 2022 (announced on September 01, 2021). Analyze the drivers behind the citations score (30% of the overall ranking score), and benchmark with peers to understand your institution’s position.
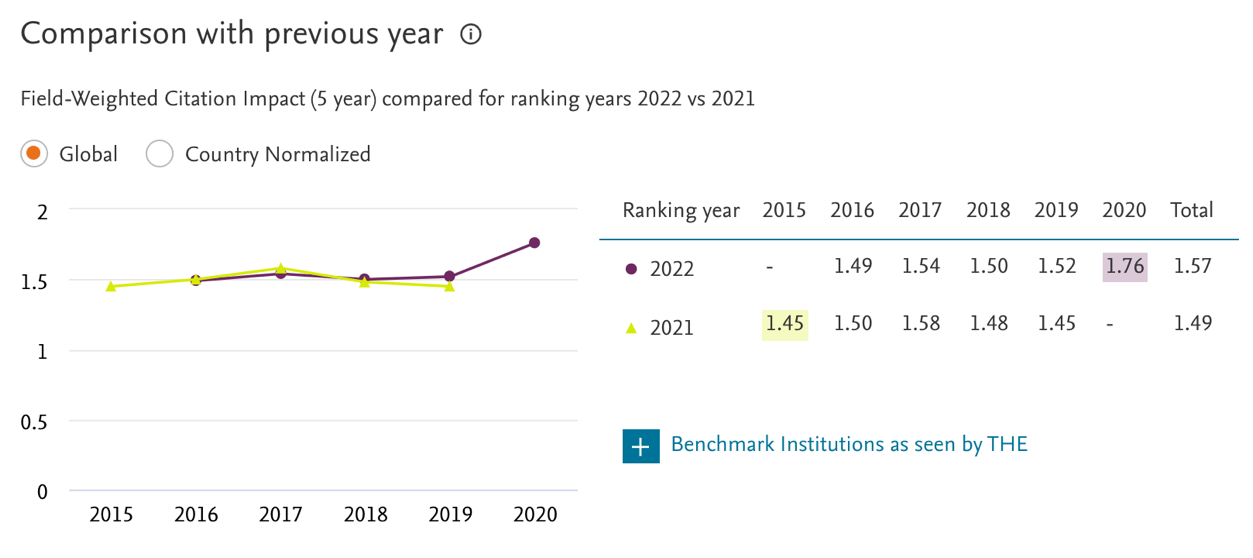
- Analyze the changes in FWCI values to get insights into changes in ranking scores
Gain insight into changes in ranking scores between 2021 and 2022 Rankings through access to the global and country-normalized FWCI (5 year) values for each publication year considered in each Ranking year (2021 and 2022).
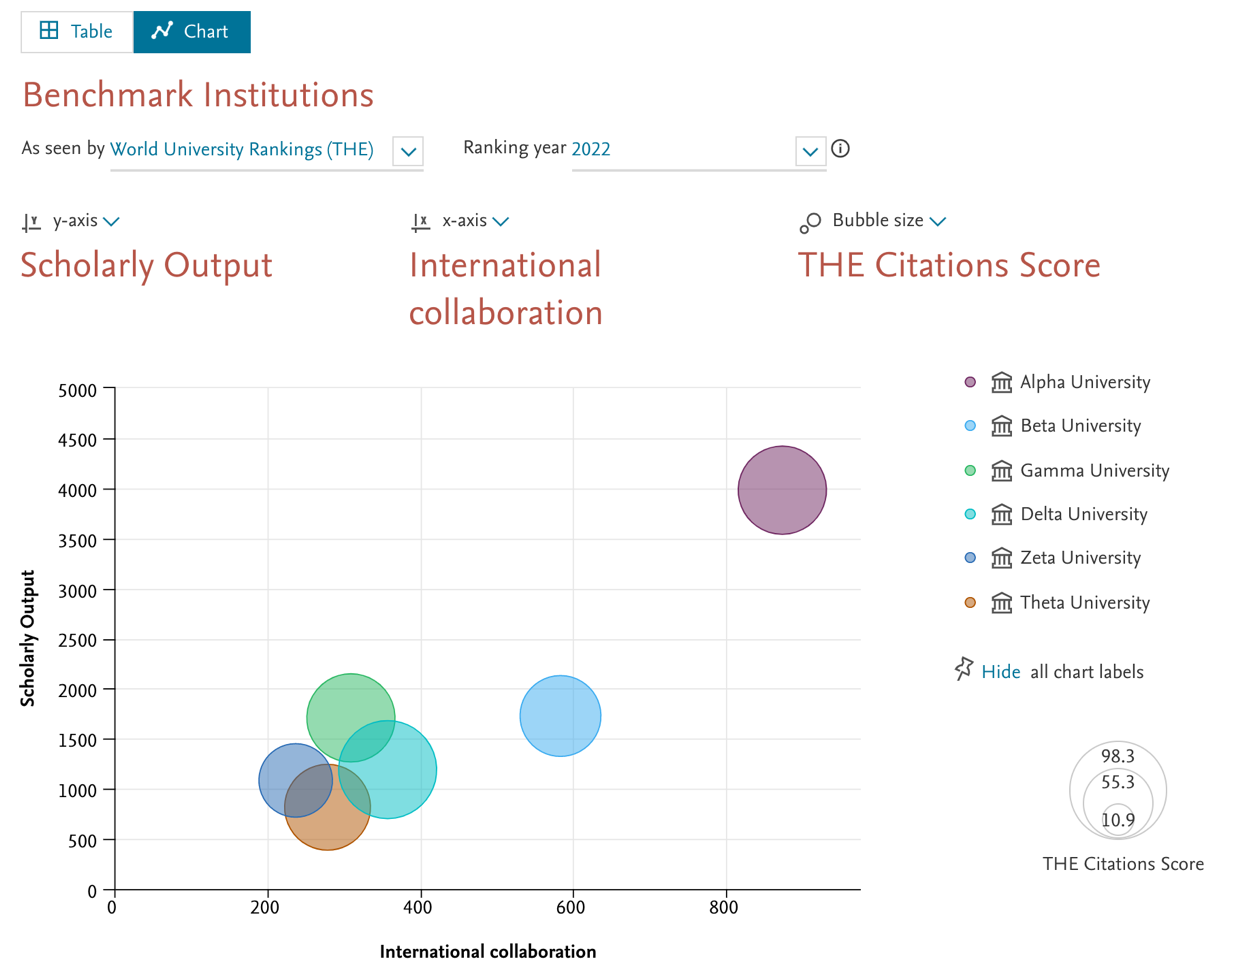
- Enhanced benchmarking with peers across all bibliometric drivers using chart
Use a new chart to benchmark with peers across all bibliometric divers and at the THE subject level, for the 2021 and 2022 Rankings.
- Reduced manual analysis with the ability to view, export and analyze publications considered in the THE World University Rankings
You can now view the list of publications across total Scholarly Outputs and the publications involving an International Collaboration, each considered in the THE World University Rankings. For further analysis, you can export the publication list or save it as a Publication Set.
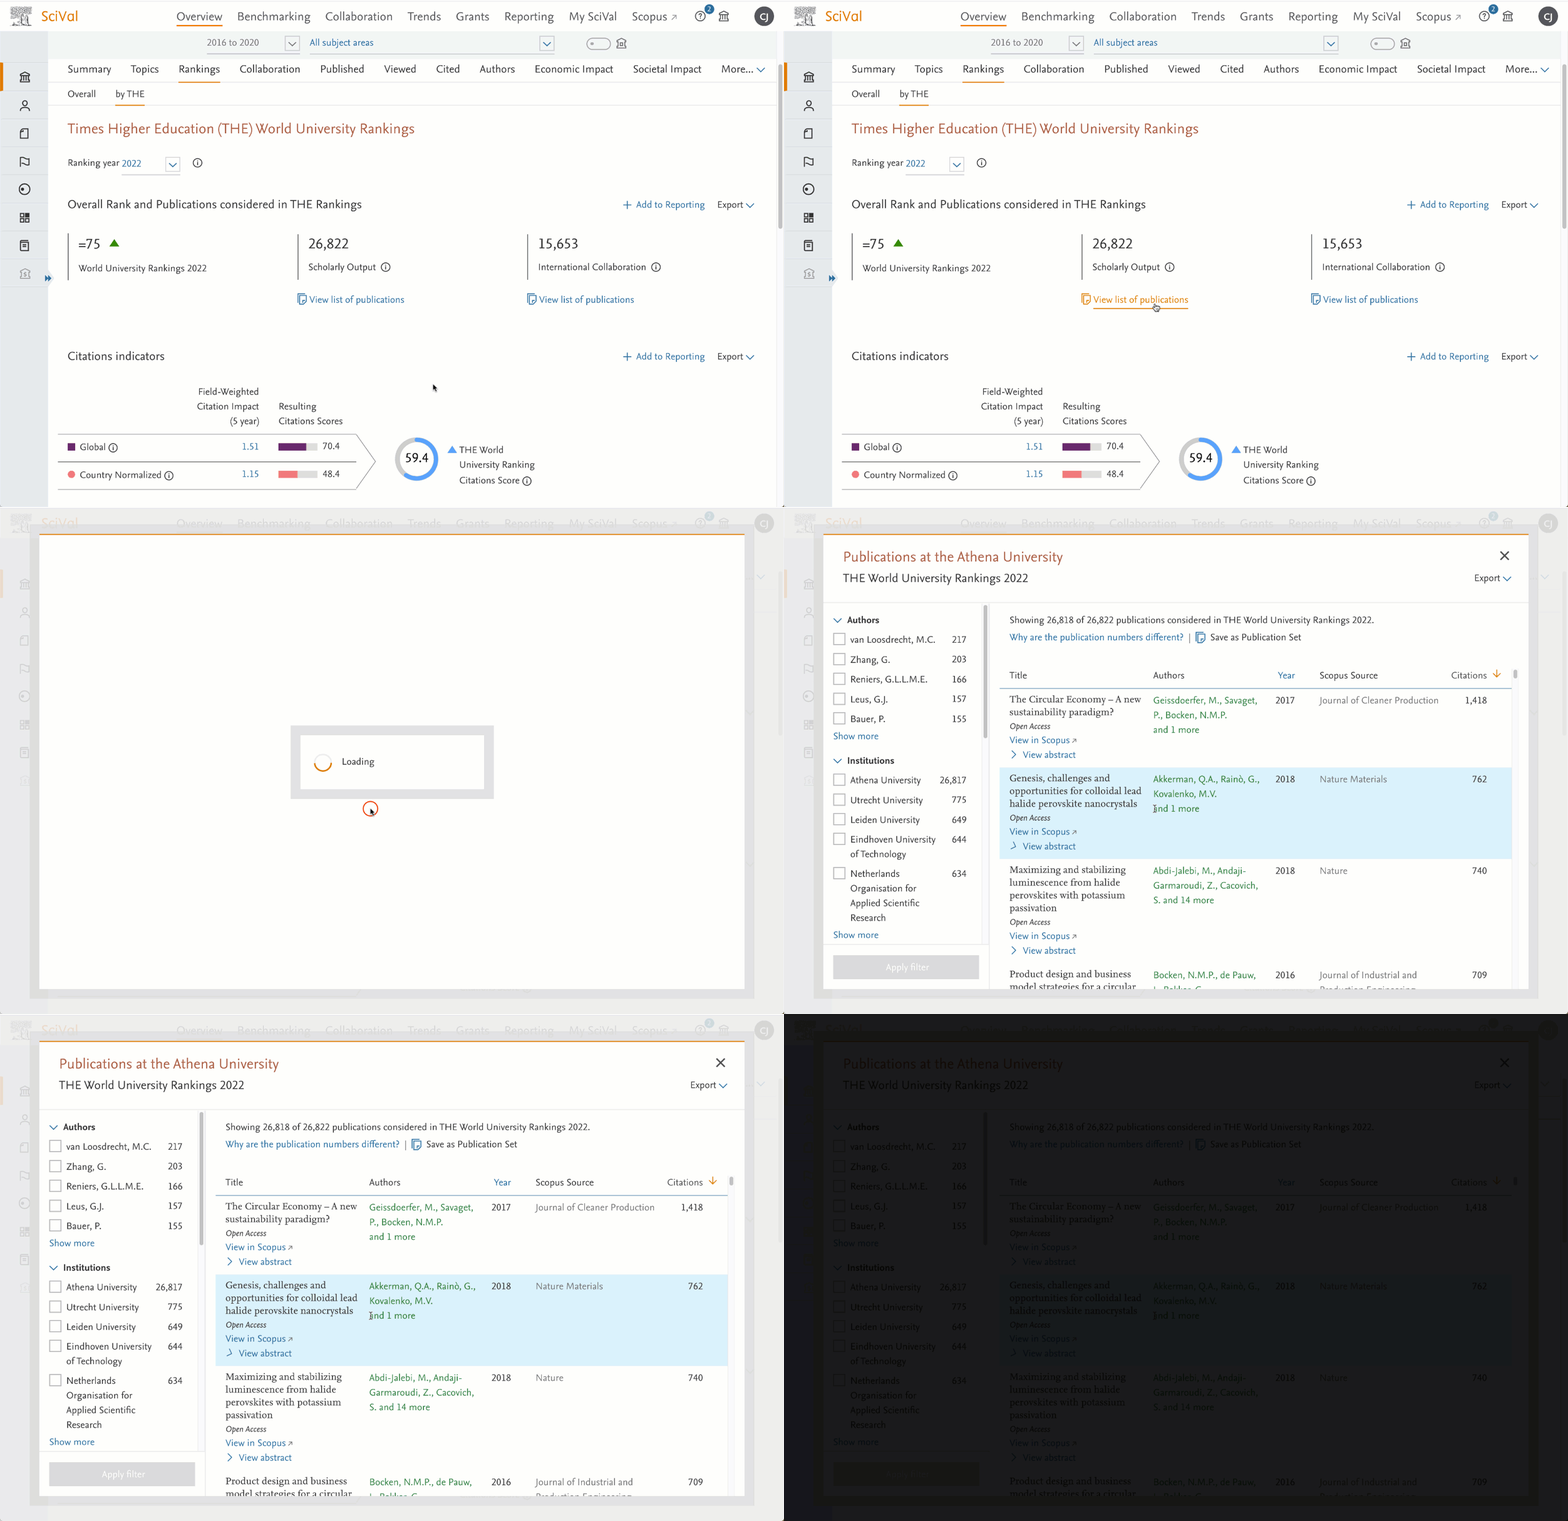
The Wolf release is split into two phases – phase 1 on August 24, 2021 and phase 2 on September 02, 2021. The first phase of this release brings the ability to compare Prominence Percentiles for Topics, improved search interoperability with Scopus and more context to funding intelligence in Grants. The second phase of this release will add functionality for analysis and comparison of the underlying publications used in the THE rankings as well as the bibliometric indicators for the 2022 THE World University Rankings.
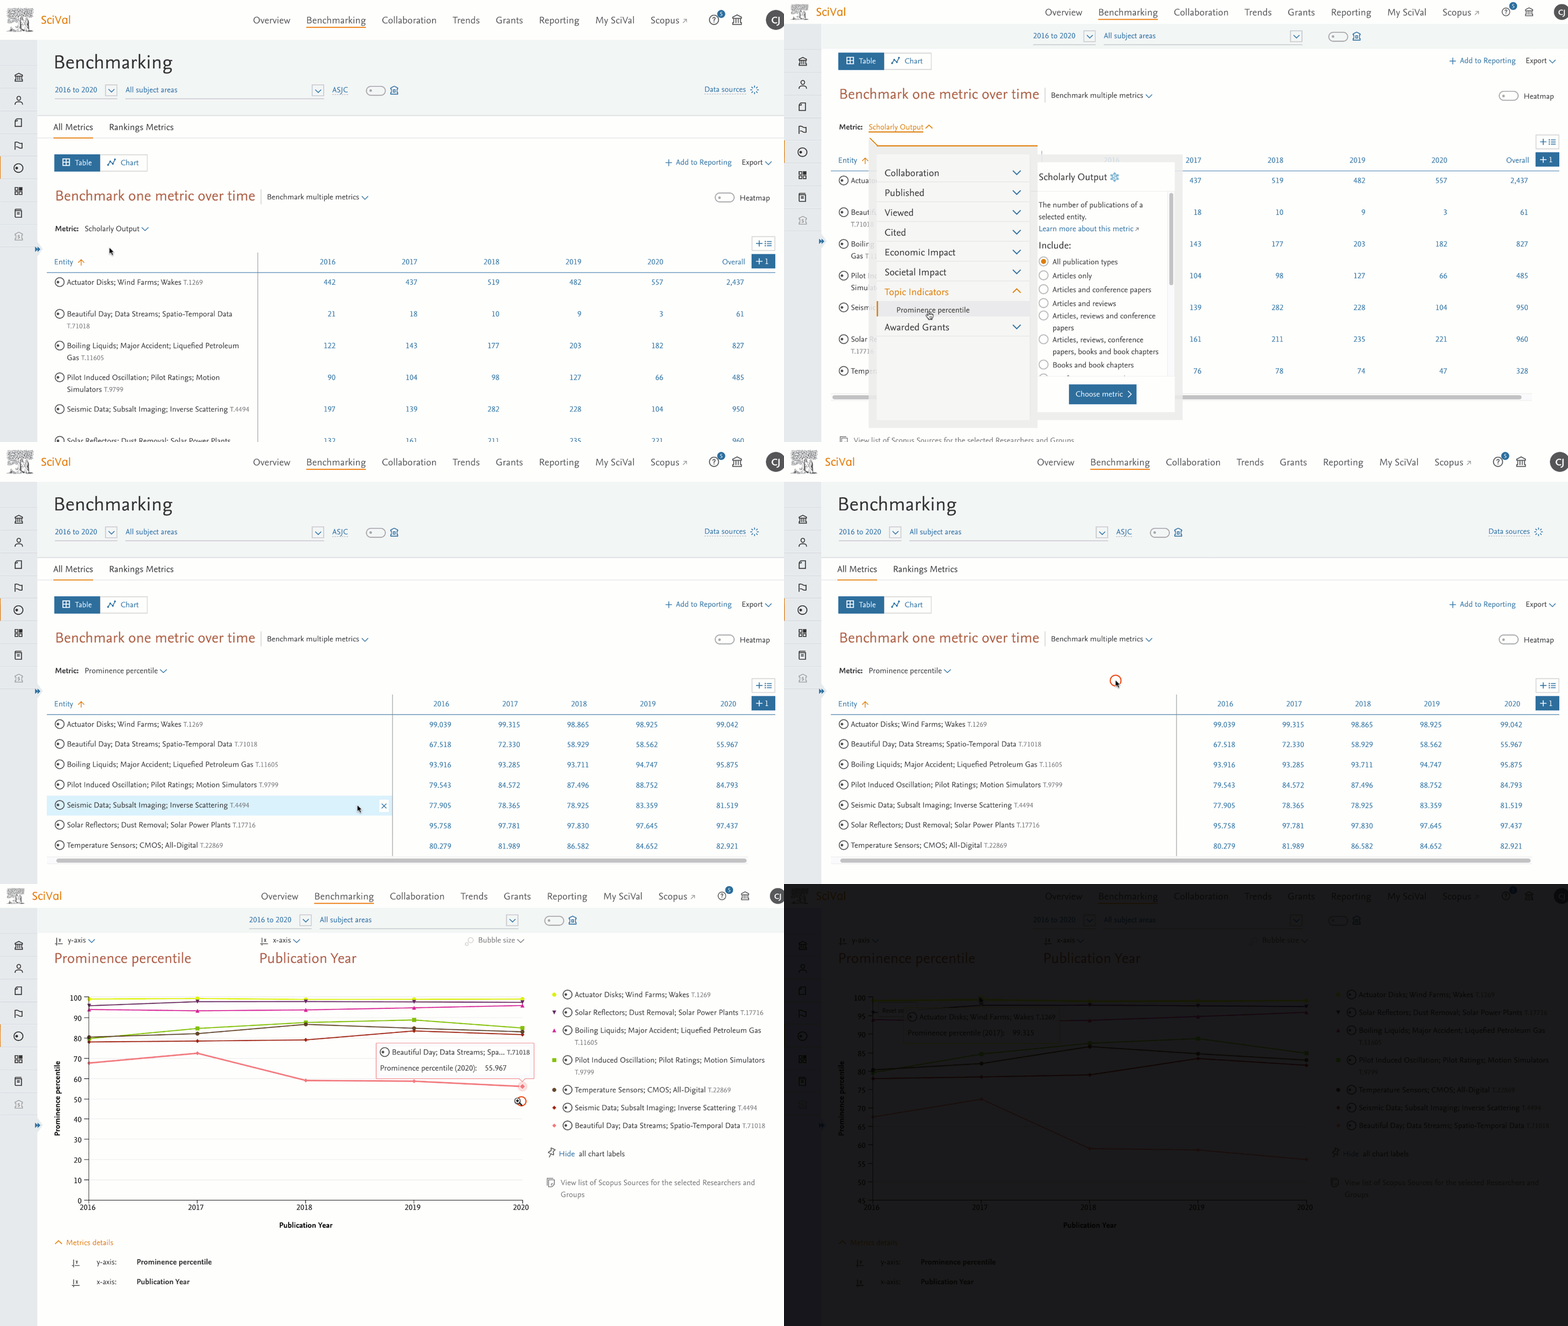
- Analyze and compare the change in the momentum of Topics and Topic Clusters over time
Compare the change in the Prominence percentile of Topics over the last five years and Topic Clusters over the last three years, to see how stable the momentum has been. These comparisons can be made in Benchmarking by selecting the Prominence percentile metric under the newly introduced Topic Indicators section.
- Improved search consistency and interoperability with Scopus
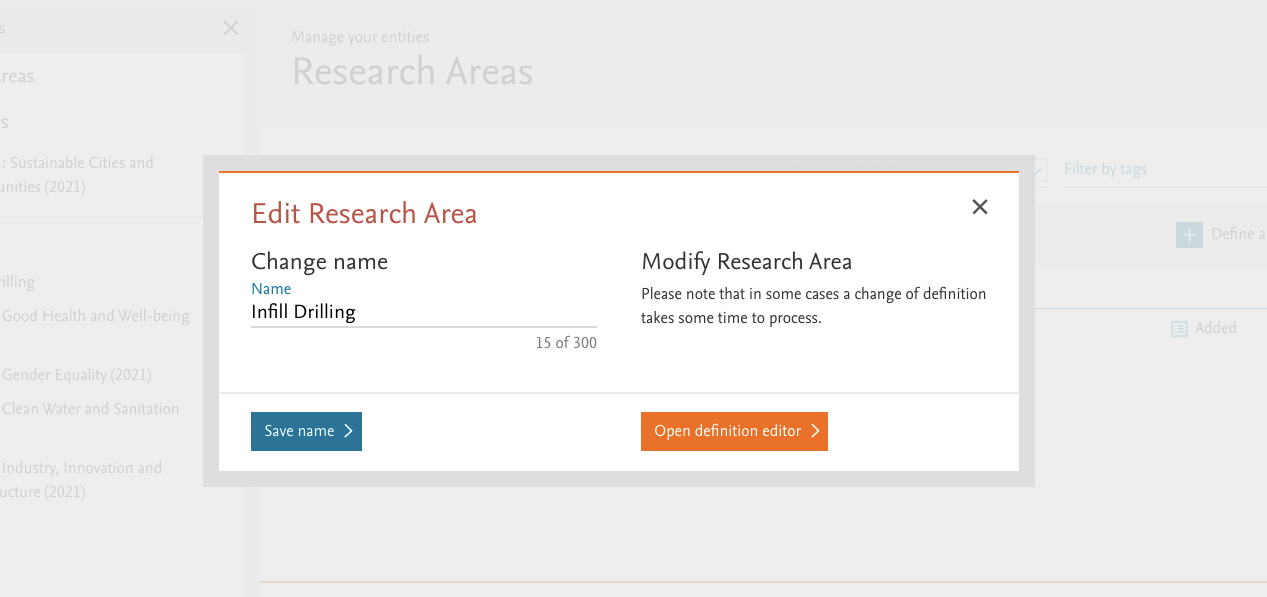
SciVal now indexes the Engineering and Medical controlled terms captured in Scopus. This means that your search conducted in SciVal when defining a Research Area, will now retrieve similar results to those achieved when running a search in Scopus. Use the definition editor to make the changes take effect in your existing Research Areas, or create a new Research Area to get the additional publications.
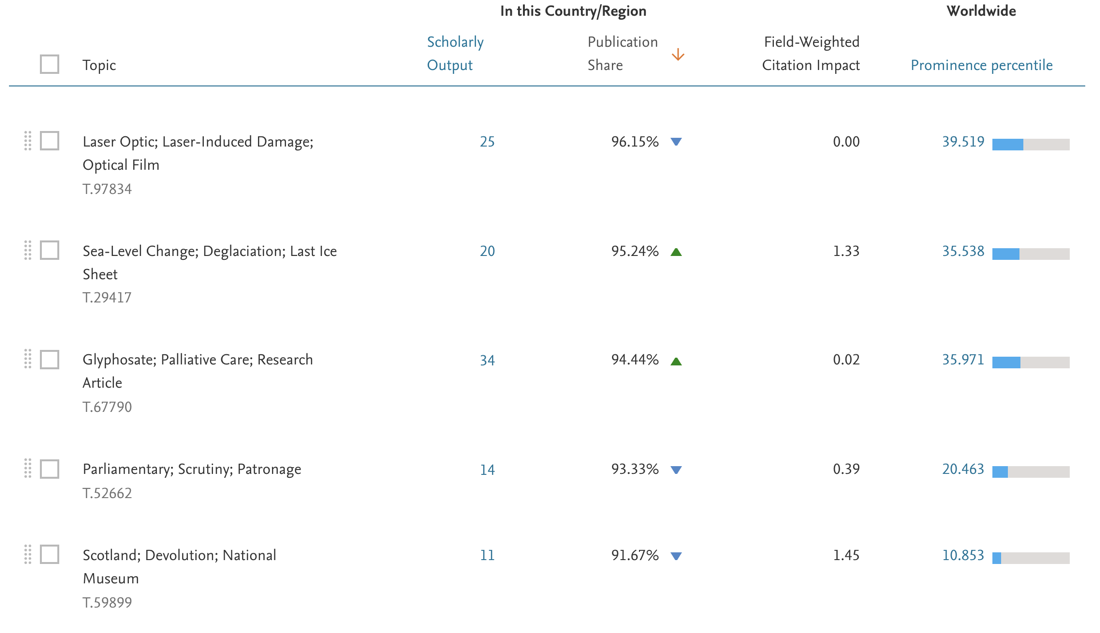
- Easily find the Topics to which you've contributed the most
You can now order a list of Topics by Publication Share and then see those Topics where you, or an entity you're looking at, have made the largest contribution.
Enhanced Funding intelligence in Grants through improved methodology
A new version of the Topic Expert Agents (TEA) has enabled awards with short descriptions to now be assigned to Topics of Prominence, expanding the number of Awarded Grants in the Grants module.
The July 13, 2021 release brings the ability to analyze the evolution of a Topic’s momentum, updates to the library of curated Research Areas on SciVal, new Funding bodies on the Grants module and numerous usability improvements.
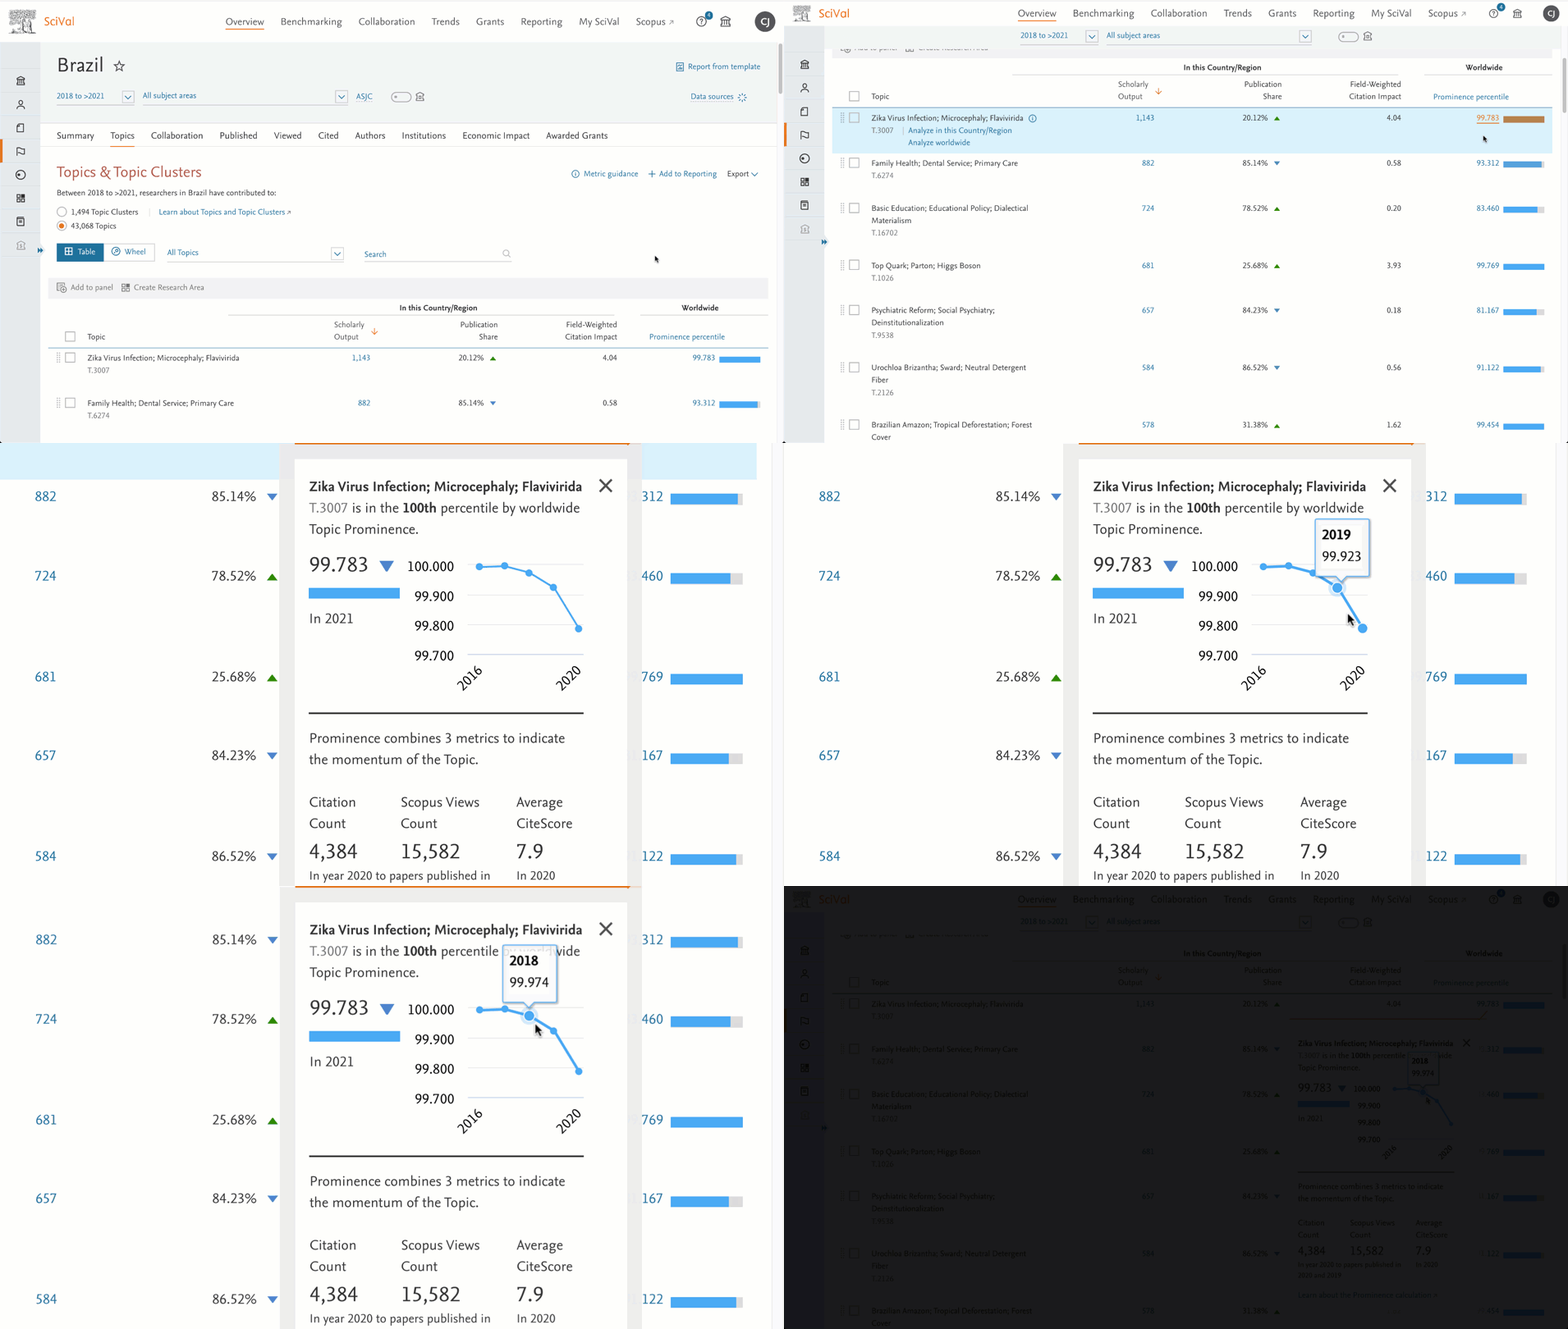
- Analyze the evolution of a Topic's momentum
Understand the change in a Topic's Prominence Percentile over the last five years. The values can be viewed in the tooltip by clicking on the Prominence percentile number in the Table and Wheel views in the Overview module or in the Summary and Related Topics tabs of the Trends module. In a following release, it will be possible to compare Topic and Topic Cluster momentum over time in the Benchmarking module.
- Create Research Areas using Topic Clusters
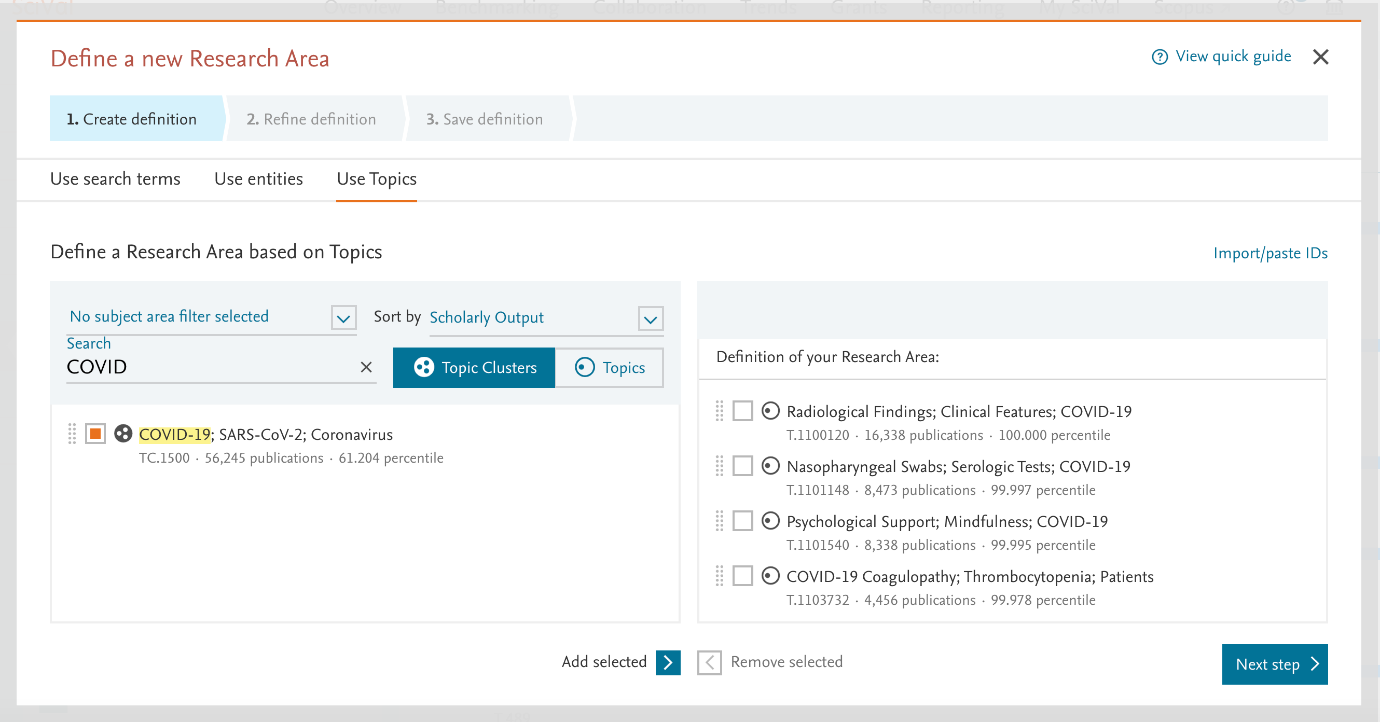
In addition to using Topics in the definition of a new Research Area, you can also now use Topic Clusters, or a combination of Topics and Topic Clusters. The maximum limit of 100,000 publications for Research Areas still applies but you can use filters or limit the publication year range to reduce the number of matching publications below the limit.
- Easily compare metrics for entities using selected keyphrases in Trends
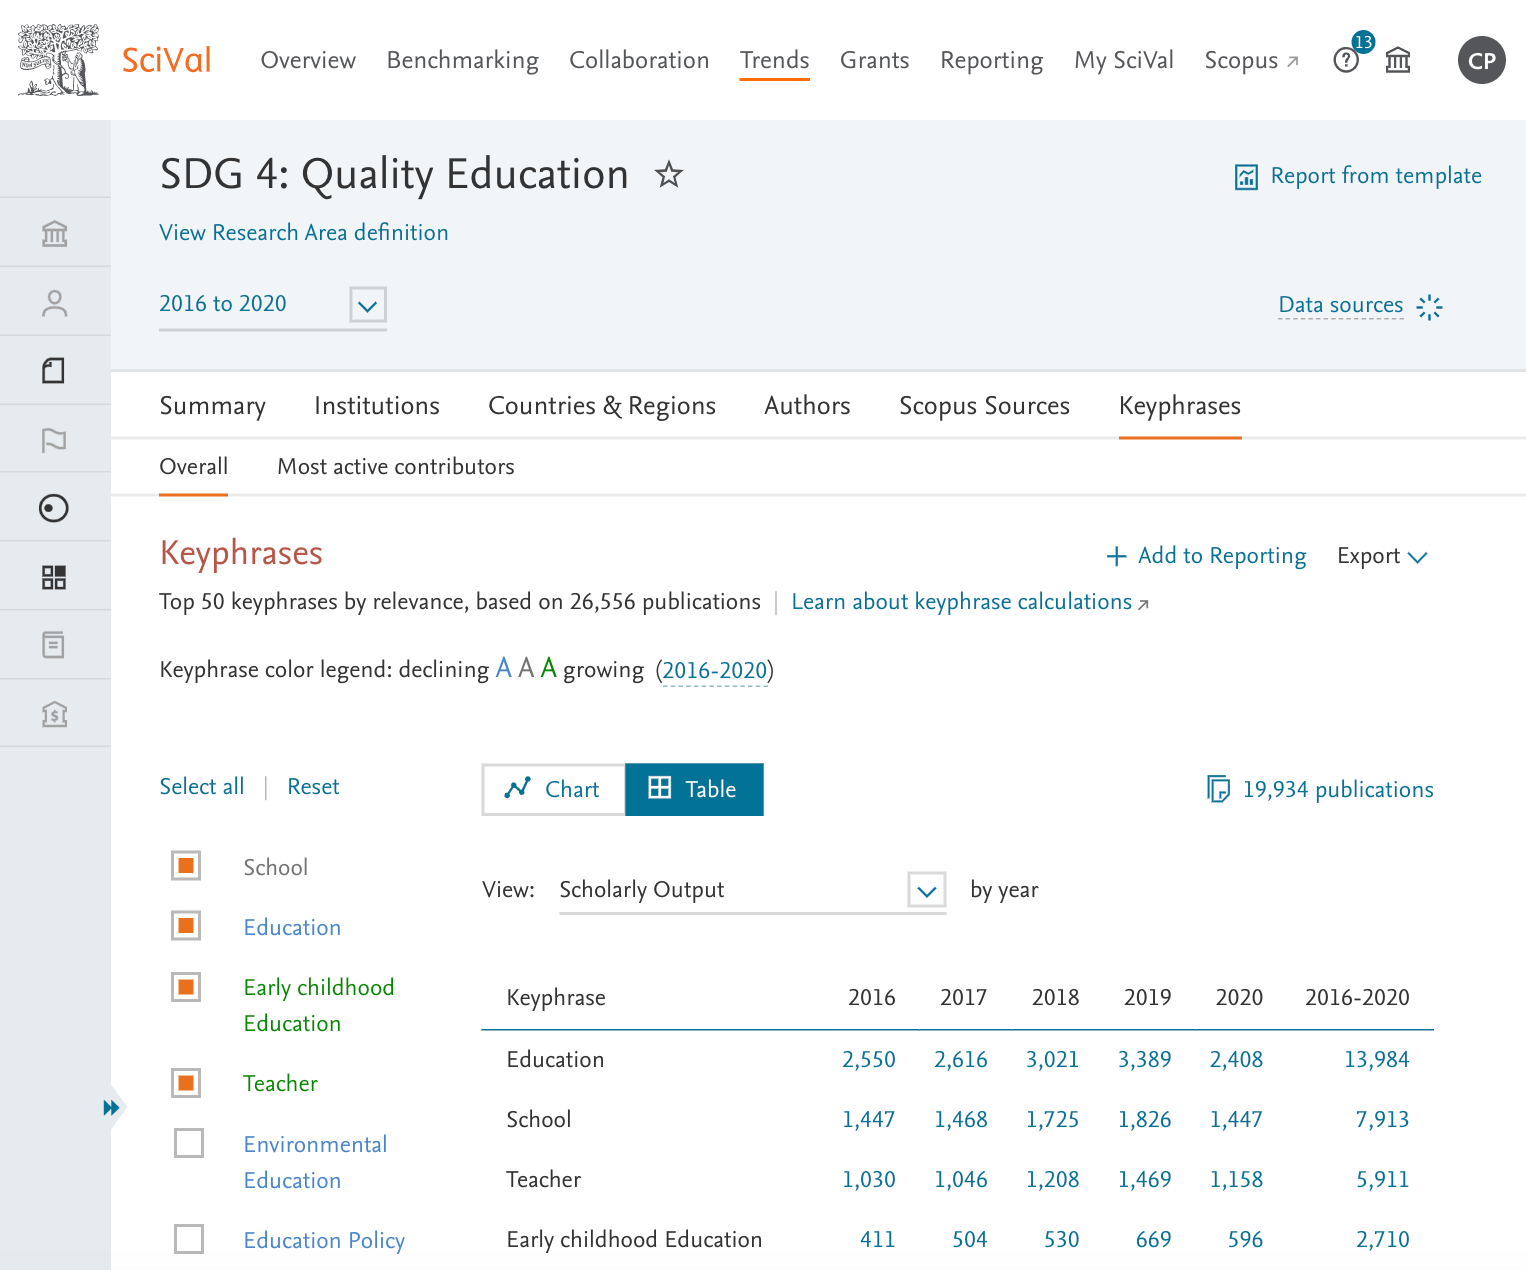
A new tabular view makes it easier to compare metrics for entities using the selected keyphrases. It is also now easier to find and export the most active contributors using the selected keyphrases with a dedicated sub tab.
- Two new expert curated Quantum Research Areas
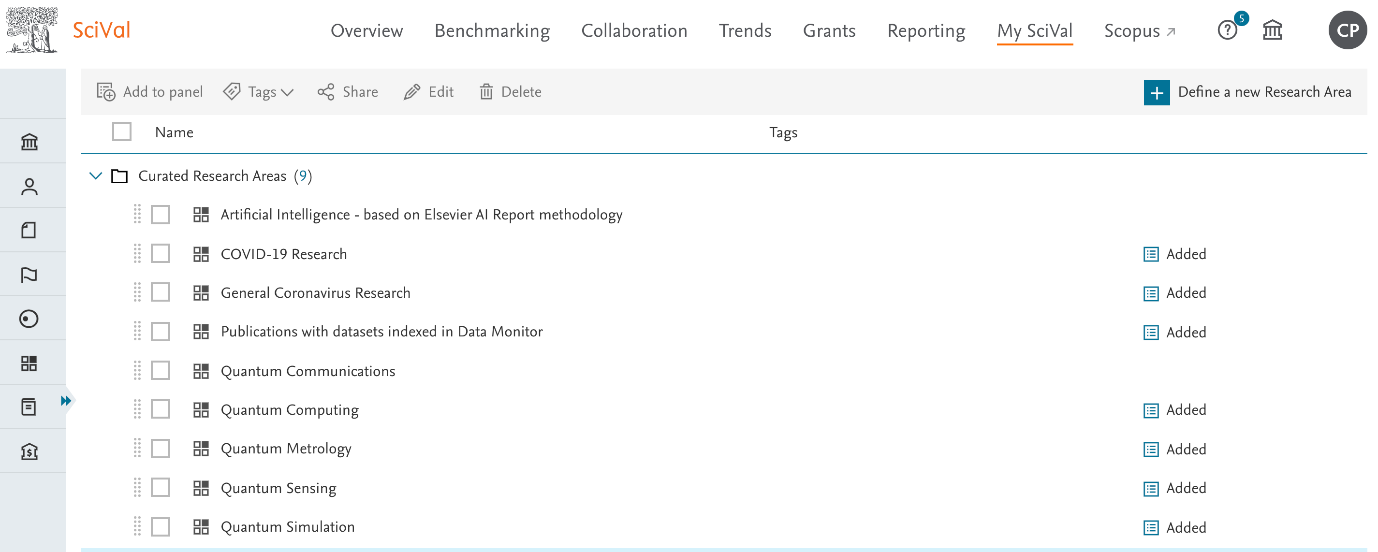
Through customer feedback, we've added a further two expert curated Quantum Research areas – Quantum Communication and Quantum Technologies. We have also updated the following curated Research Areas with recent publications: COVID-19, General Coronavirus Research Areas, Quantum Computing, Quantum Sensing, Quantum Simulation and Quantum Metrology.
- More Funding bodies and deeper analytical capabilities in the Grants module
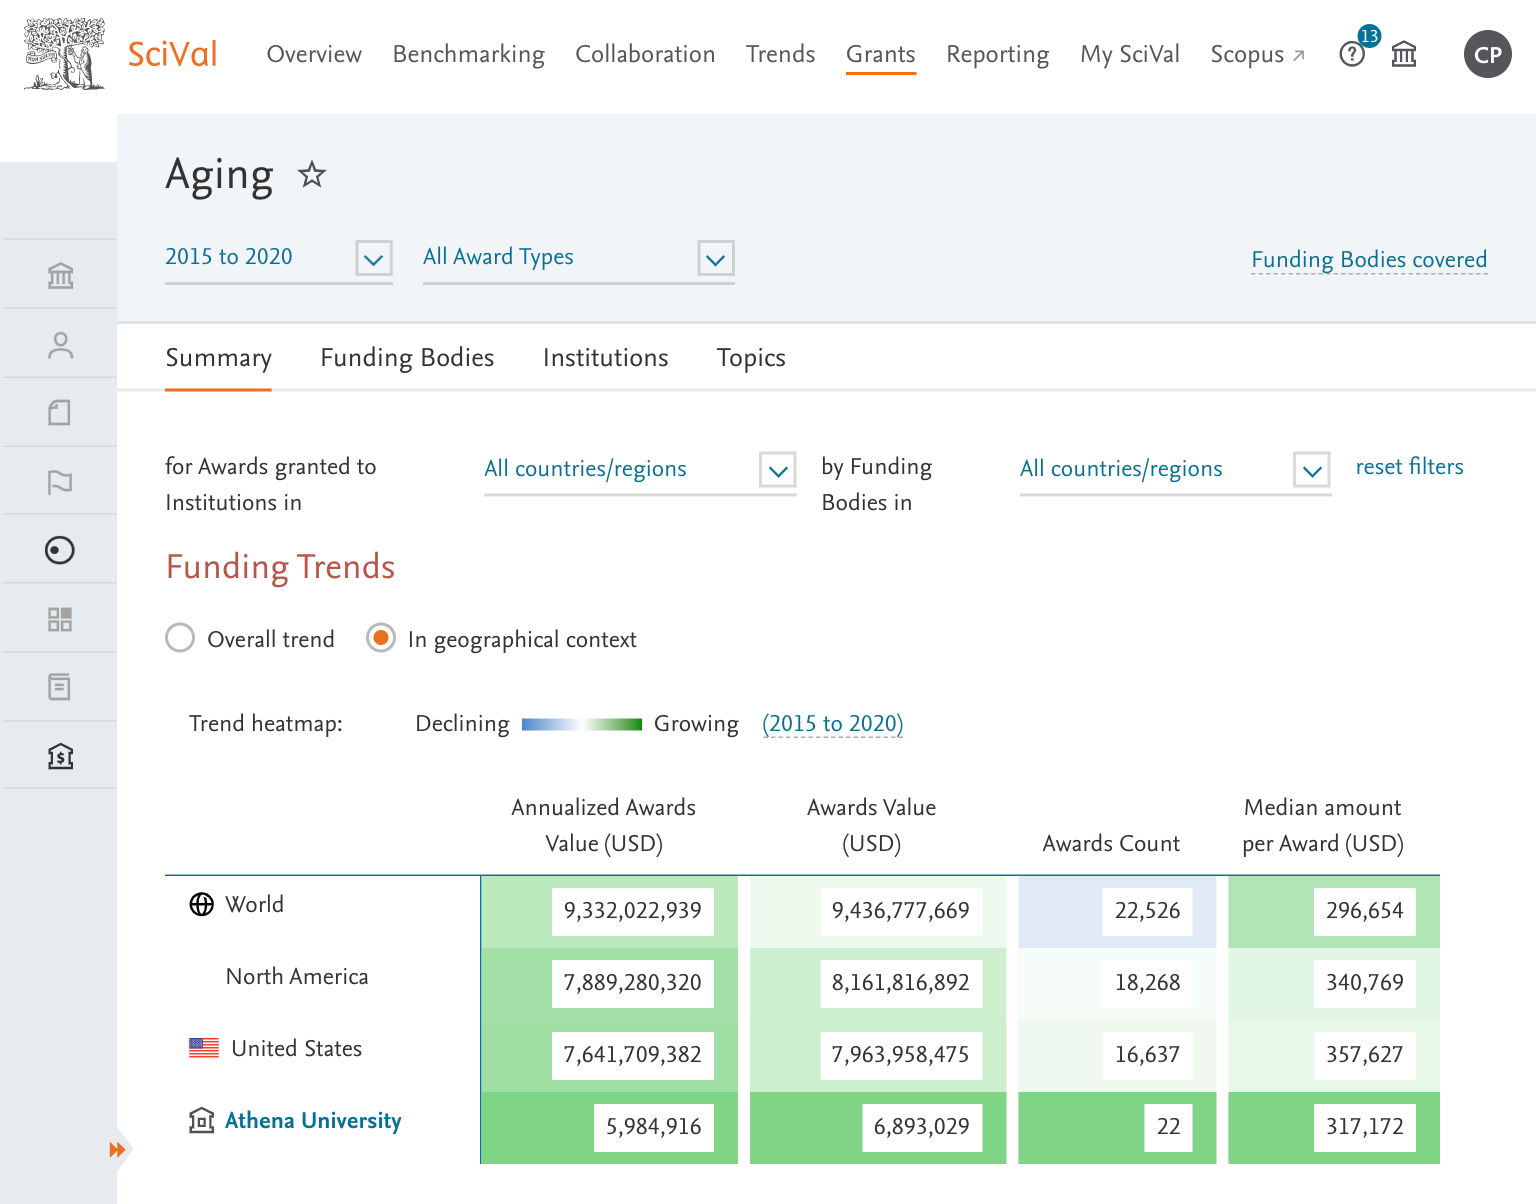
Perform funding landscape analyses with additional evidence of funding from a broader set of Funding bodies, with the addition of more US foundations and Funding bodies from New Zealand. More context is now available for funding performance analyses of the home institution in Topics, Topic Clusters and Topic Groups with the addition of geographical context to Funding Trends.
- Usability improvements
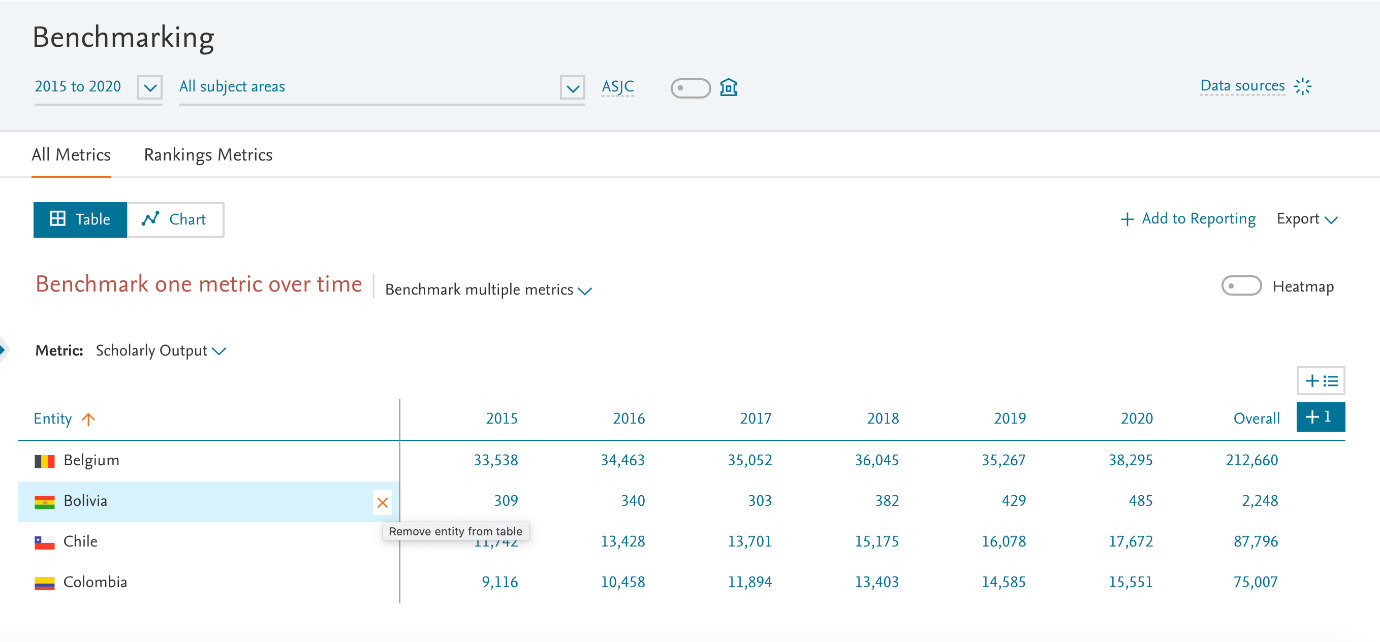
Easily edit your Benchmarking selection by removing entities directly from the table, just like you can from the Chart.
Searching for institution groups has become more efficient with built-in category suggestions. SciVal has many pre-created institution groups, such as in the UK there are the Russell Group, Universities in Scotland, University Alliance etc. In the search box in My SciVal, type the name of a group or institution you're interested in and SciVal will show the matching institutions and suggested group filters to use.
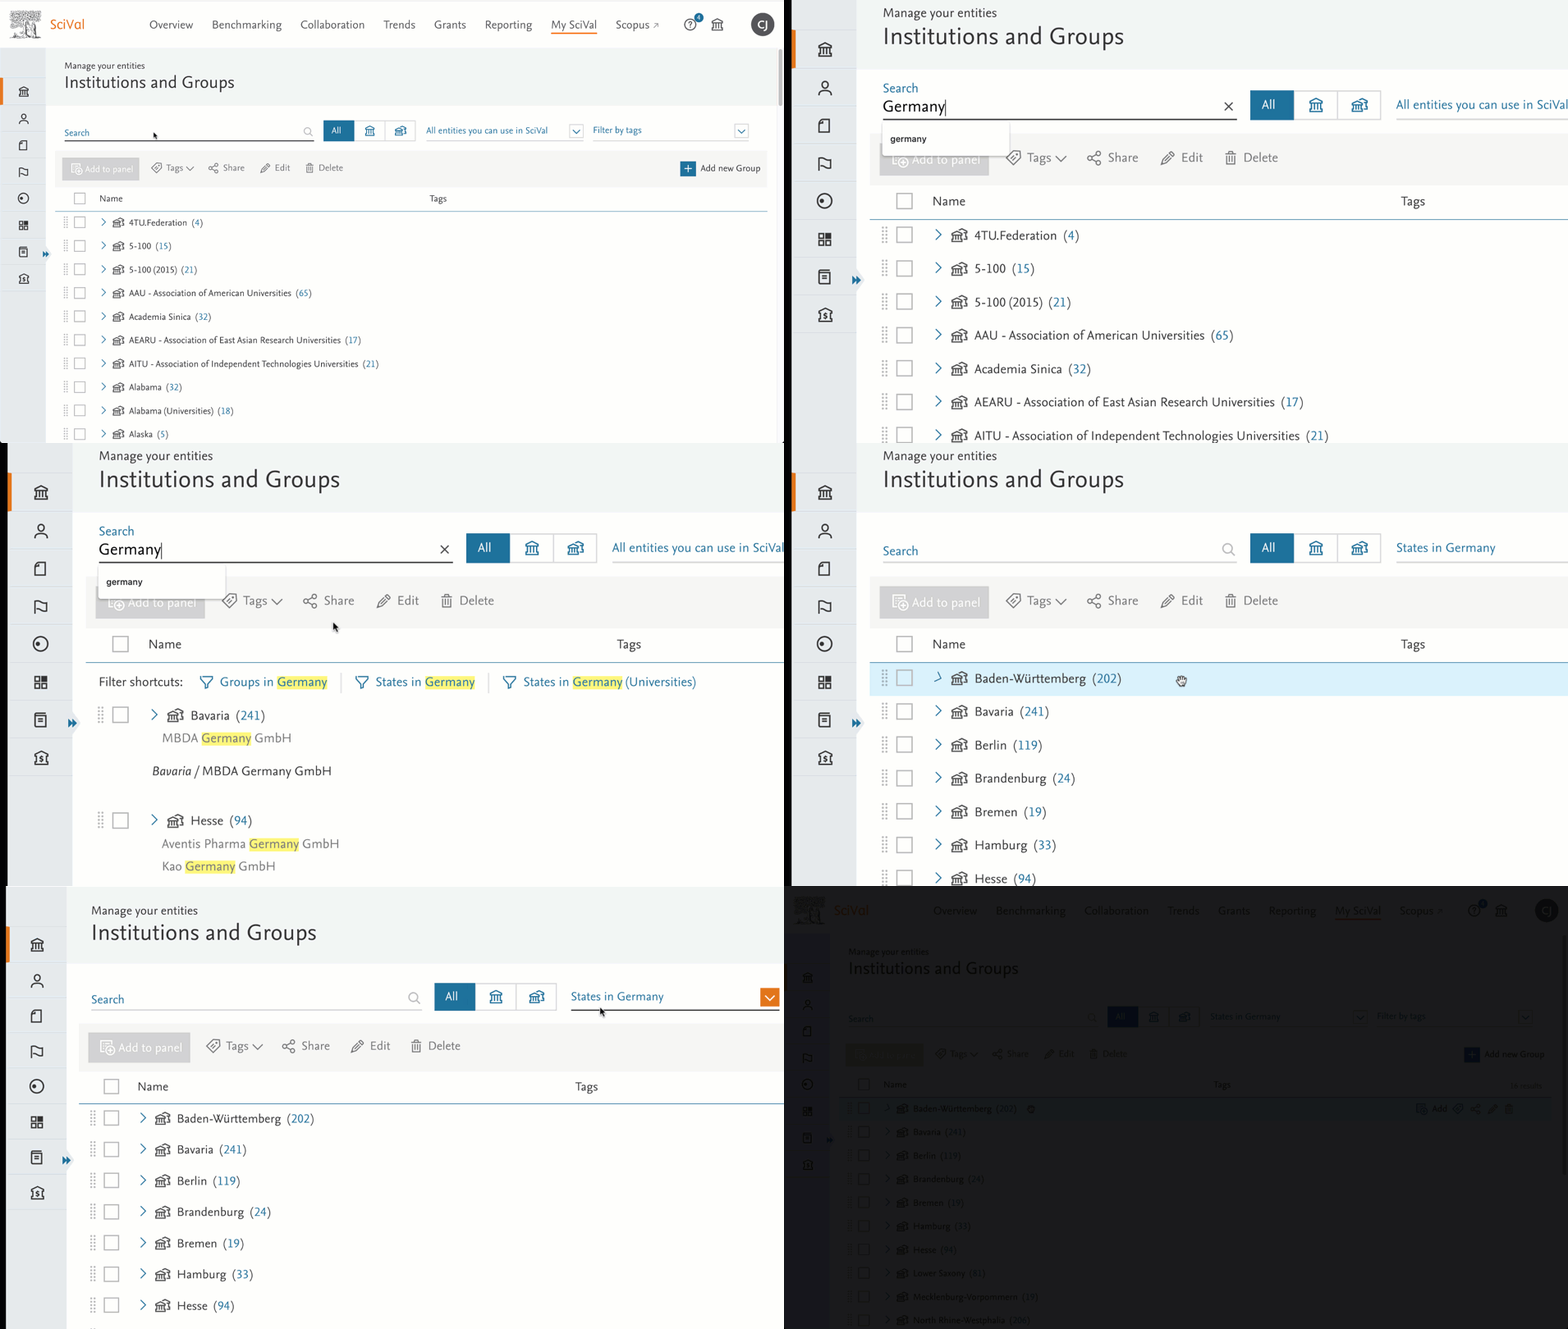
Also, analyzing members of a group is easier with the added ability to select and deselect all members of a group when a group is expanded.
The June 15, 2021 release brings updates to Topics as part of our yearly rollover, enhanced metrics guidance and a new way to benchmark the entities within a group in Benchmarking:
- Yearly rollover and Topics update
Each year in June, the Scopus content for the previous year (i.e. 2020) is over 95% complete. This is the point we consider it a “complete year” and we then move our pre-defined time ranges in the Overview, Collaboration and Trends modules, forward by one year. The new ranges and other Topic updates have been used to make a number of changes to the Topics and Topic Clusters as below:- Recalculate the Prominence Percentiles for all Topics and Topic Clusters using the 2020 CiteScore metrics
- Reallocate papers published in 2018 from their current Topic to a more dominant Topic where applicable
- Implement a set of minimum criteria that a new publication in Scopus must have before it can be linked to a Topic, which helps to improve the tightness of publications mapped within each Topic
- We have applied the same criteria to all publications from 1996 and have removed 950,000 publications from existing Topics, which did not have enough metadata to accurately assign them to a Topic
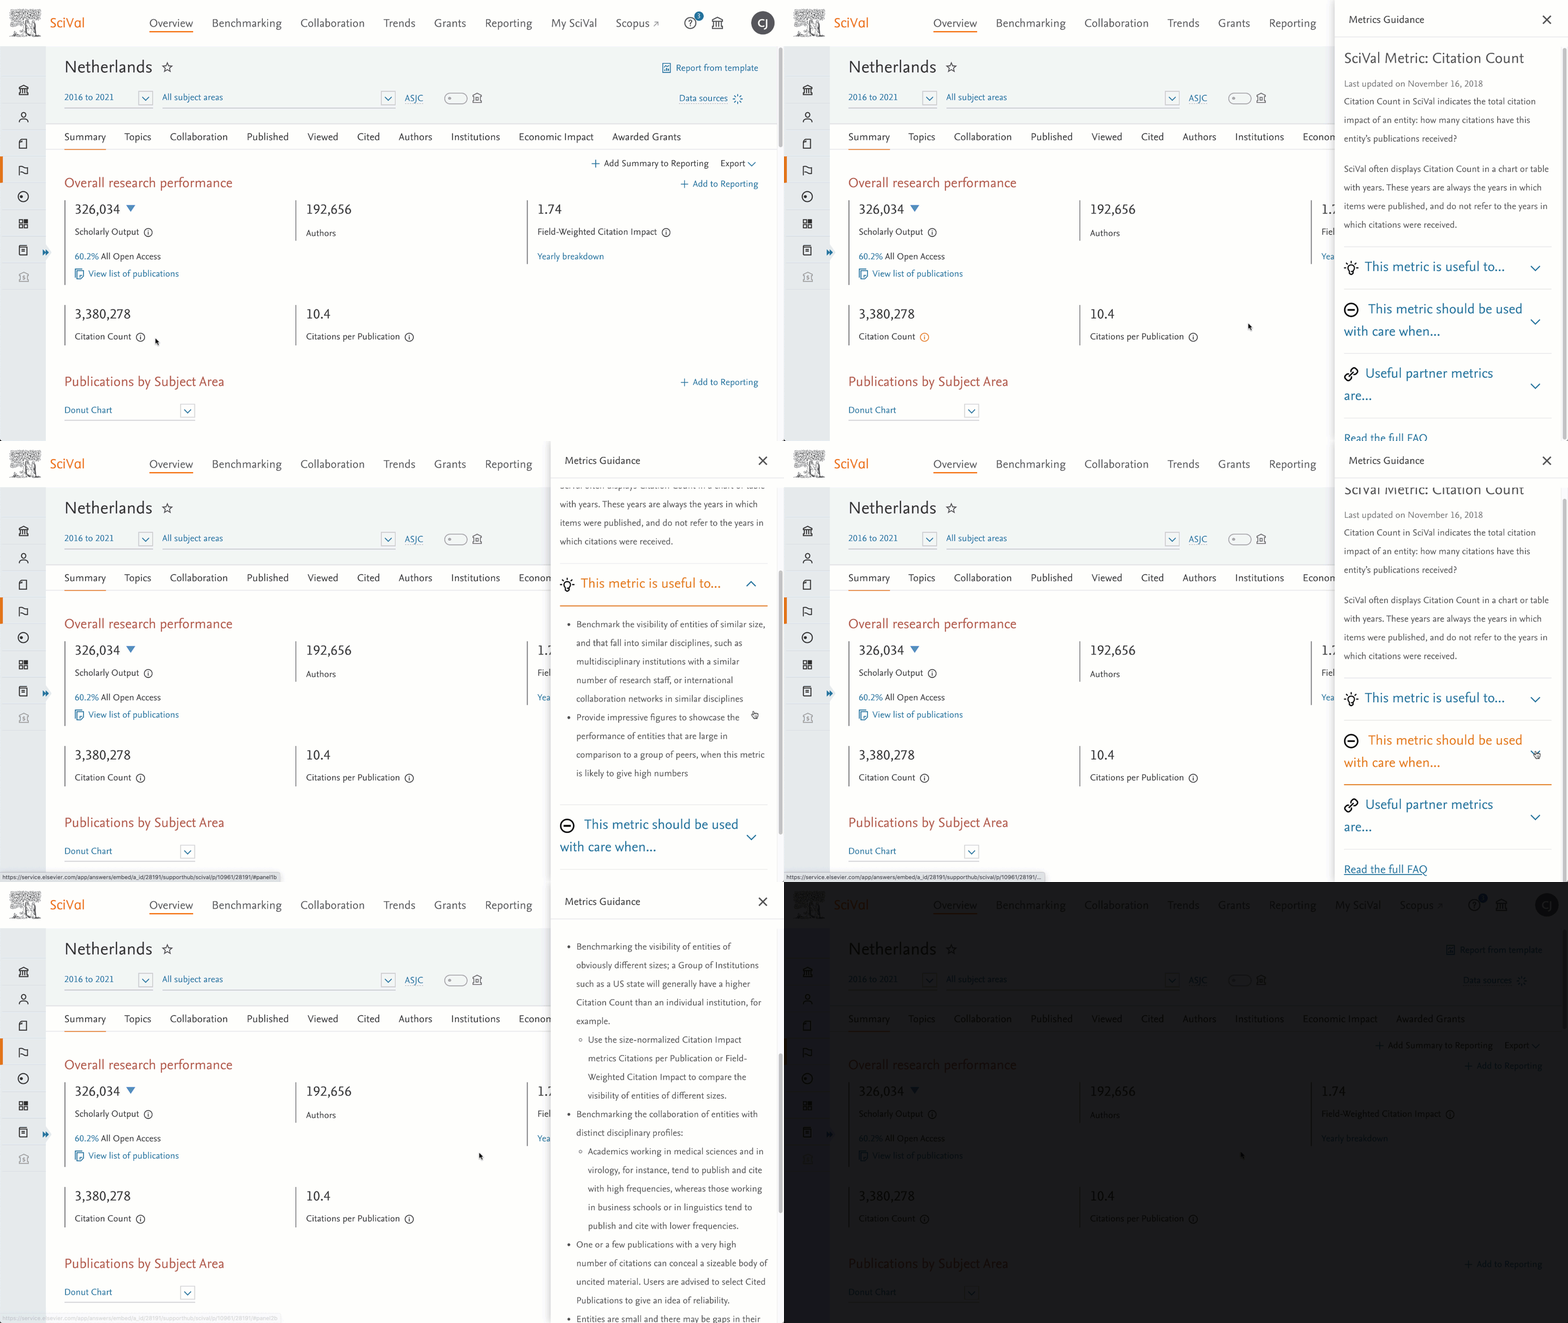
- Enhanced metrics guidance gives greater context
SciVal now brings rich information about each metric directly into the page you’re looking at. This allows you to learn more about the strengths and weaknesses of the metric in context, so you can better interpret its meaning. Click on the info icon or Metrics guidance link and detailed information from the Support Centre is pulled into a panel on the right.
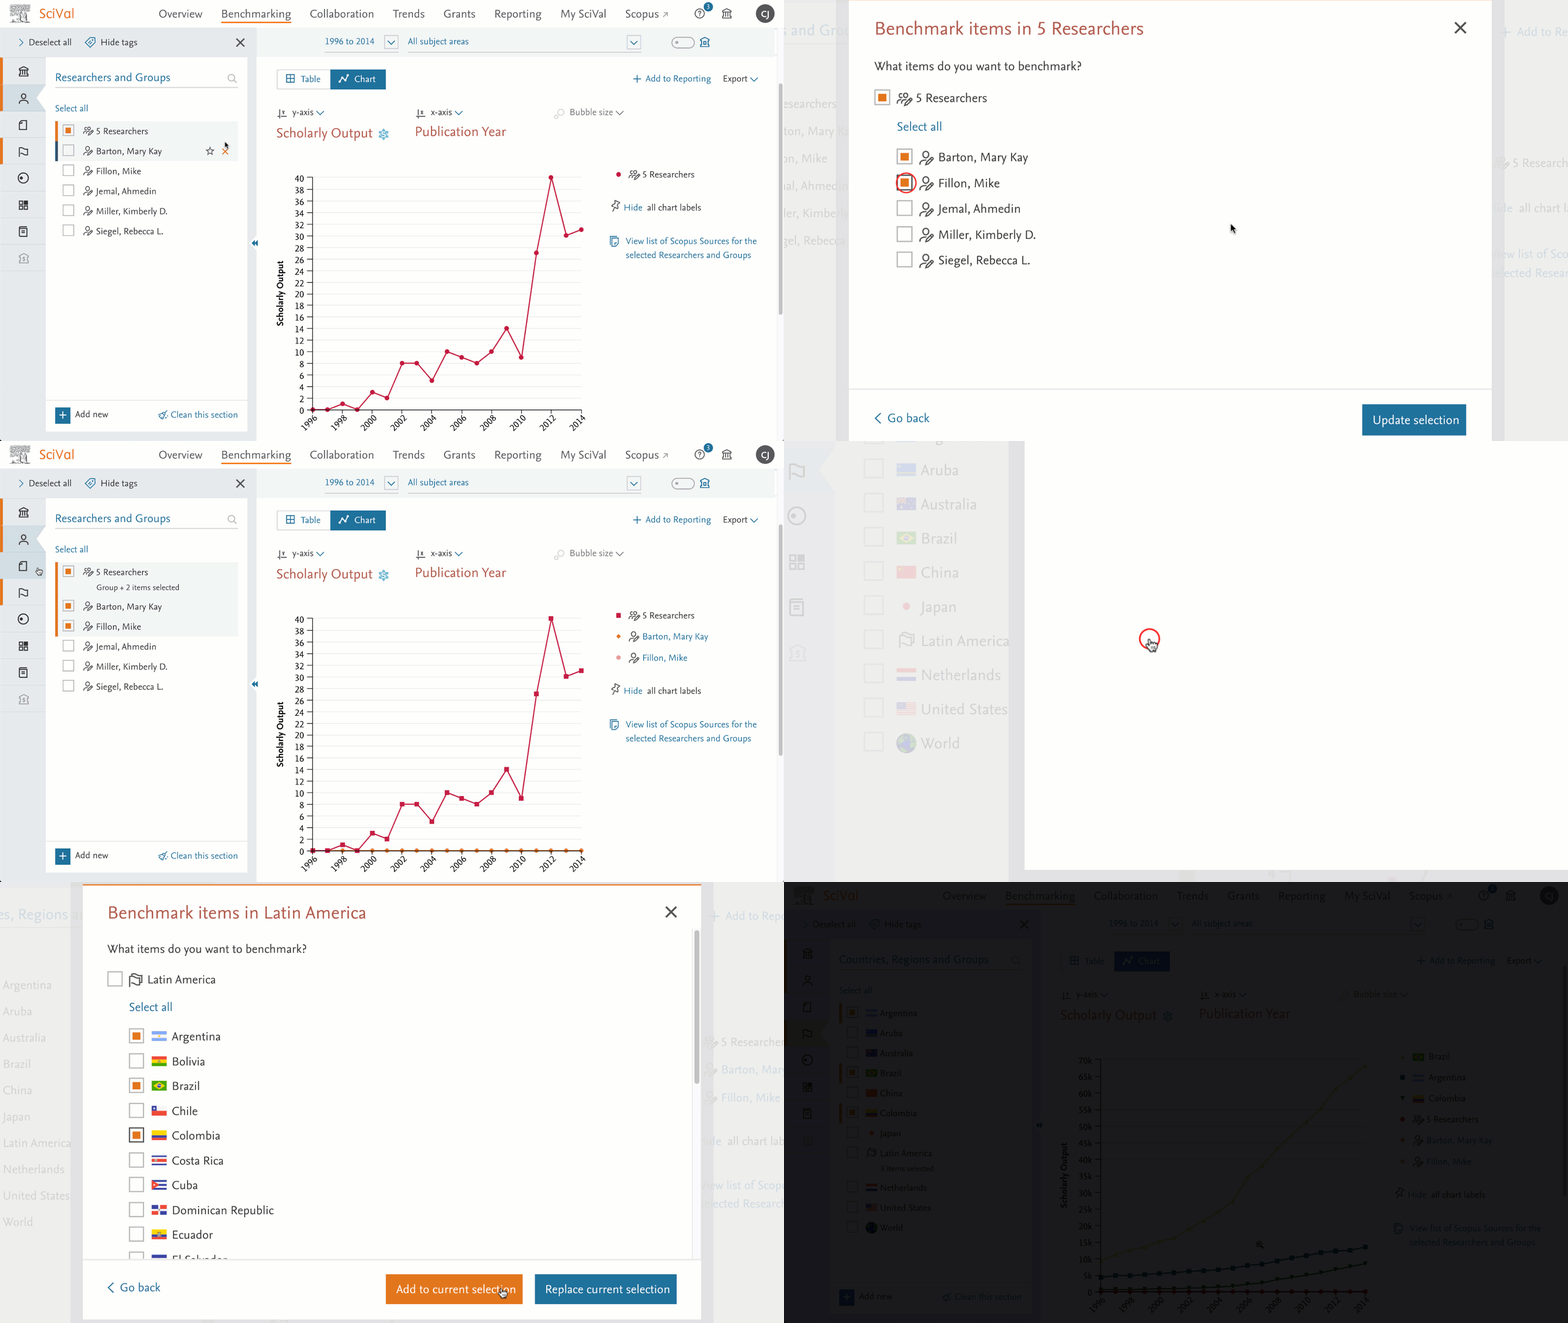
- Easily benchmark entities within a group
We’ve added a quick way to identify the entities within a group and select some or all of them to benchmark further. For any group of Researchers, Institutions or Countries, click the arrow and make your selection. Easy!
- Heatmaps added to the tables in Benchmarking
Get a quick overview of the highest and lowest metric values in the Benchmark table view, then export or add them to Reporting for further analysis.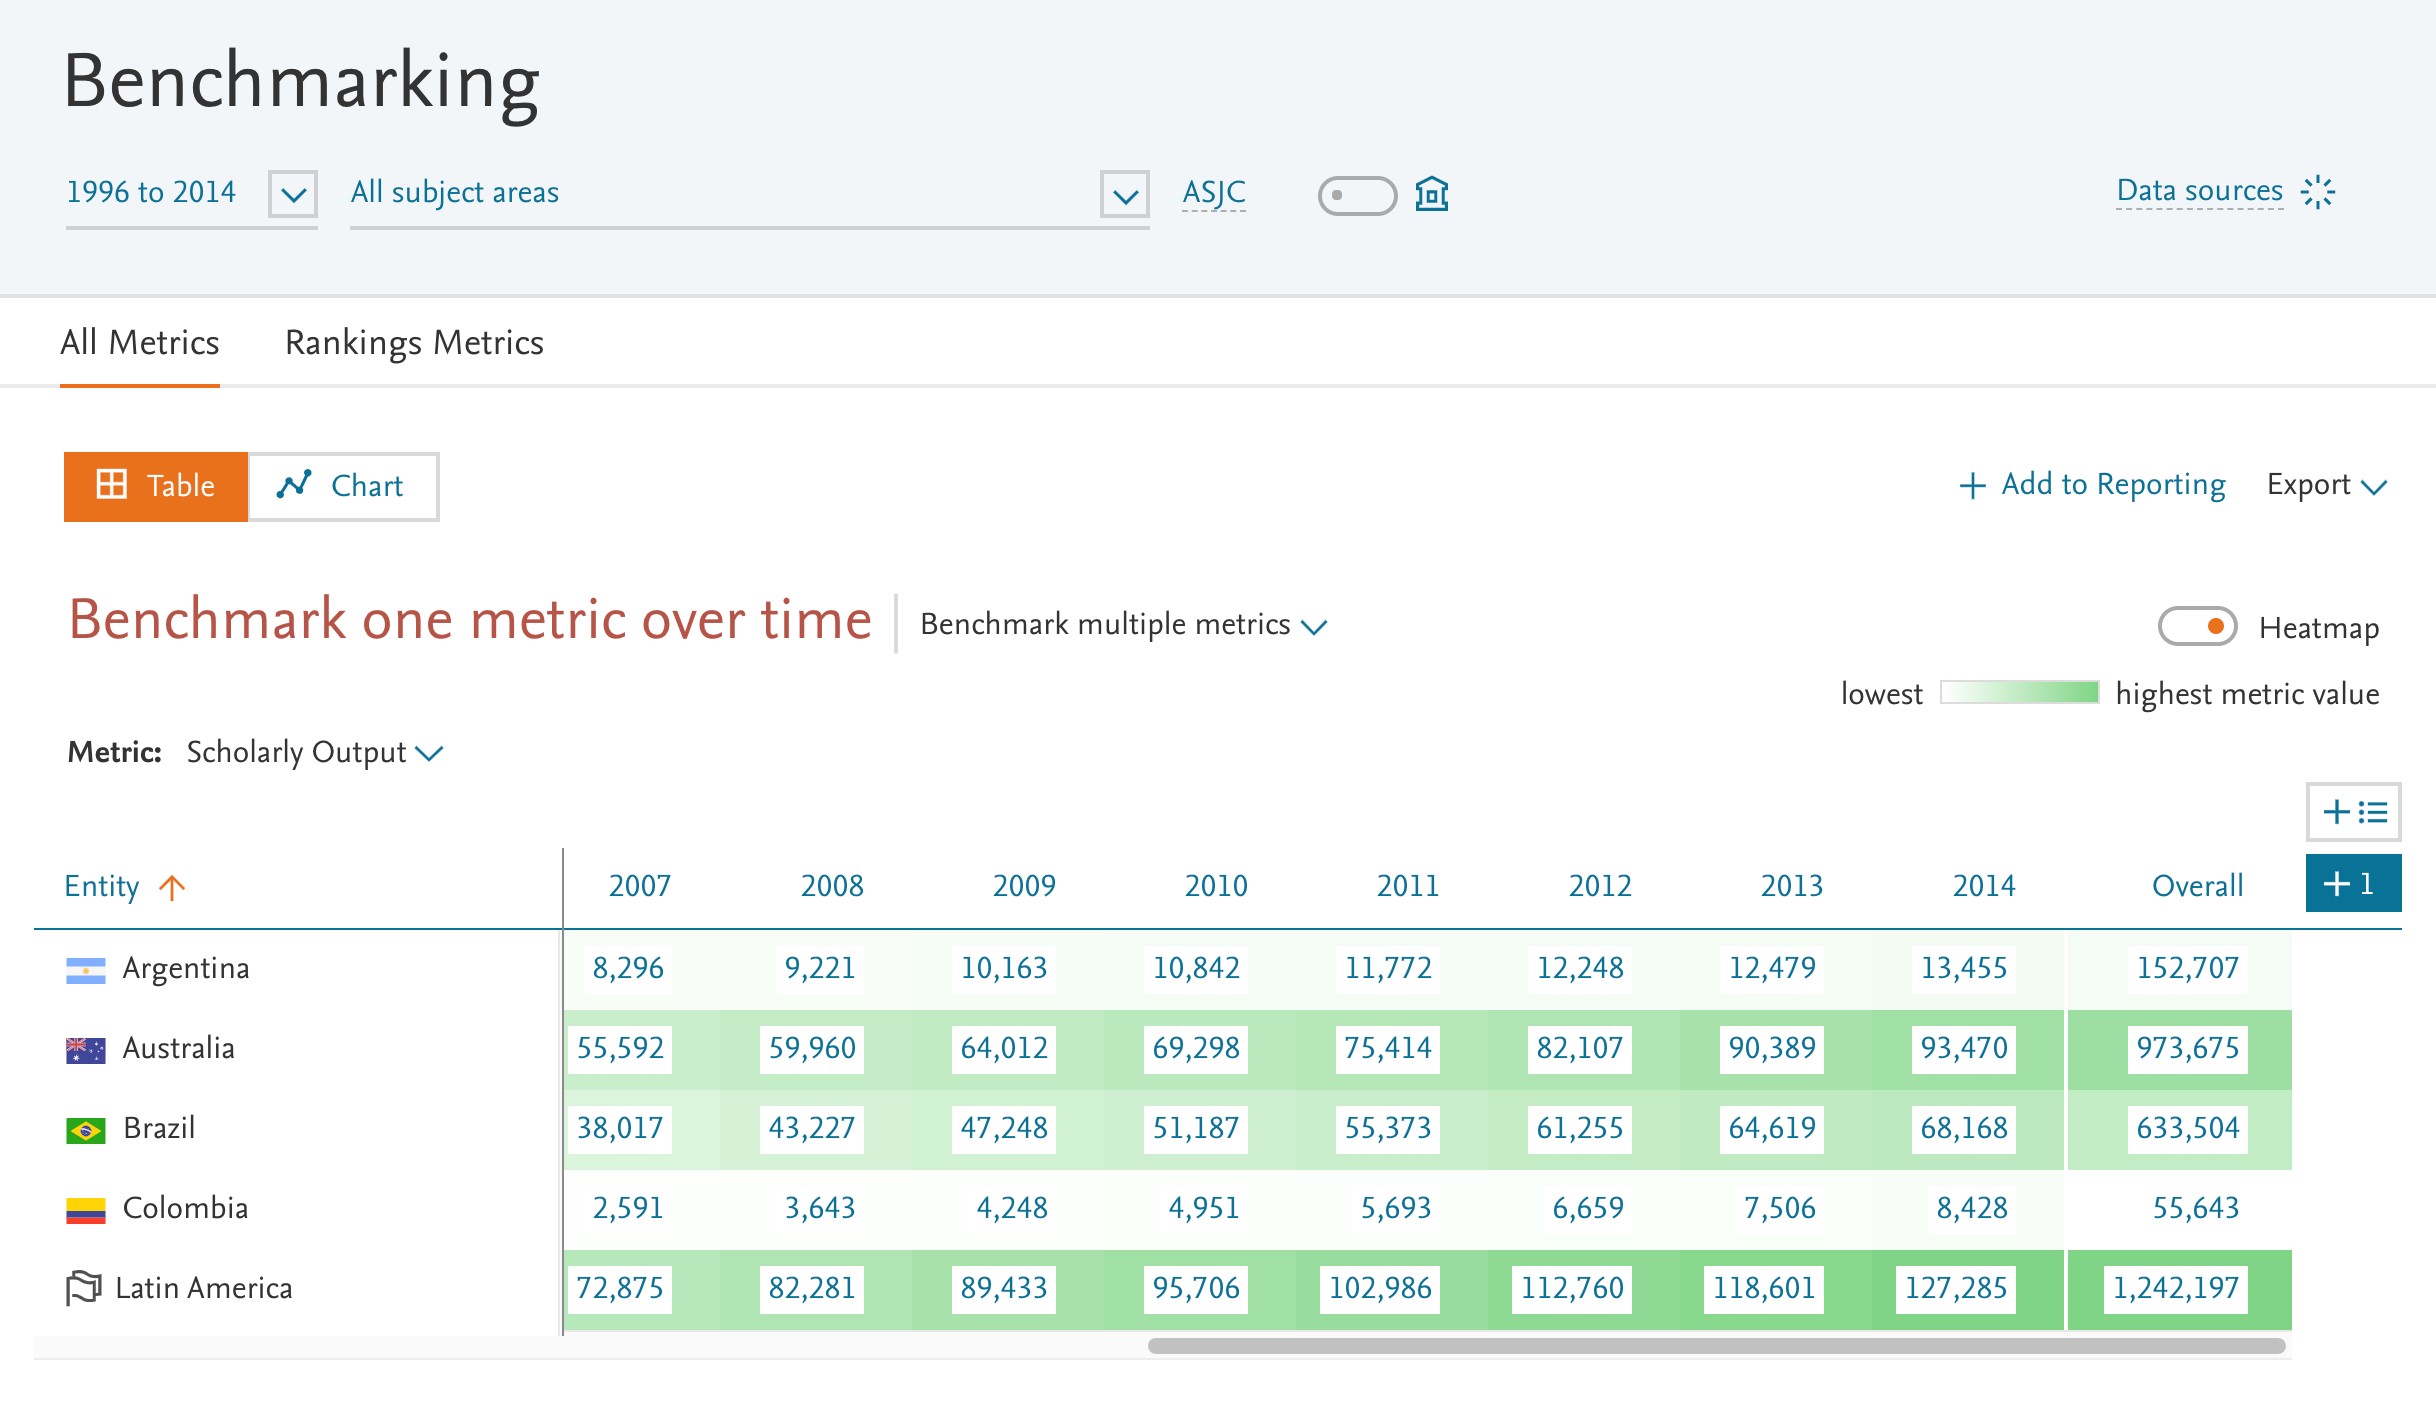
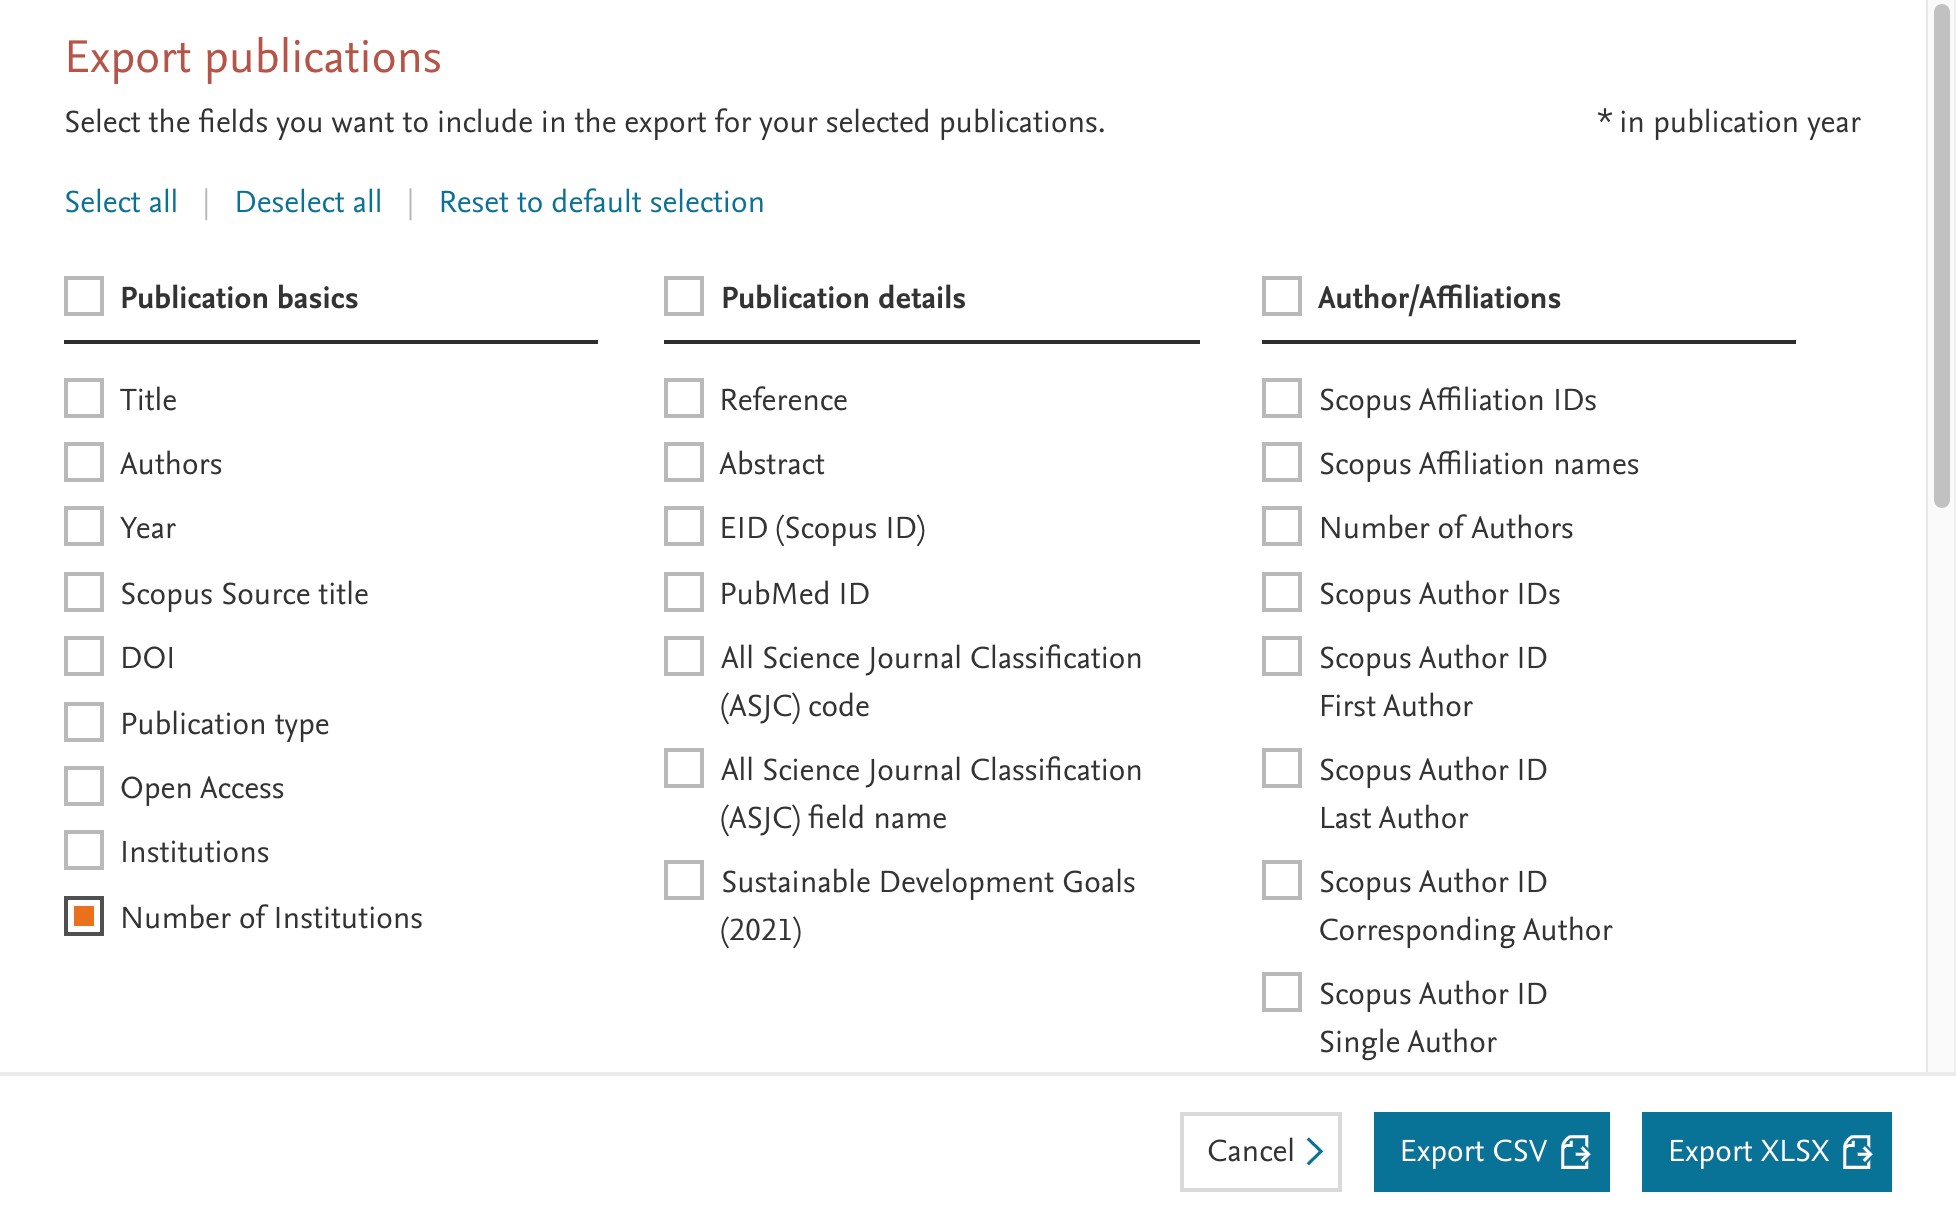
- Additional transparency for the FWCI with the Field-Citation Average
This new metric lets you see what the expected number of citations are for the publication you’re looking at, taking the subject area, publication type and year into account. Available as an option in the updated publications export, the Field-Citation Average provides additional insight into one of the most used and sophisticated metrics in SciVal.
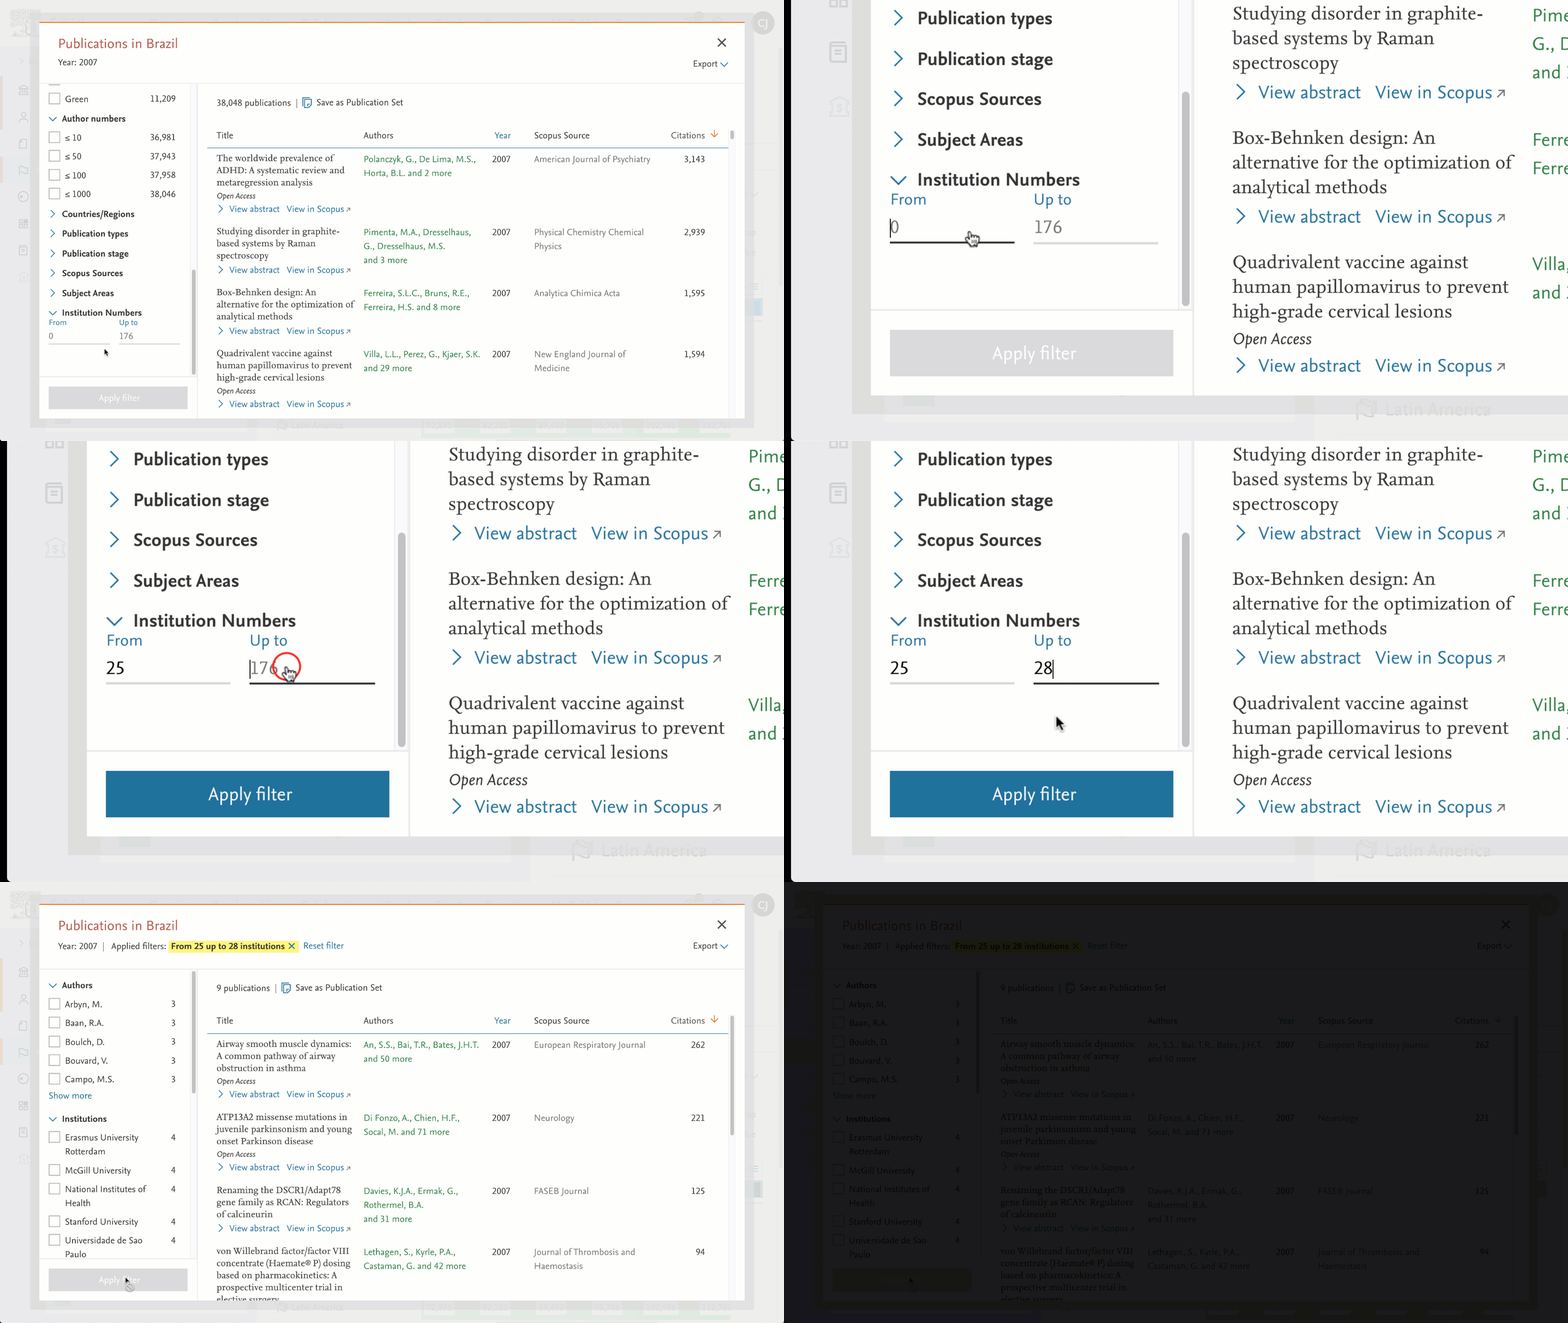
- Filter publications by number of institutions
See only publications with your desired number of co-authoring institutions. Choose the minimum and maximum numbers and export or analyze the results further as a Publication Set.
- New Researcher homepage
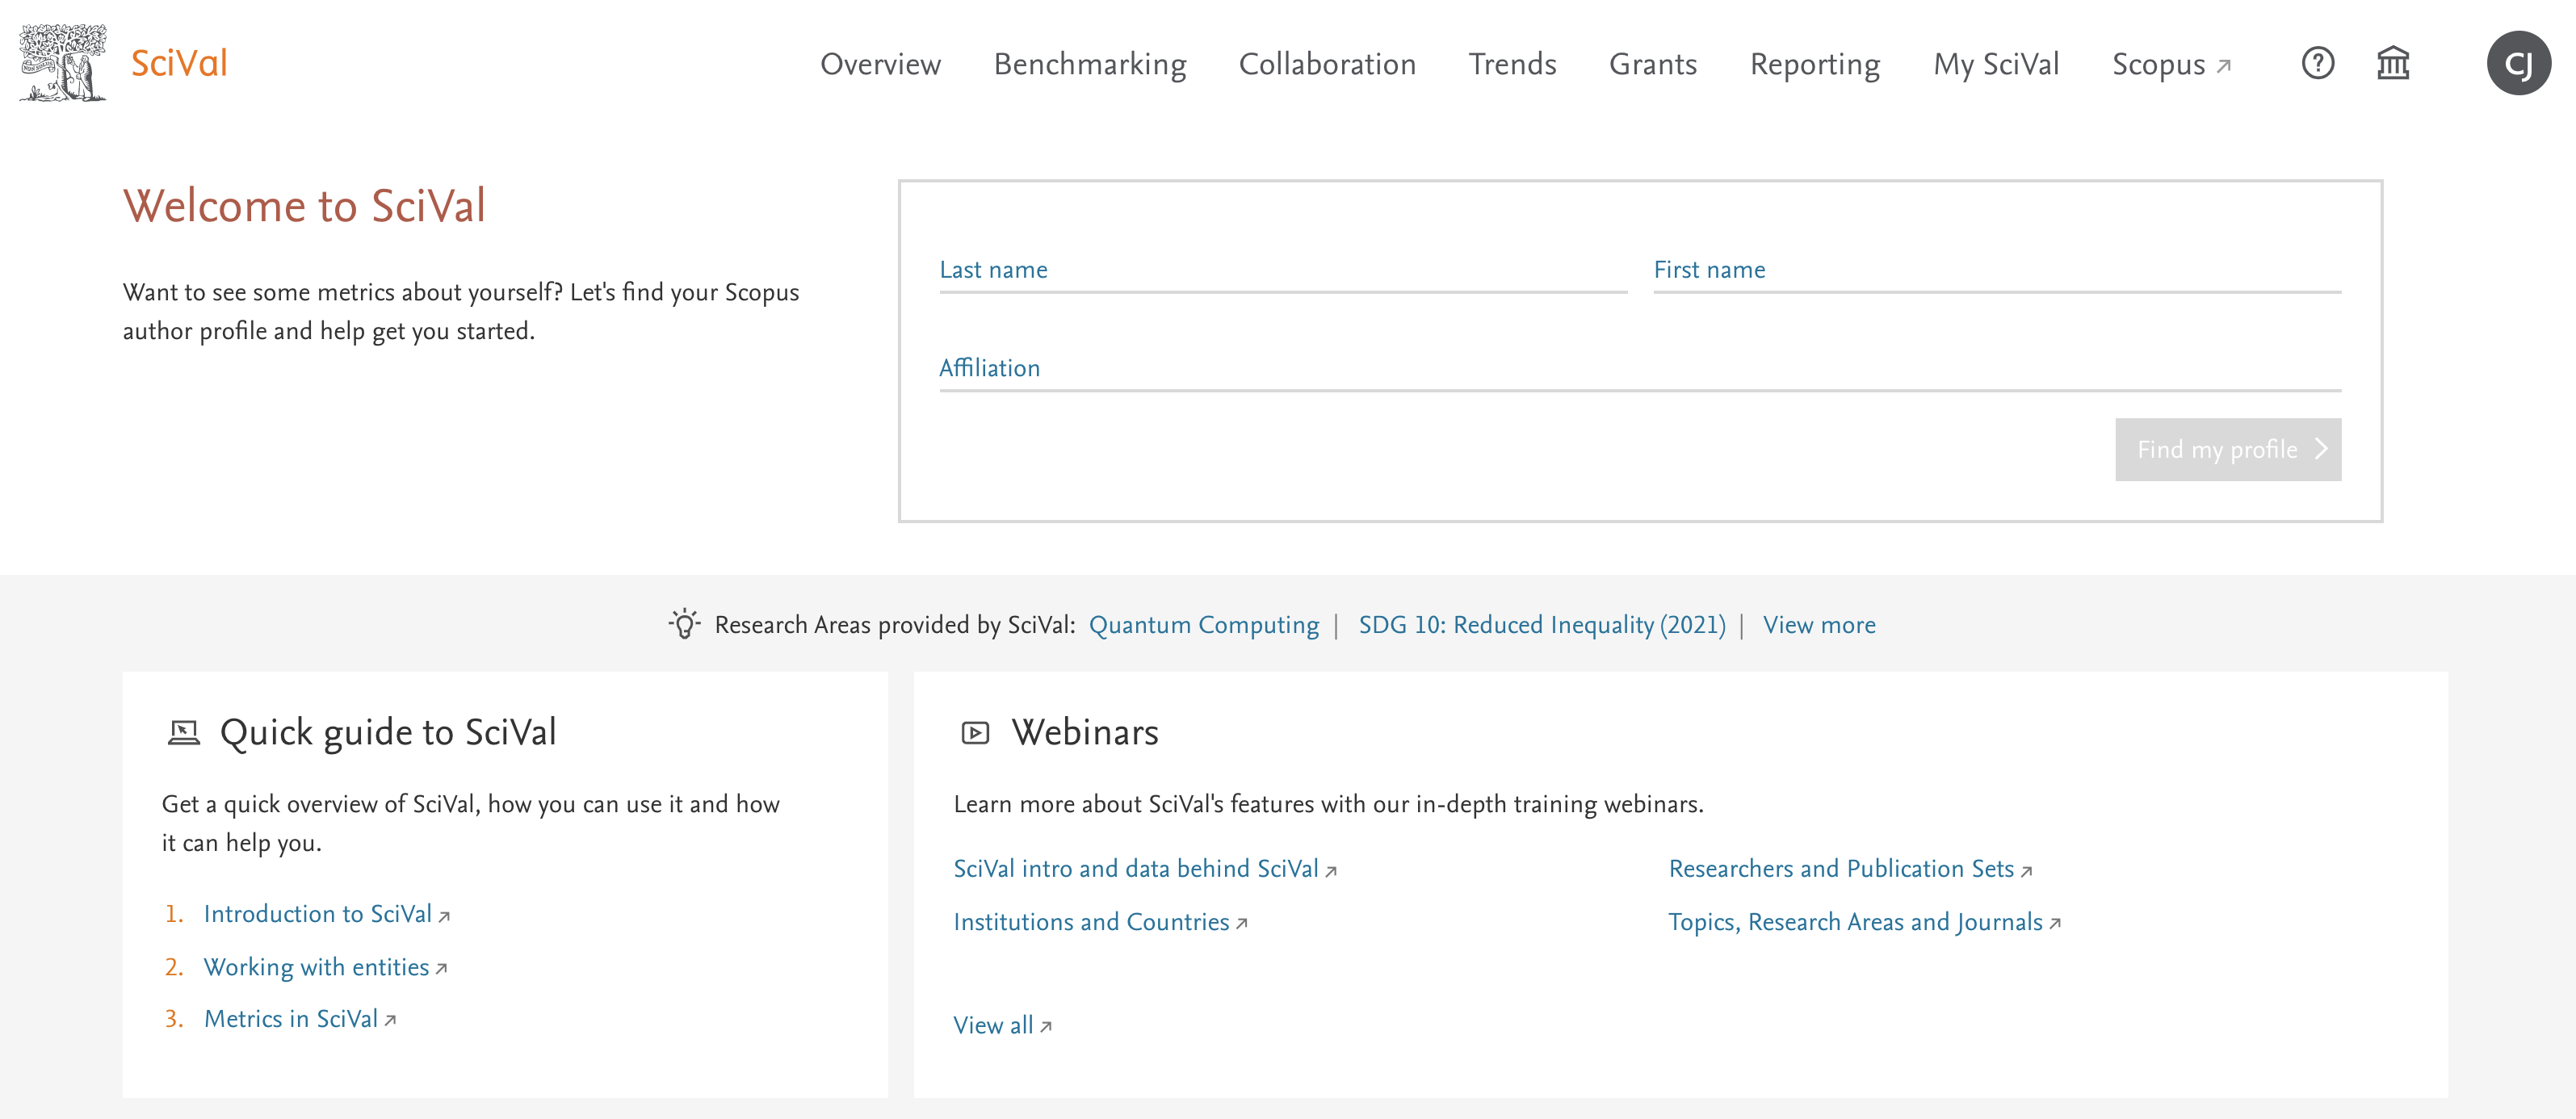
We are experimenting with ways to help researcher get the most out of SciVal. In this release, anyone that accesses SciVal using the SciVal link on the Scopus header, will be greeted with a new homepage. This homepage helps them easily find their Scopus author profile and then provides some guidance to help them get started. Over the coming months, we are going to expand the functionality and guidance offered to researchers landing on this page and will actively be seeking feedback to iteratively improve it.
Additional release items
- Use name variations or acronyms to help find institutions when defining a group
- Export ranking metrics from Benchmarking
- A simplified tool tip for key Topics helping to increase transparency around this analysis
The May 18, 2021 release adds greater transparency on the FWCI, many usability improvements and funding insights for US universities.
- Increased transparency for the Field-Weighted Citation Impact (FWCI)
Analyze and understand the stability of the FWCI for an entity by viewing its value for each year within the selected year range. Highly cited papers from entities with few outputs can disproportionately affect the FWCI and so we are making it easier to review the values over time to enable you to make more informed decisions. The values can be viewed by clicking on the information tooltip for the FWCI in the Overall research performance section in the Overview module. The video below shows the FWCI of a Researcher that is inflated by highly cited publications in 2019. This is common with Researchers because in general they are publishing relatively small numbers of publications. In this case, additional metrics should be used instead of the FWCI.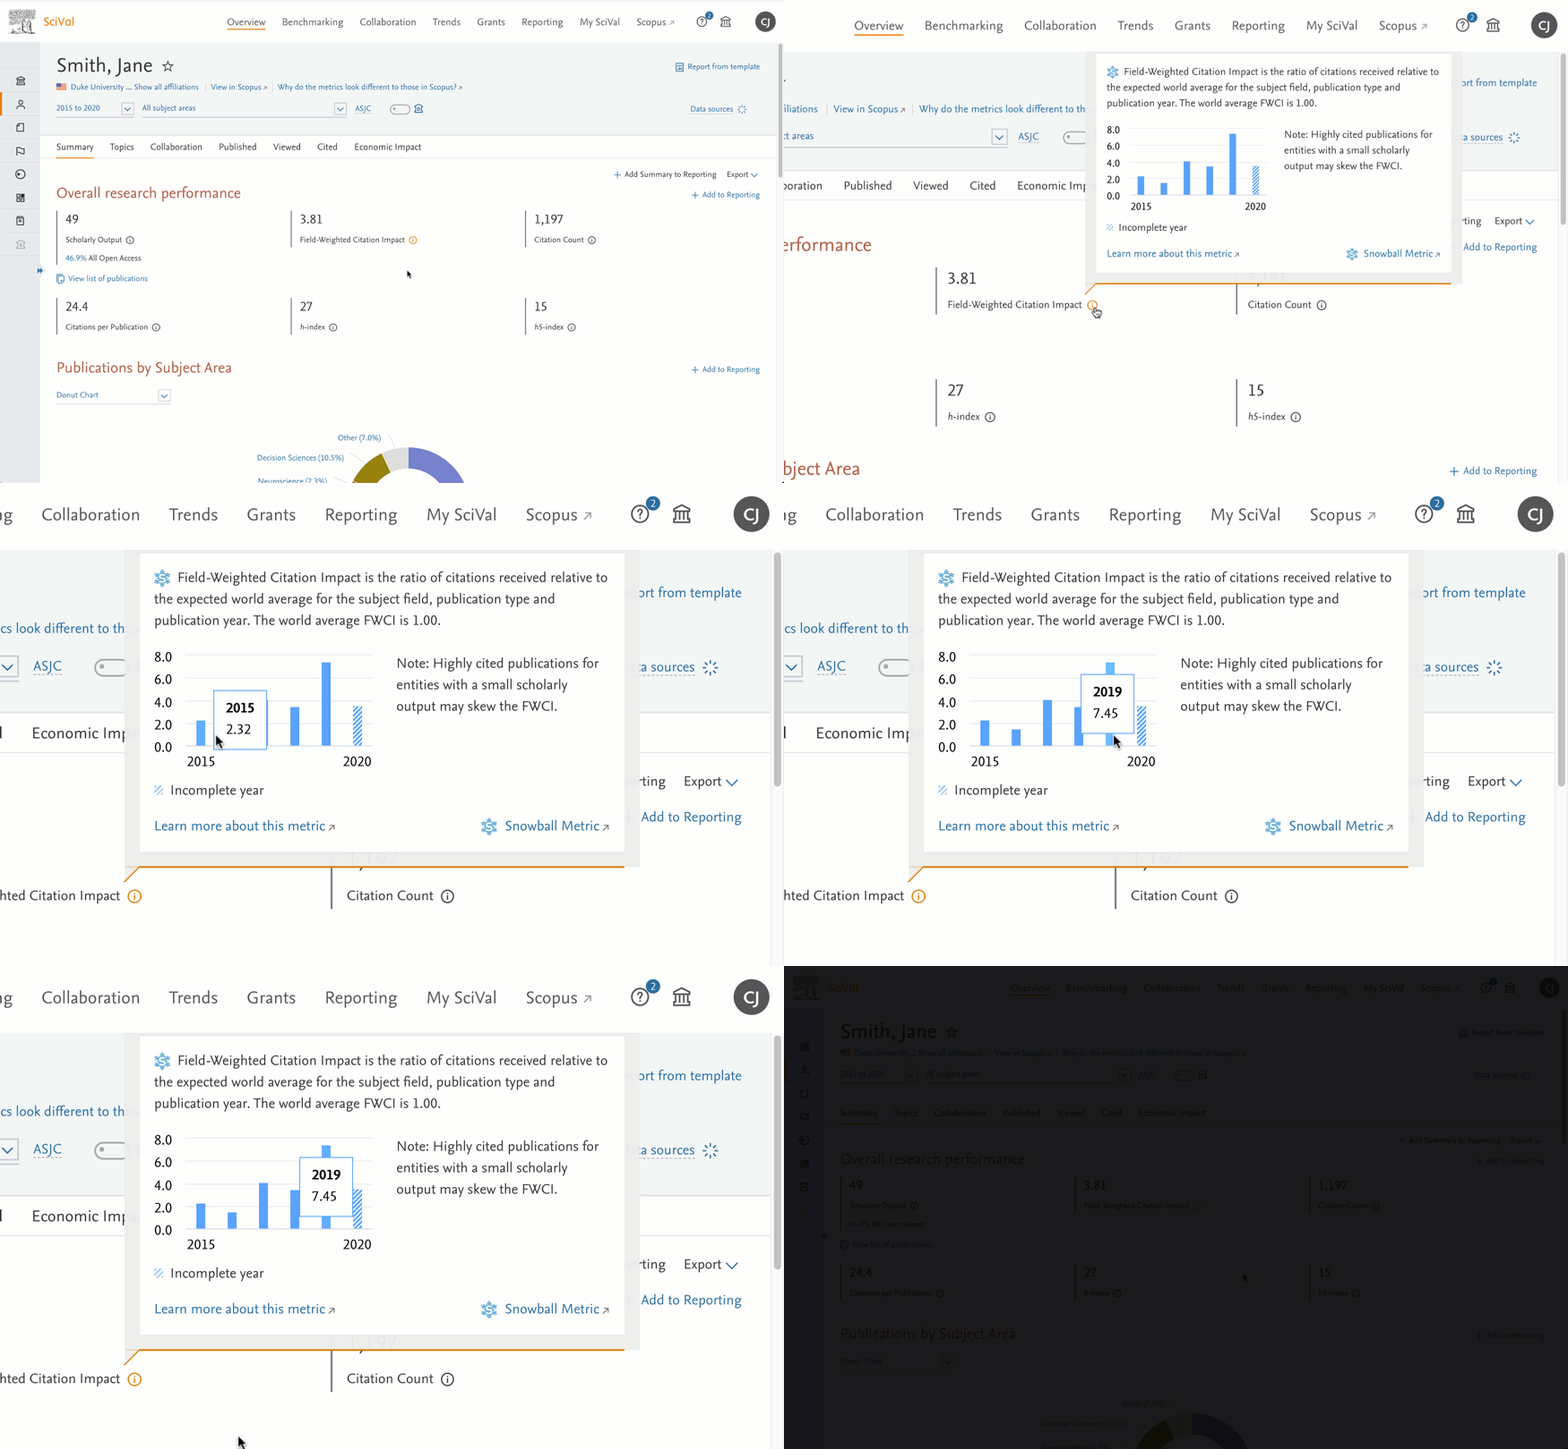
- Benchmarking is even easier with improved entity management
Through customer feedback, two entity management usability improvements make benchmarking analyses even easier.
Refine entity selections in Benchmarking analyses by removing entities directly from the Benchmarking chart legend. This means you no longer have to navigate around the selection panel on the left to remove entities.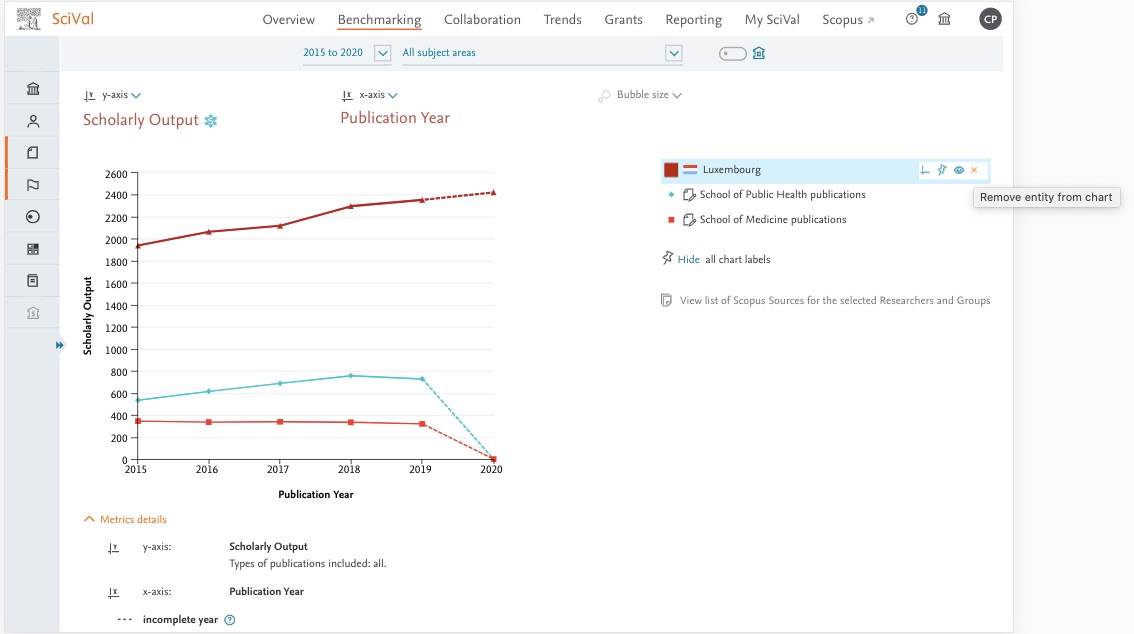
Add new entities to a selection or replace the entire selection in Benchmarking analyses directly from the entity panel, while finding new entities.
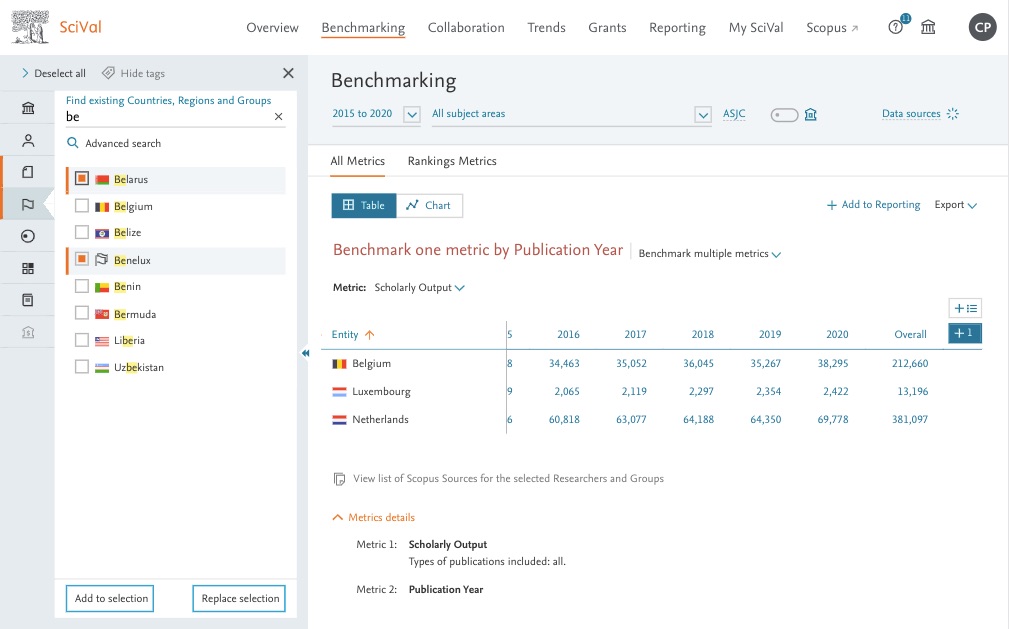
- Creating Research Areas and Groups of Institutions and Countries is now easier
You can now select and remove multiple entities at a time, making the workflow more efficient.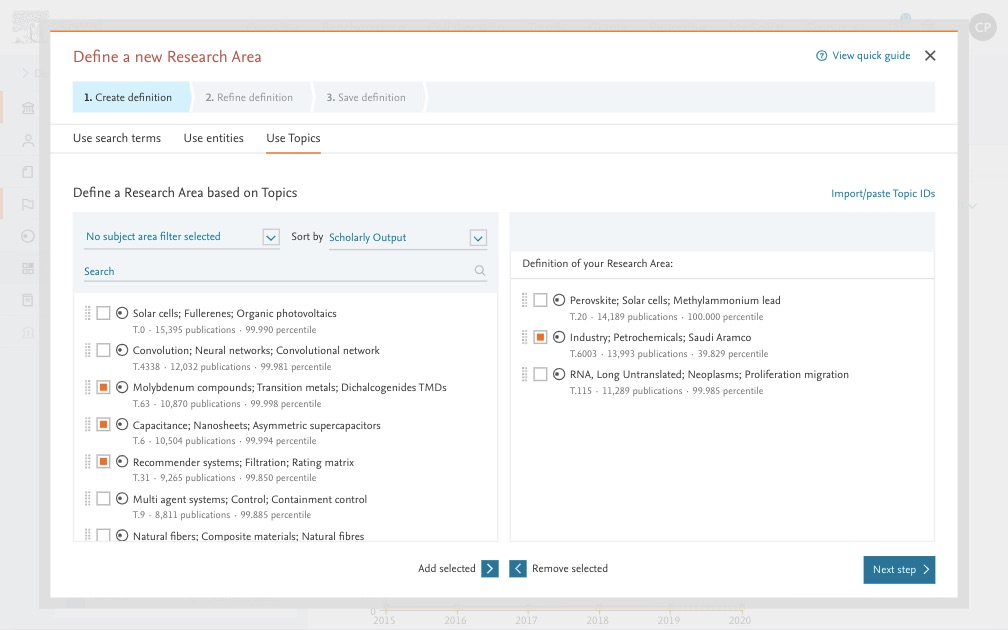
- Grants module for US universities only
We are releasing the first version of the SciVal Grants module to US universities only. The new module was developed in collaboration with several US universities to provide additional evidence, in the form of awarded grants analyses to expand SciVal’s ability to support the Strategic planning process. Using groups of Topics, universities can: view the funding landscapes for research themes of interest, analyse funding trends in these areas, identify the key Funding bodies, grant awardees, the funded institutions and the funded Topics. The funding landscapes are created using an Awarded Grants snapshot from 2010 to 2020 from US Federal funding bodies and foundations as well as key funding bodies in countries/regions which US universities frequently collaborate with.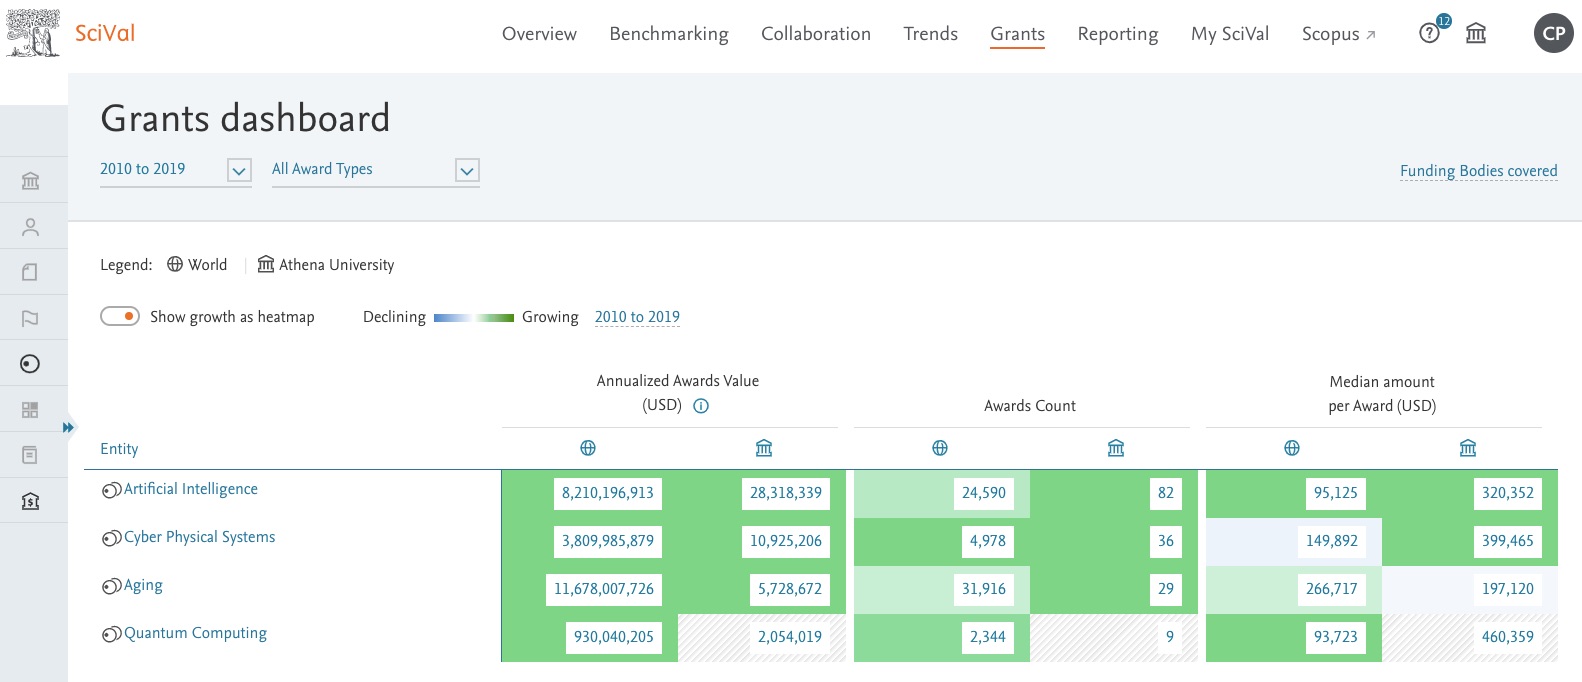
- Number of institutions added to the publications list export
The number of institutions in each publication can now be added when exporting lists of publications. The institution names continue to be available as an export option, but only the first 100 institutions are displayed for publications with more than 100 contributing institutions.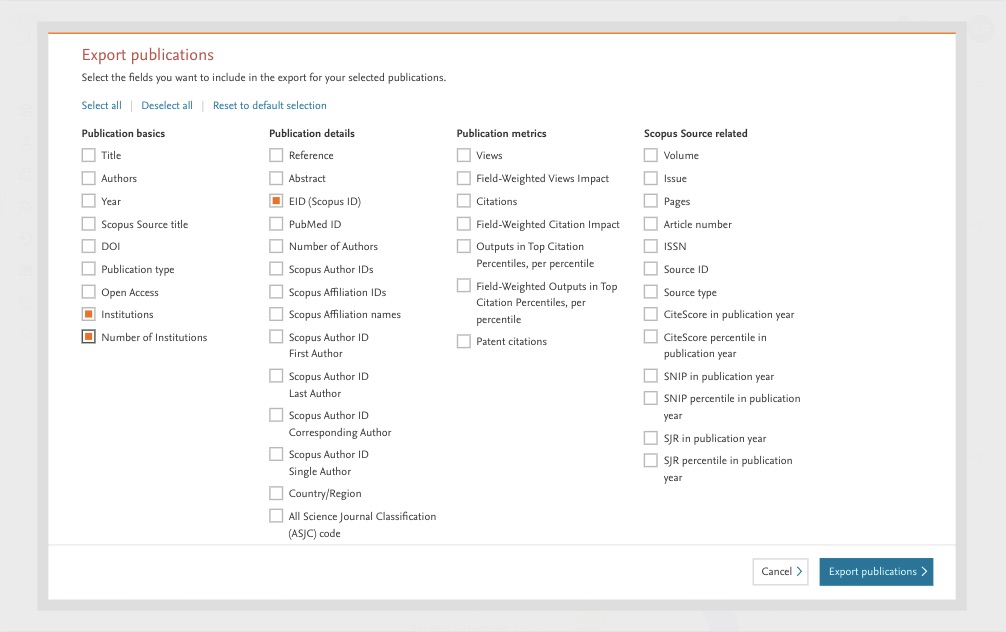
- Easily find your home institution in lists in Trends
Find your own institution easily on the Institutions list in Trends by using the 'Scroll to Home Institution' aide. Clicking on the link shifts focus to your Home institution within the list.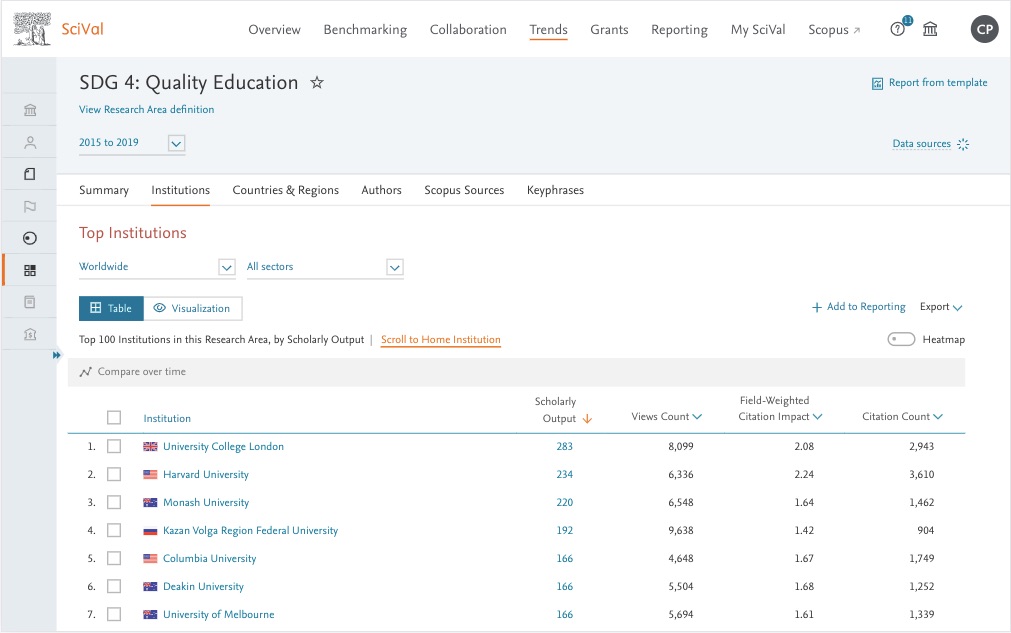
- Set your default preference for display of heatmaps
You can switch off Heatmaps in Trends in your preferences. The heatmap toggles can override the preference settings where required. The setting can be accessed through the menu on the top right of the screen with your name initials.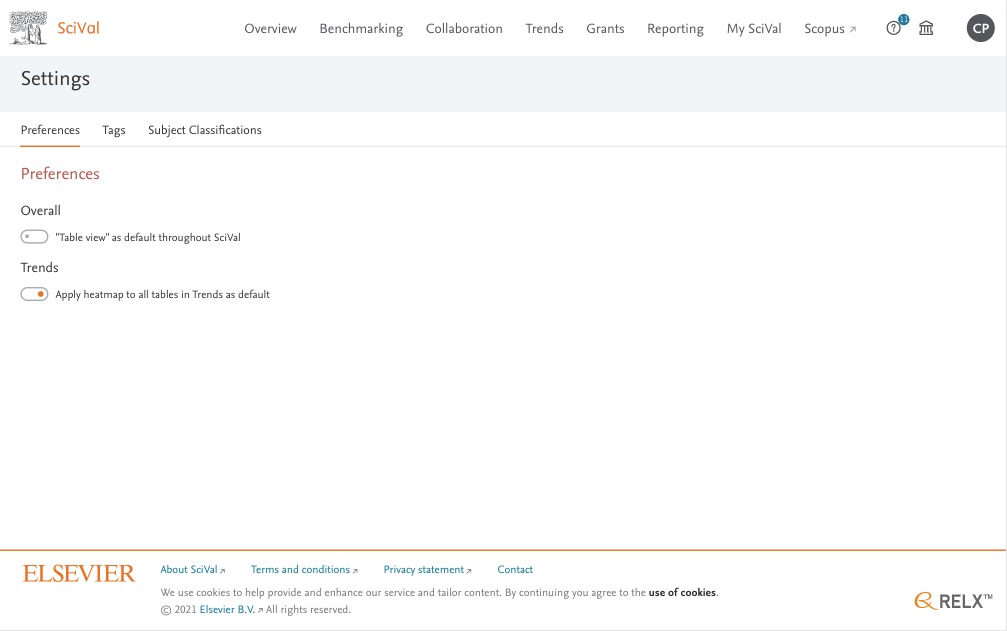
- See the subject areas of a selected Scopus Source
You can now see the subject areas under the name of the source title. Click on them to see a list of titles in the same subject area ranked by Scholarly Output of 2019 CiteScore, then use this list to benchmark your title or find related titles to investigate further.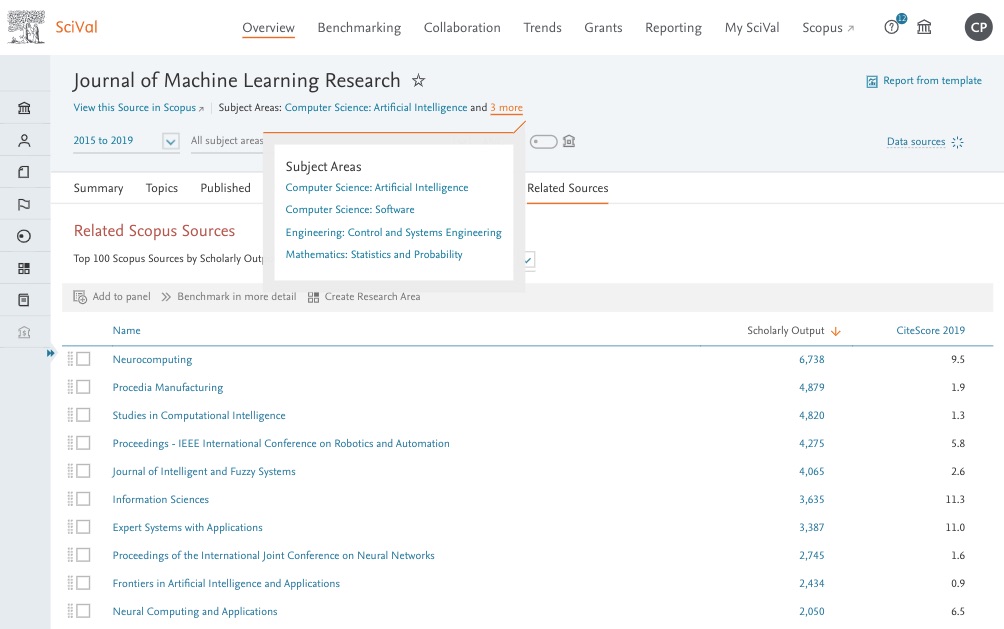
The April 20, 2021 release provides robust information and transparency around the bibliometrics used in the Times Higher Education World University Rankings (THE WUR).
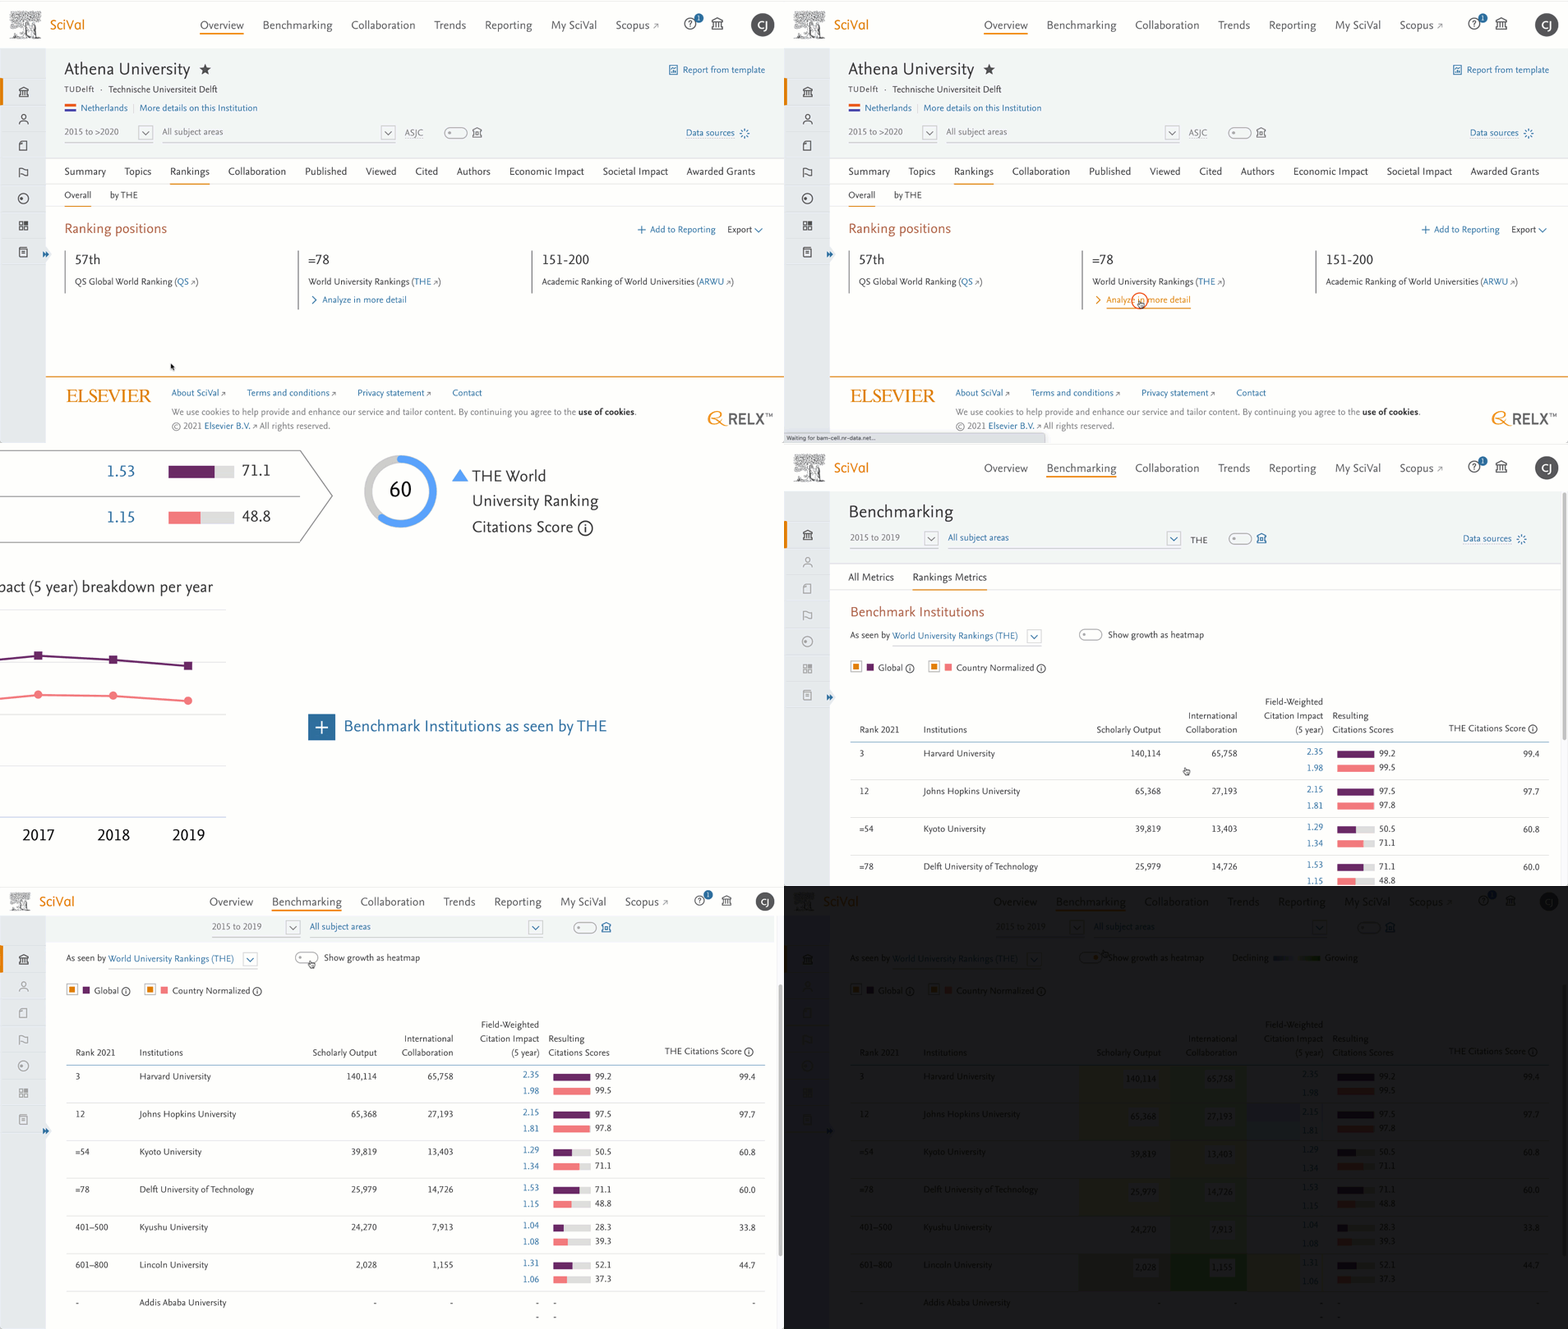
- Analyze and benchmark your institution using the bibliometric dataset used in THE WUR
Gain a deeper understanding of the bibliometric dataset and indicators which contribute to your institution's overall ranking score in the THE World University rankings. Analyze the drivers behind the Citations Score (30% of the overall ranking score), and benchmark with peers to understand your institution's position. These capabilities are also available for each THE subject area to help inform faculty and department level planning. Learn more about the University Rankings in SciValopens in new tab/window
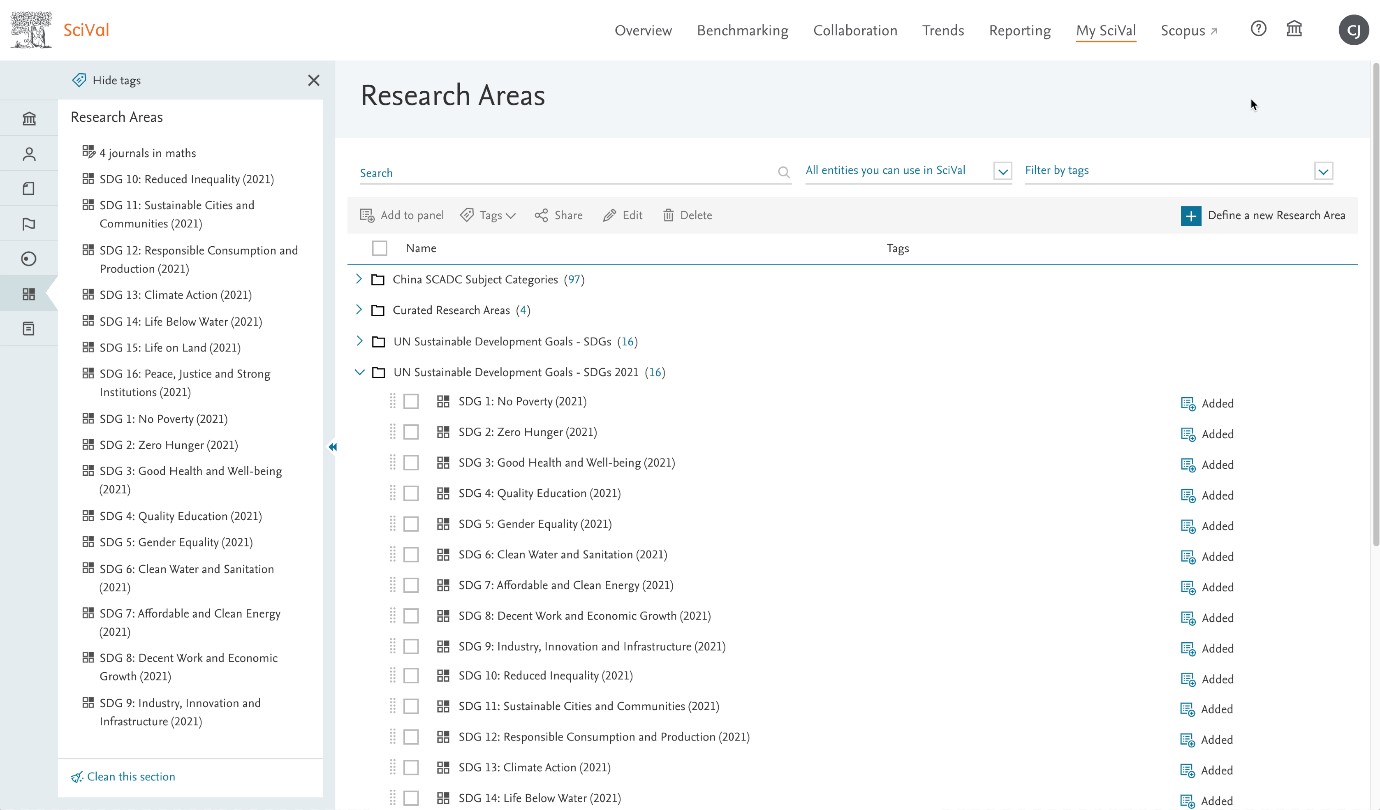
- Updated SDG methodology – mappings used in THE Impact Rankings 2021
Track and demonstrate the contribution of your institution and researchers towards achieving the targets of the UN SDGs with updated SDG Research Areas. The new “Elsevier 2021 SDG mapping” have been created through a combination of a comprehensive search query augmented with publications identified through a machine learning (ML) model. The ML publications make up approximately 10% of the total publications for the SDG. The new SDG mapping is the same as used by THE in their Impact Rankings 2021.The 2020 SDG Research Areas will remain in SciVal with the 2021 version for the next year. Learn more about the SDGs, including the “Elsevier 2021 SDG mapping.”opens in new tab/window
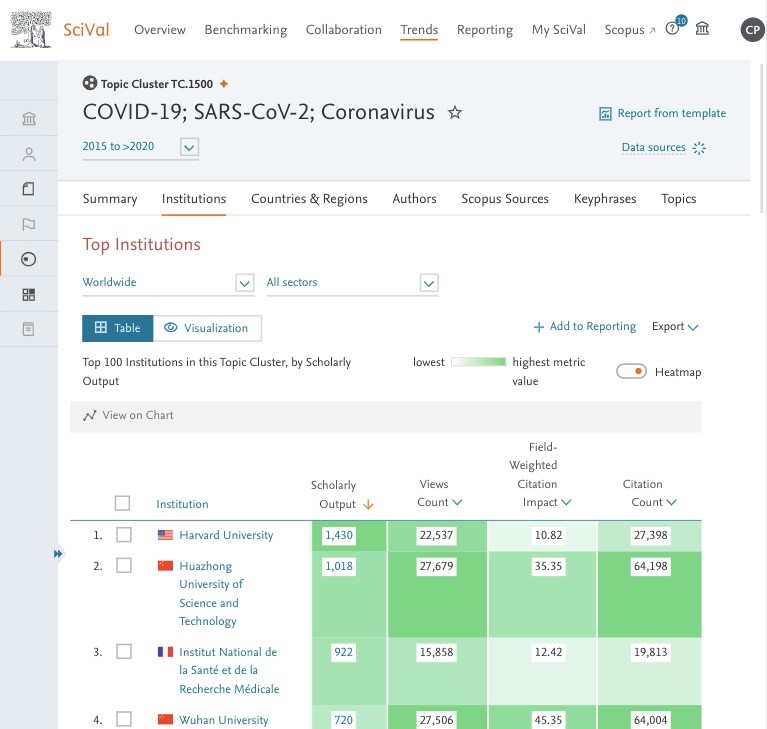
- Heatmap option in Trends table
Analyze long lists quicker in Trends with new heatmaps, making it easier to see high and low metric values. Click the Heatmap option on any table in Trends to get started.
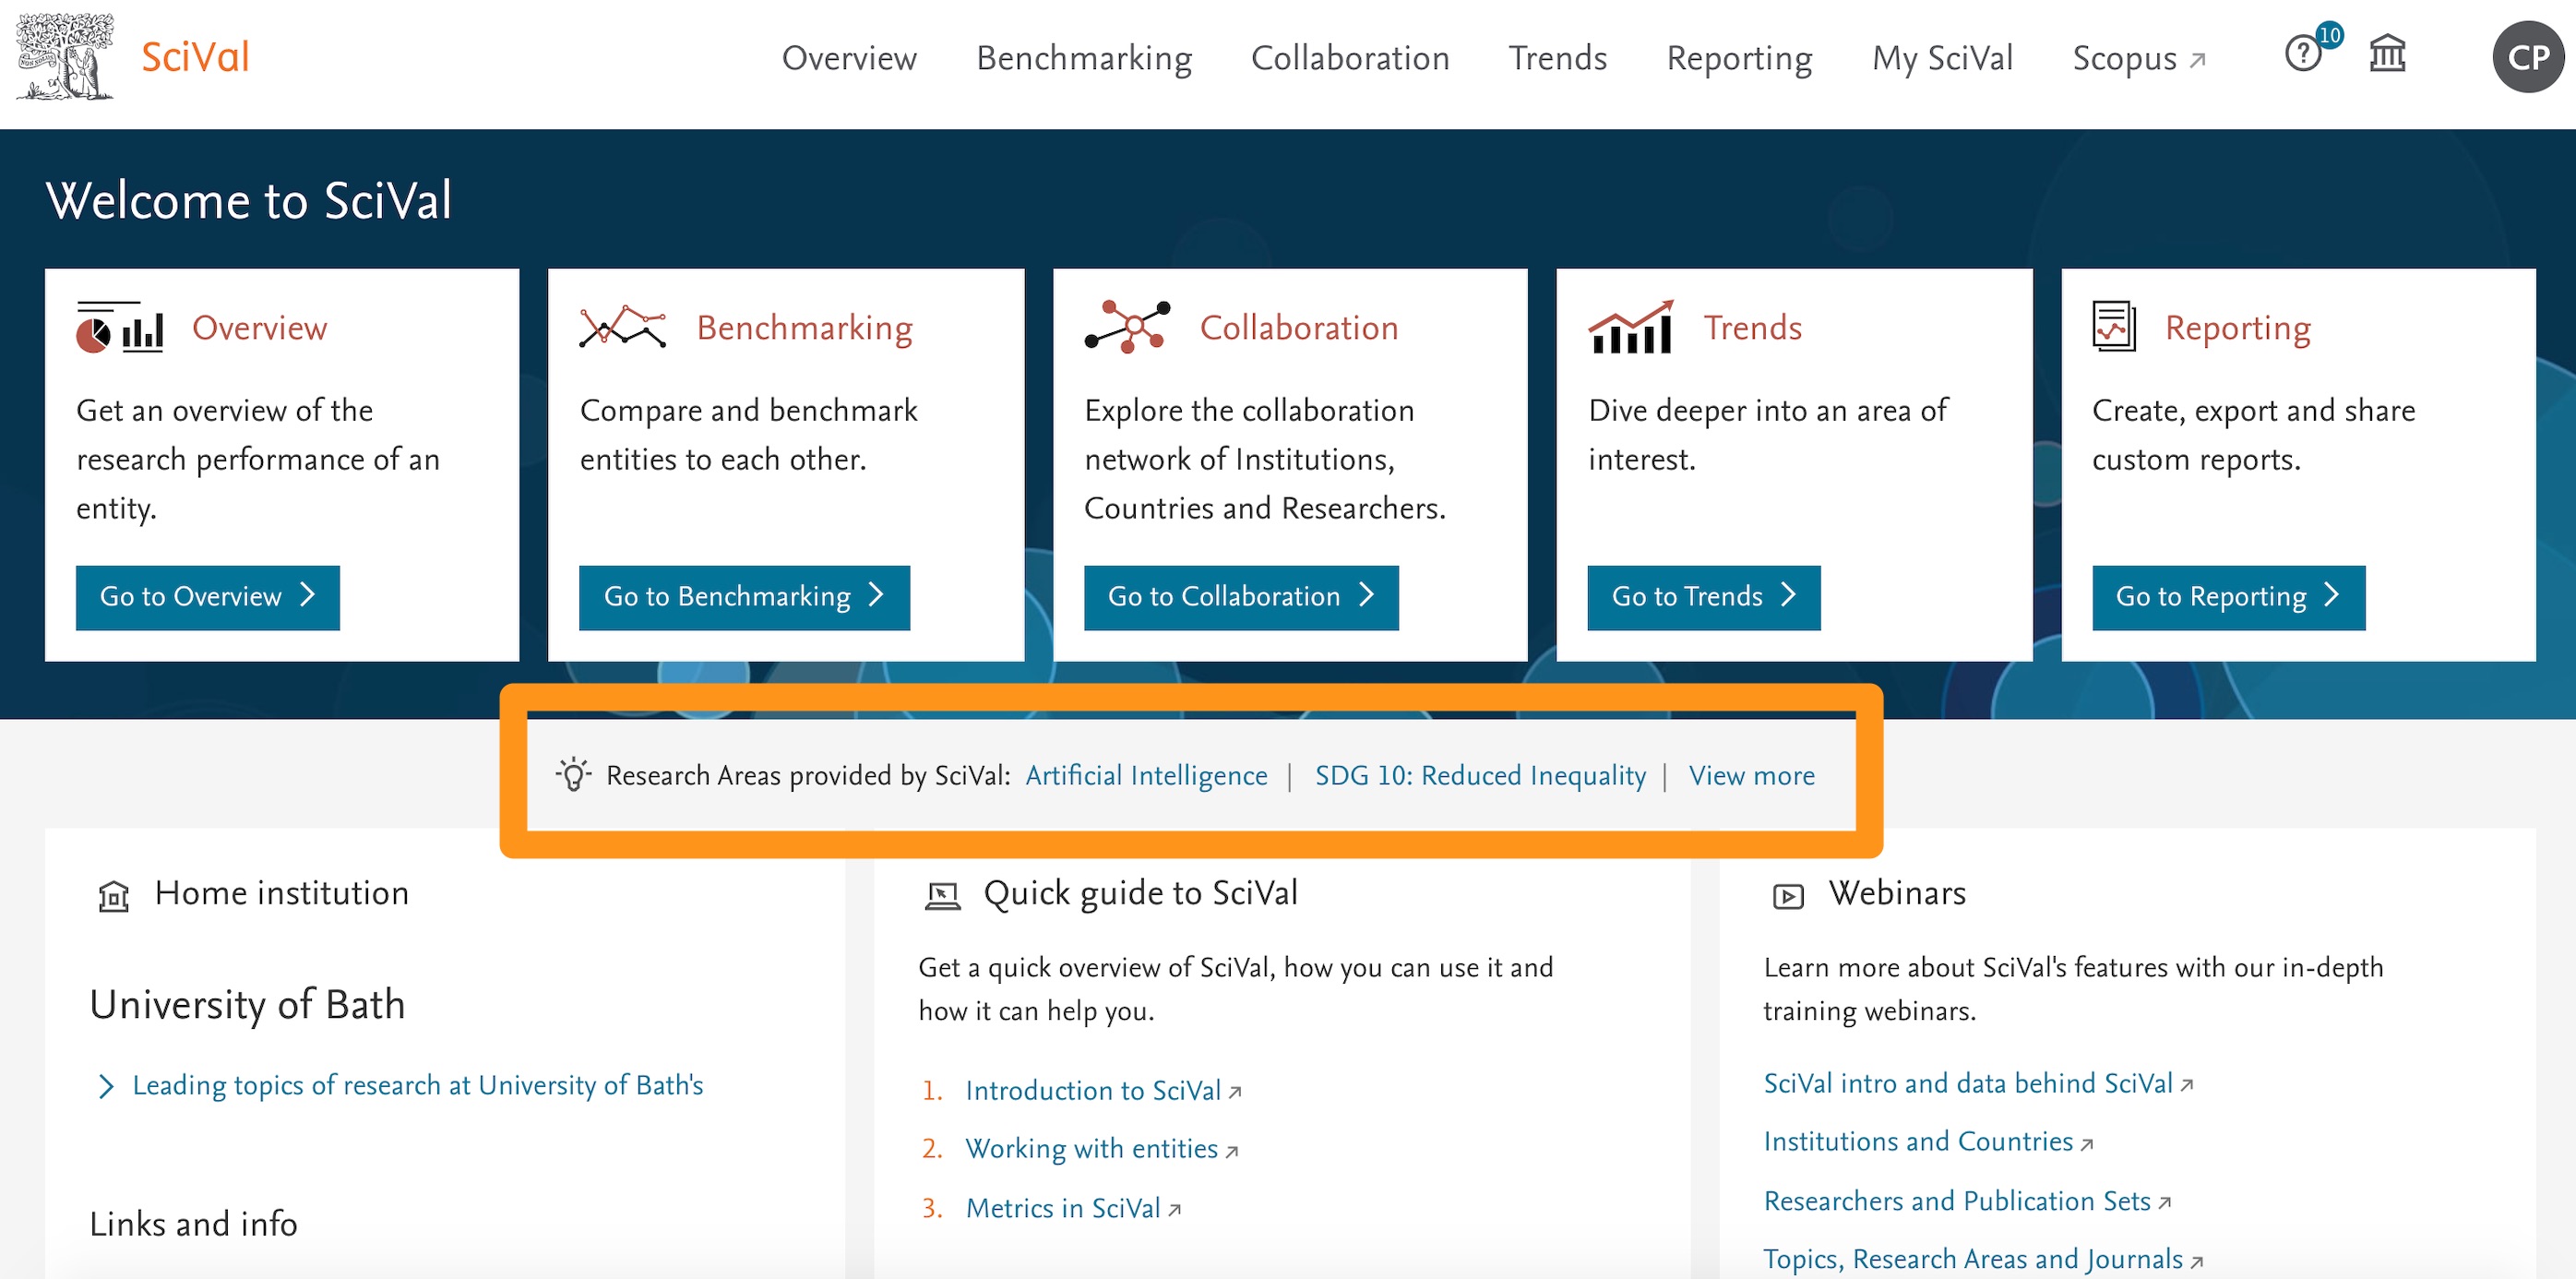
- Wider selection of Curated Research Areas
Through customer feedback, we've added 3 new expert curated Quantum Research areas – Quantum Computing, Quantum Metrology and Quantum Sensing to enable quicker institutional analyses. To help make them easier to find, recently added curated Research Areas are highlighted in a new section added to the homepage.
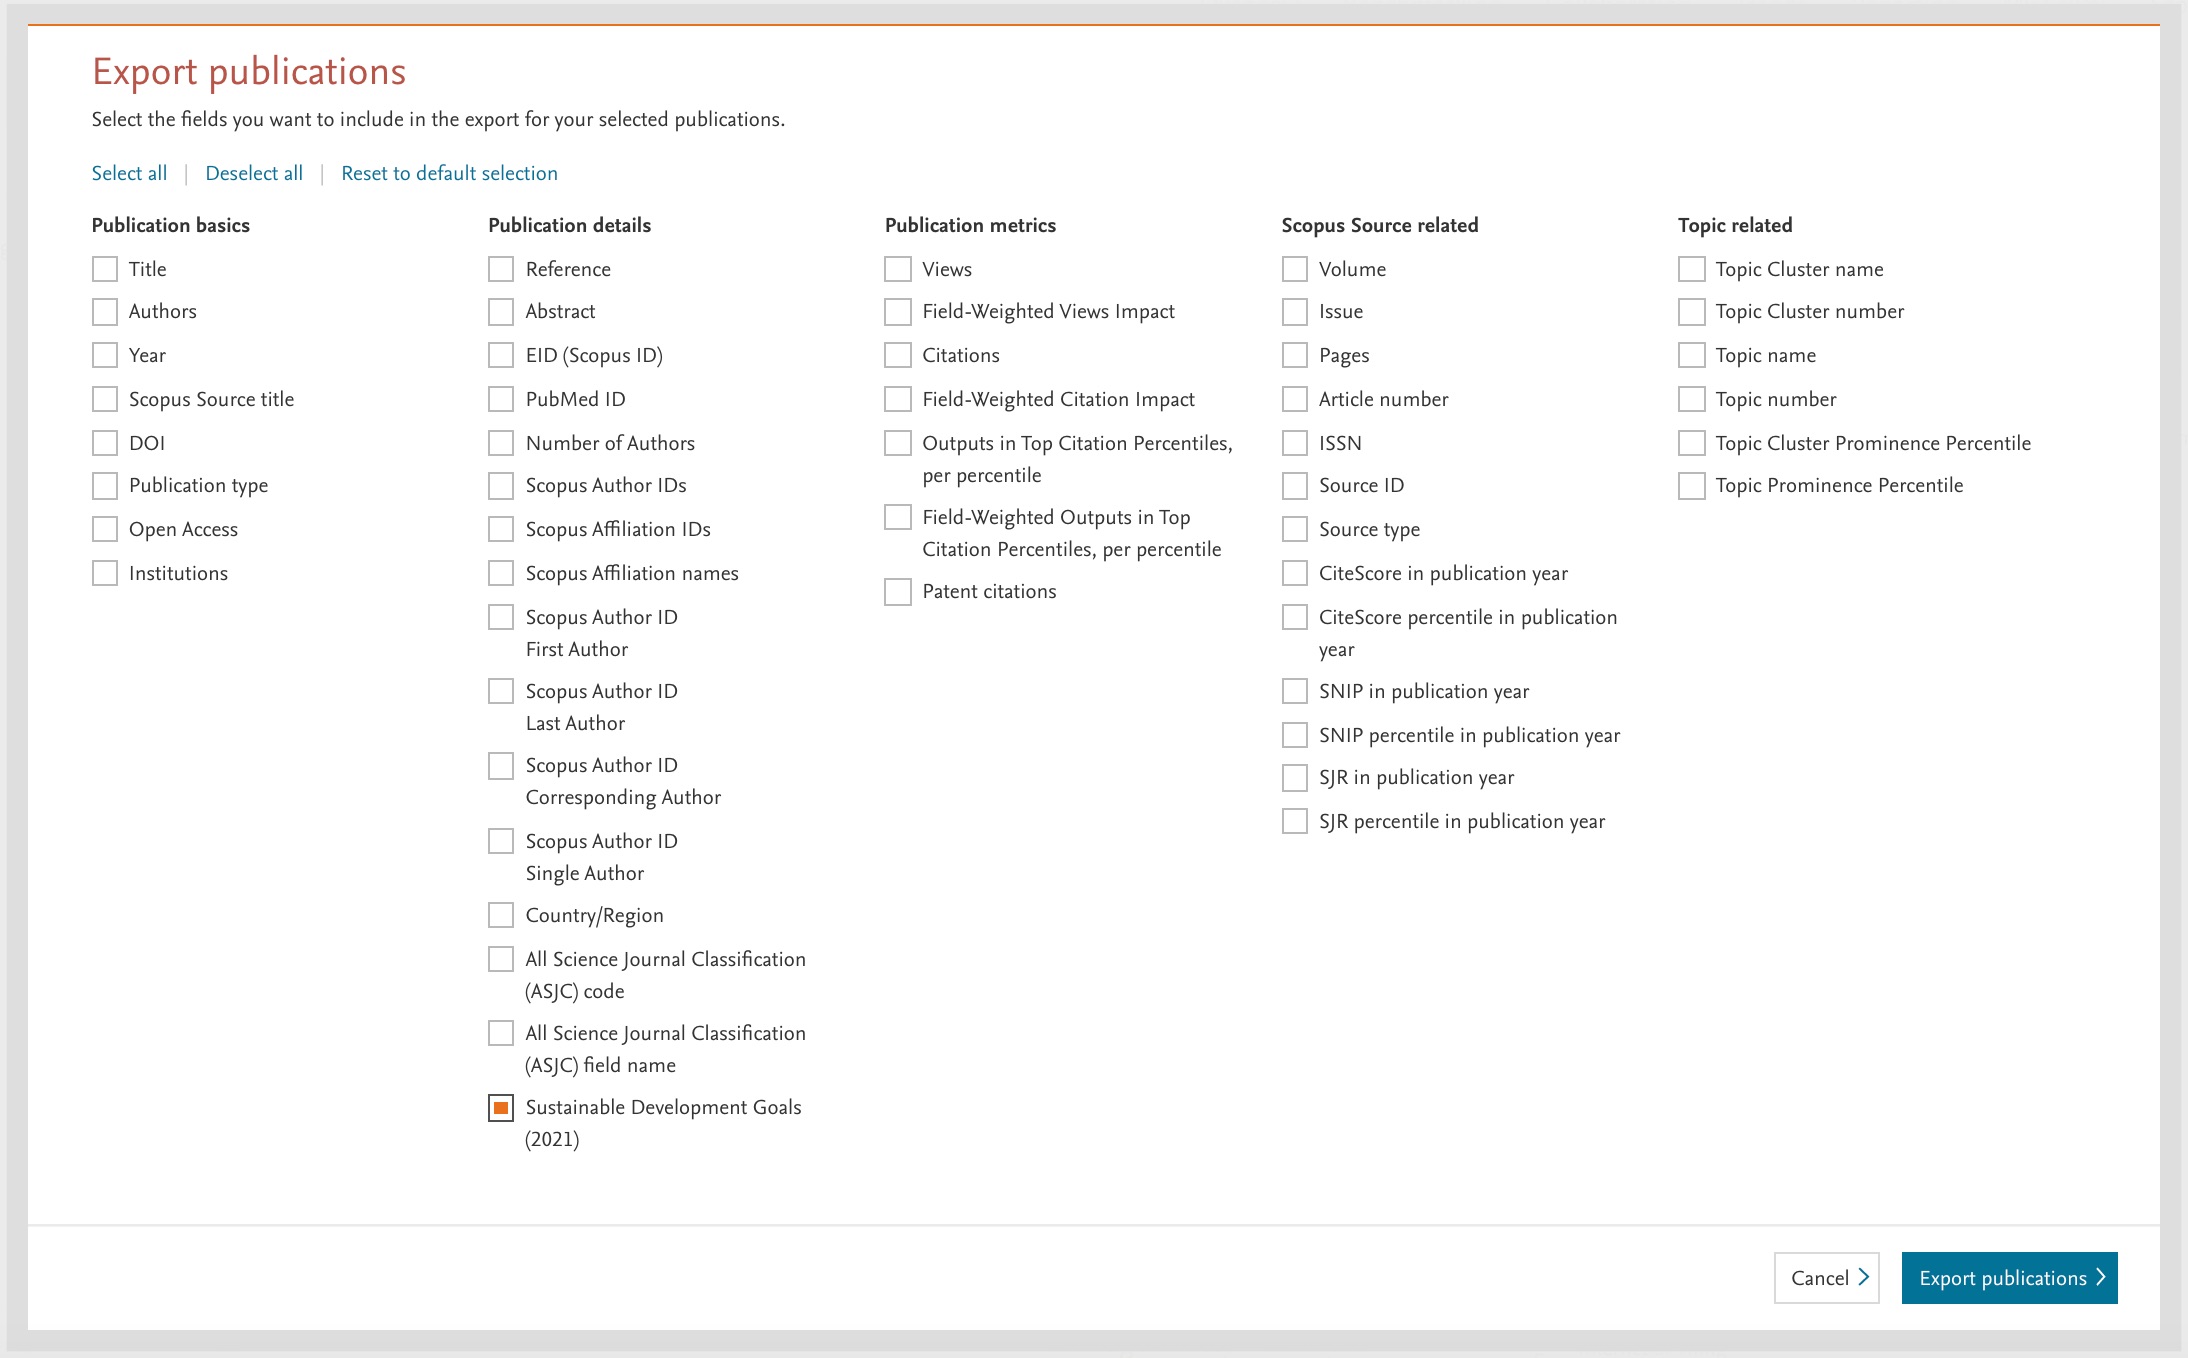
- Export the SDG mappings for any set of publications
You can now select “Sustainable Development Goals (2021)” as a publications export option. This allows you to see the SDGs linked to any entity for the first 100k publications.
- Additional Reporting/ Report Template improvements
We’ve added 2 new improvements.
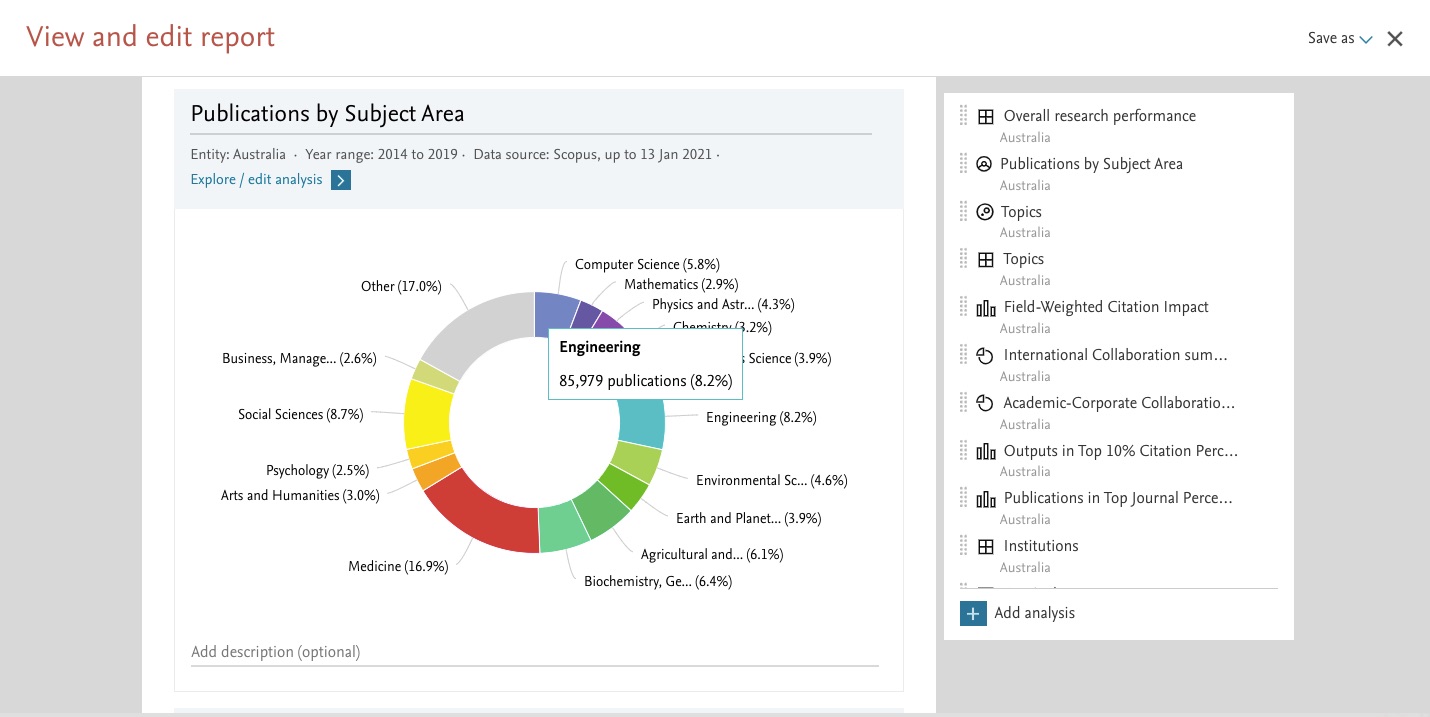
- Analyses in reports are more interactive with tooltips showing values and descriptions whenever you hover over a chart (pie, doughnut or tree) or bar chart.
- Whenever you change the name of an analysis in a report, then save that report as a template, the customized analysis name is retained in the report template.
The March 23, 2021 release highlights fast moving areas of research which have emerged in the past 2 years with new Topics on SciVal:
- Analyze your contribution to fast moving areas of research
Find out if you have contributed to 112 New Topicsopens in new tab/window which have emerged as a result of fast-moving areas of research. New Topics represent areas of research that have seen a significant growth in new citation relationships in the past 2 years and are derived from existing parent Topics. In total there are 54 COVID-19 related Topics, all of which have been added to a new COVID-19 Topic Cluster.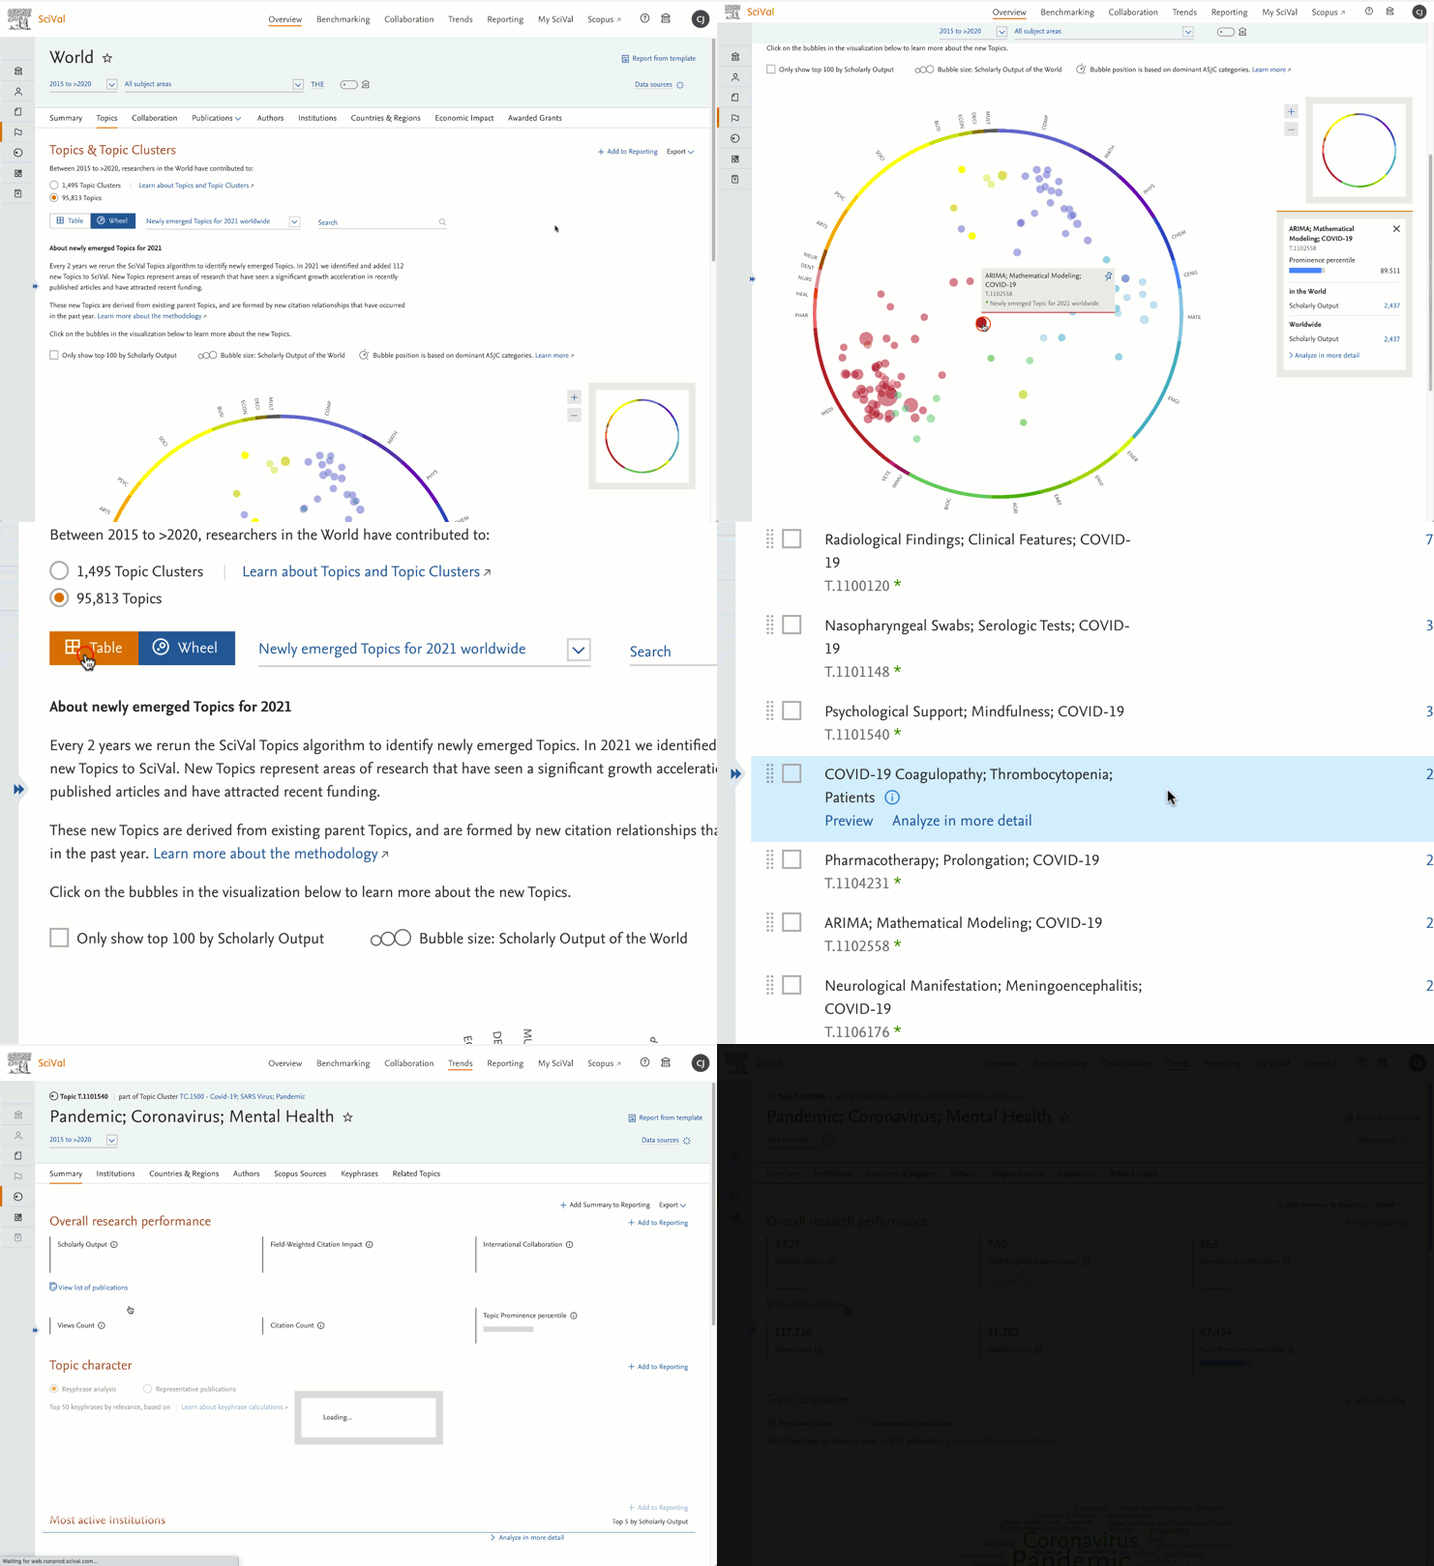
- In product assistance to help onboard new users in your institution
Waiting to carve out time to train some colleagues on the basics of SciVal? Wait no more! In-product guidance for new users to SciVal helps get them started on the basics, freeing up your time for more advanced tasks and discussions. New users will see guidance on how to define an entity when the entity selection panel is empty, for example when they have no Researchers defined. The text will help to guide the user on how to define a Researcher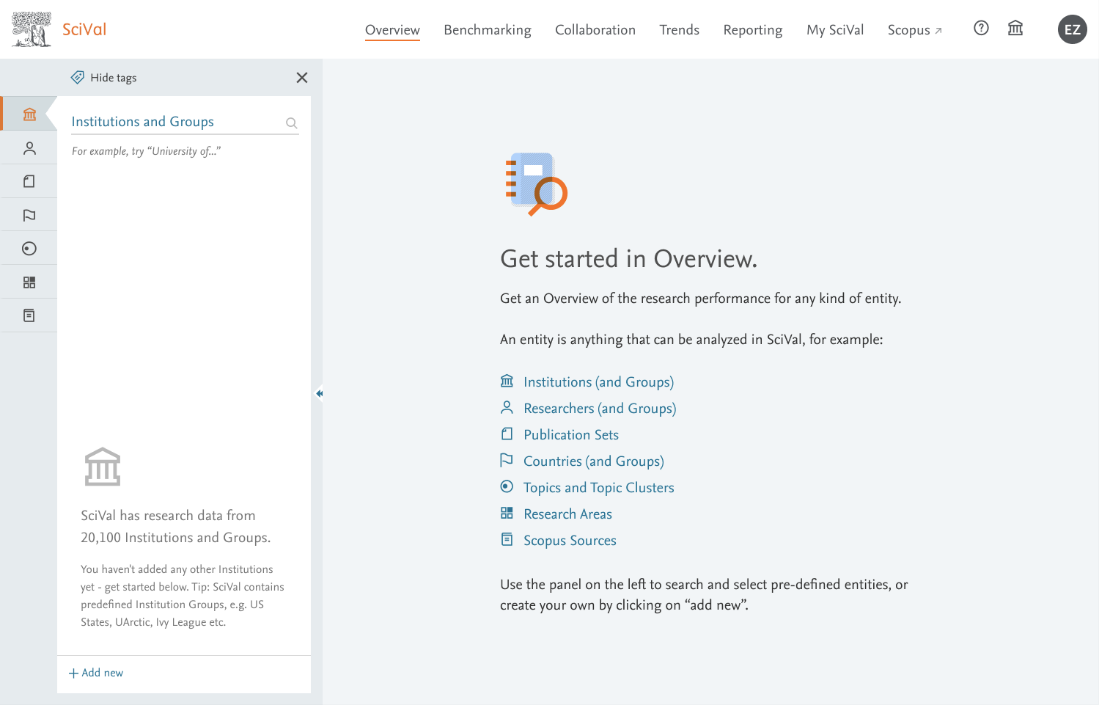
- Richer publication exports with indicator of economic impact
Deeper analysis of Patent citations as indicators of economic impact using other tools is now easier with Patent-citations in publication exports. You can get to this export by viewing underlying publications anywhere on SciVal.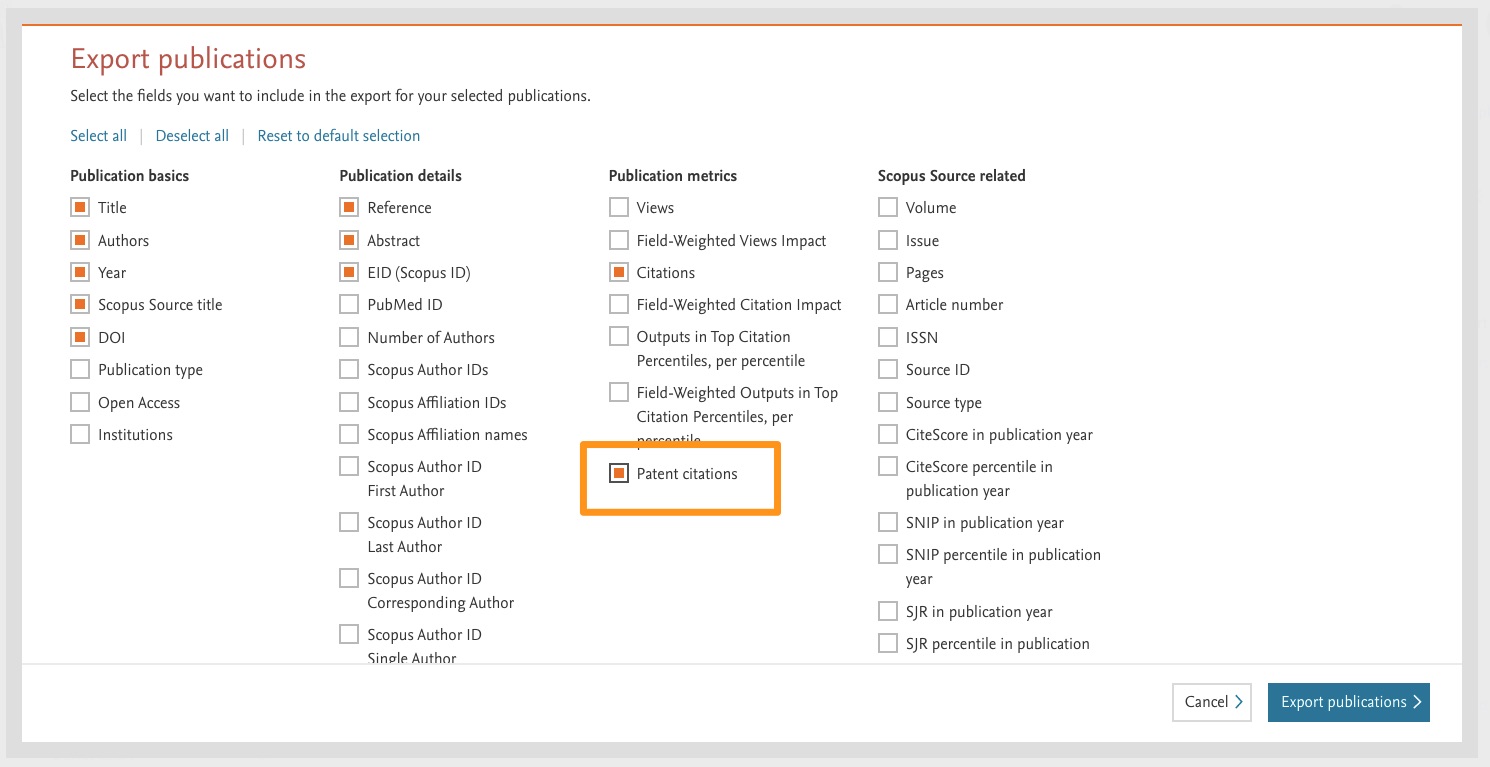
- New institution area for SciVal administrators
Help guide new users and personalize SciVal with local contact information, links to your training and responsible metric statements on the homepage. To configure this area, please contact your Elsevier representative.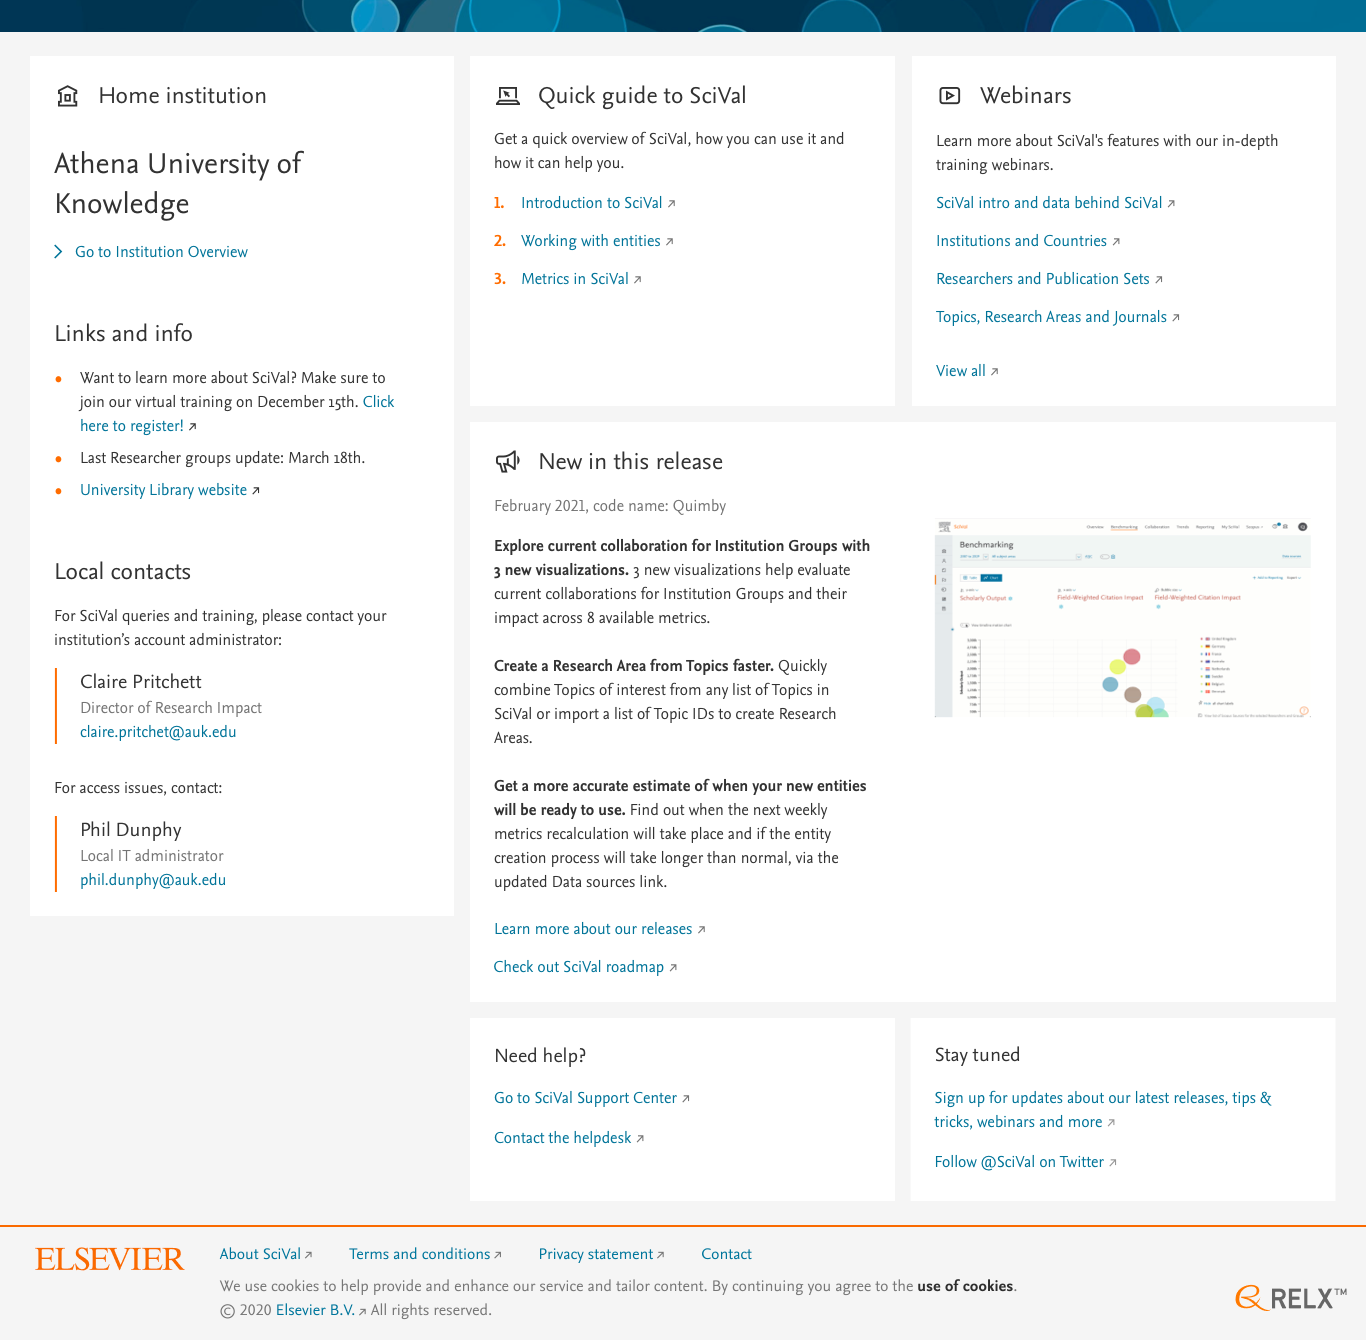
- Keep your original Publication Sets when merging several together
Following feedback from user testing, the process of merging Publication Sets has been made more flexible. Now you can keep your original Publication Sets when merging several together, as compared to the previous situation where the original Publication Sets were lost in the merge process.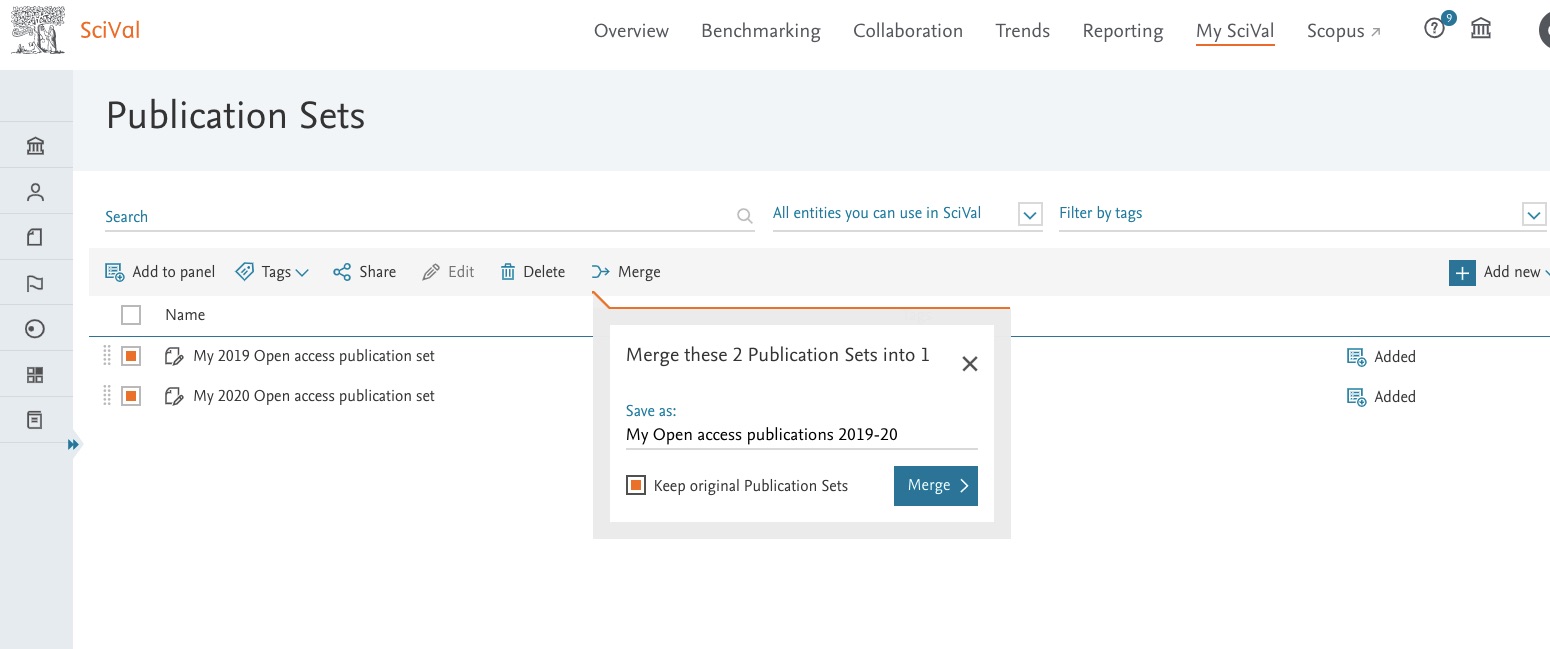
- More clarity added to Key Topics for an entity
We noticed that for smaller Topics with few publications, an entity could become a key contributor by making just one publication. We have tweaked our algorithm so that an entity is a key contributor only if their contribution to the Topic was regular (i.e. at least as many publications as the number of years in the selected time range).
The February 23, 2021 release brings enhanced usability to reports, deeper research performance analysis using Scopus Sources and improvement to our Key Topic algorithm:
- Generate a fully editable report in Microsoft Word
You now have more control over the insights you generate and share from SciVal with a fully editable report in Microsoft Word. Add required context through introductory or supporting text to make sure colleagues get the insights they need from your reports.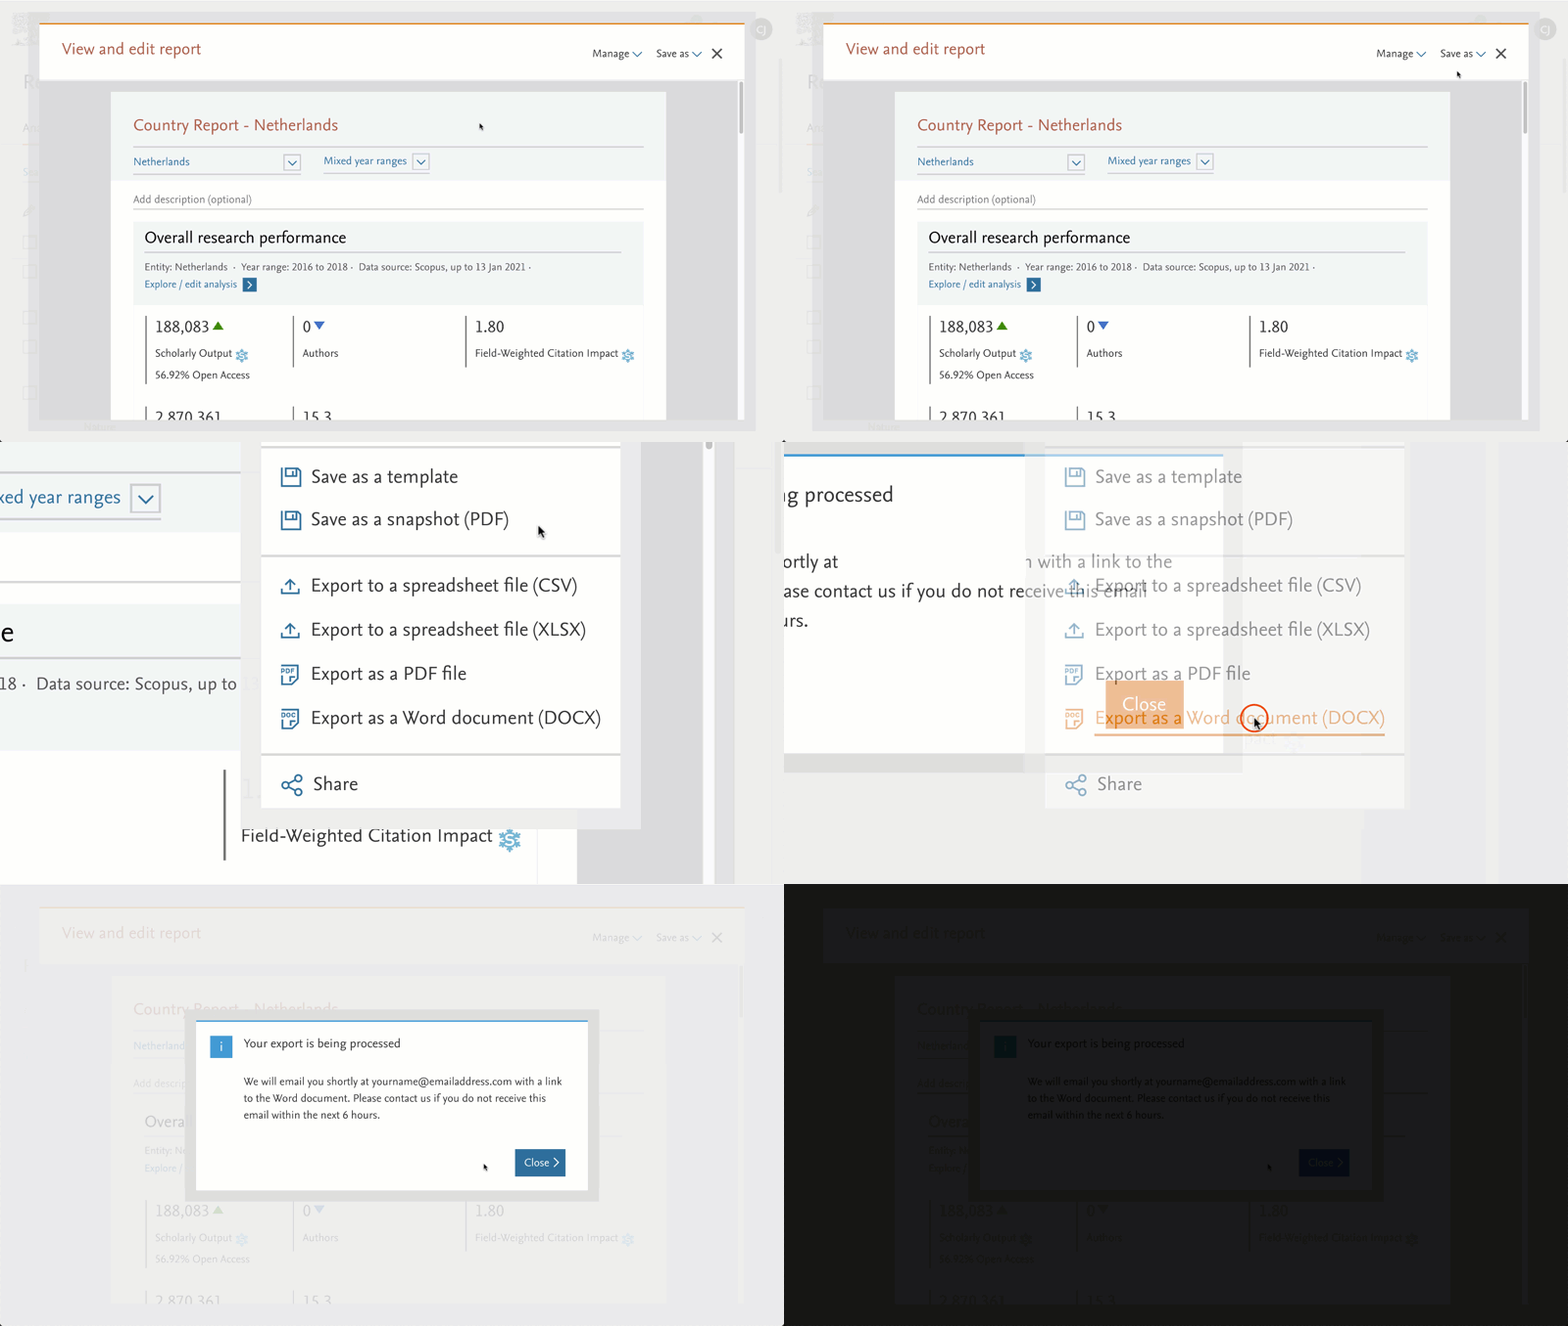
- Enrich and guide development of your publication strategy with related Scopus Sources
Gathering evidence to guide your publication strategy is even easier with the ability to view related Scopus Sources with most Scholarly Output in the same subject classification and compare them on Scholarly Output and CiteScore.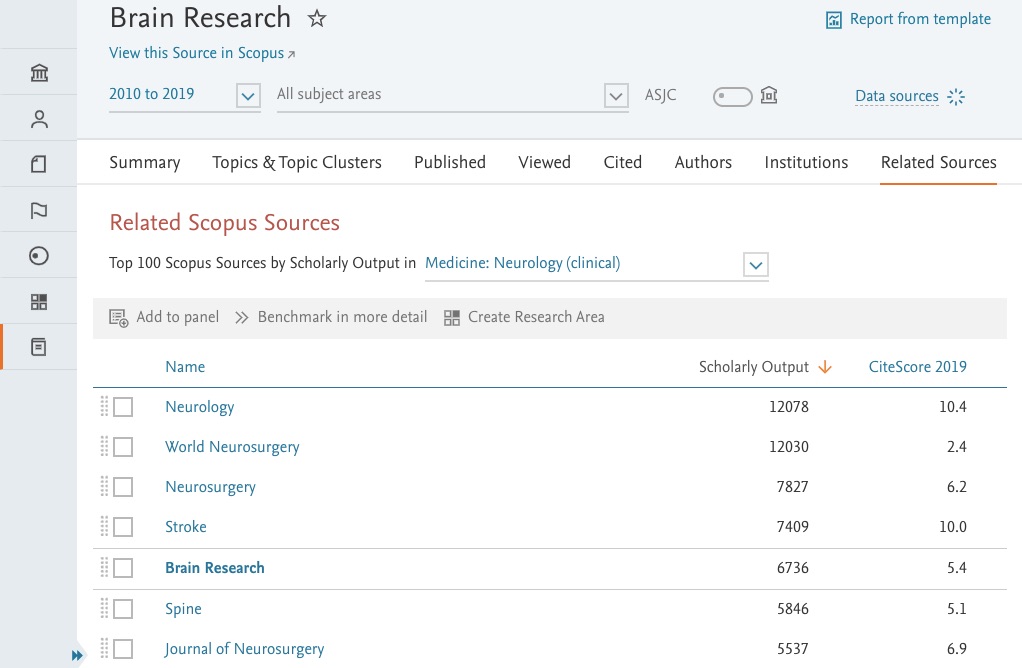
- Improved process for building Research Areas from Scopus Sources
Using journals to assess research performance and analysis of research trends has been simplified too. Now users can just select the Scopus Sources from a list (e.g. in Trends, or in the newly added Related Scopus Sources tab in Overview) and create a Research Area using them by clicking on the 'Create Research Area' button. - It is now even simpler to view, edit and save changes in a report
Using feedback from user testing we have been busy improving Reporting to make viewing, editing and saving changes to a report even simpler. Previously, with the report and its structure available in two different tabs, the user had to switch back and forth between the tabs to make a change, view its implication and save it. With a neat analysis picker alongside the report, making changes and saving easier than ever.
The January 26, 2021 release brings increased transparency to Topics, Research Areas and Publication Sets and a feedback mechanism to help improve Topic names:
- Increased transparency for Topics and Topic Clusters
Get a better understanding of the theme of a Topic or Topic Cluster through the titles of its 5 most cited publications, then link directly to the underlying publications to read the abstracts. The information icon, when clicked, activates a fly-in panel and is visible in a Topic list when you hover over a Topic name.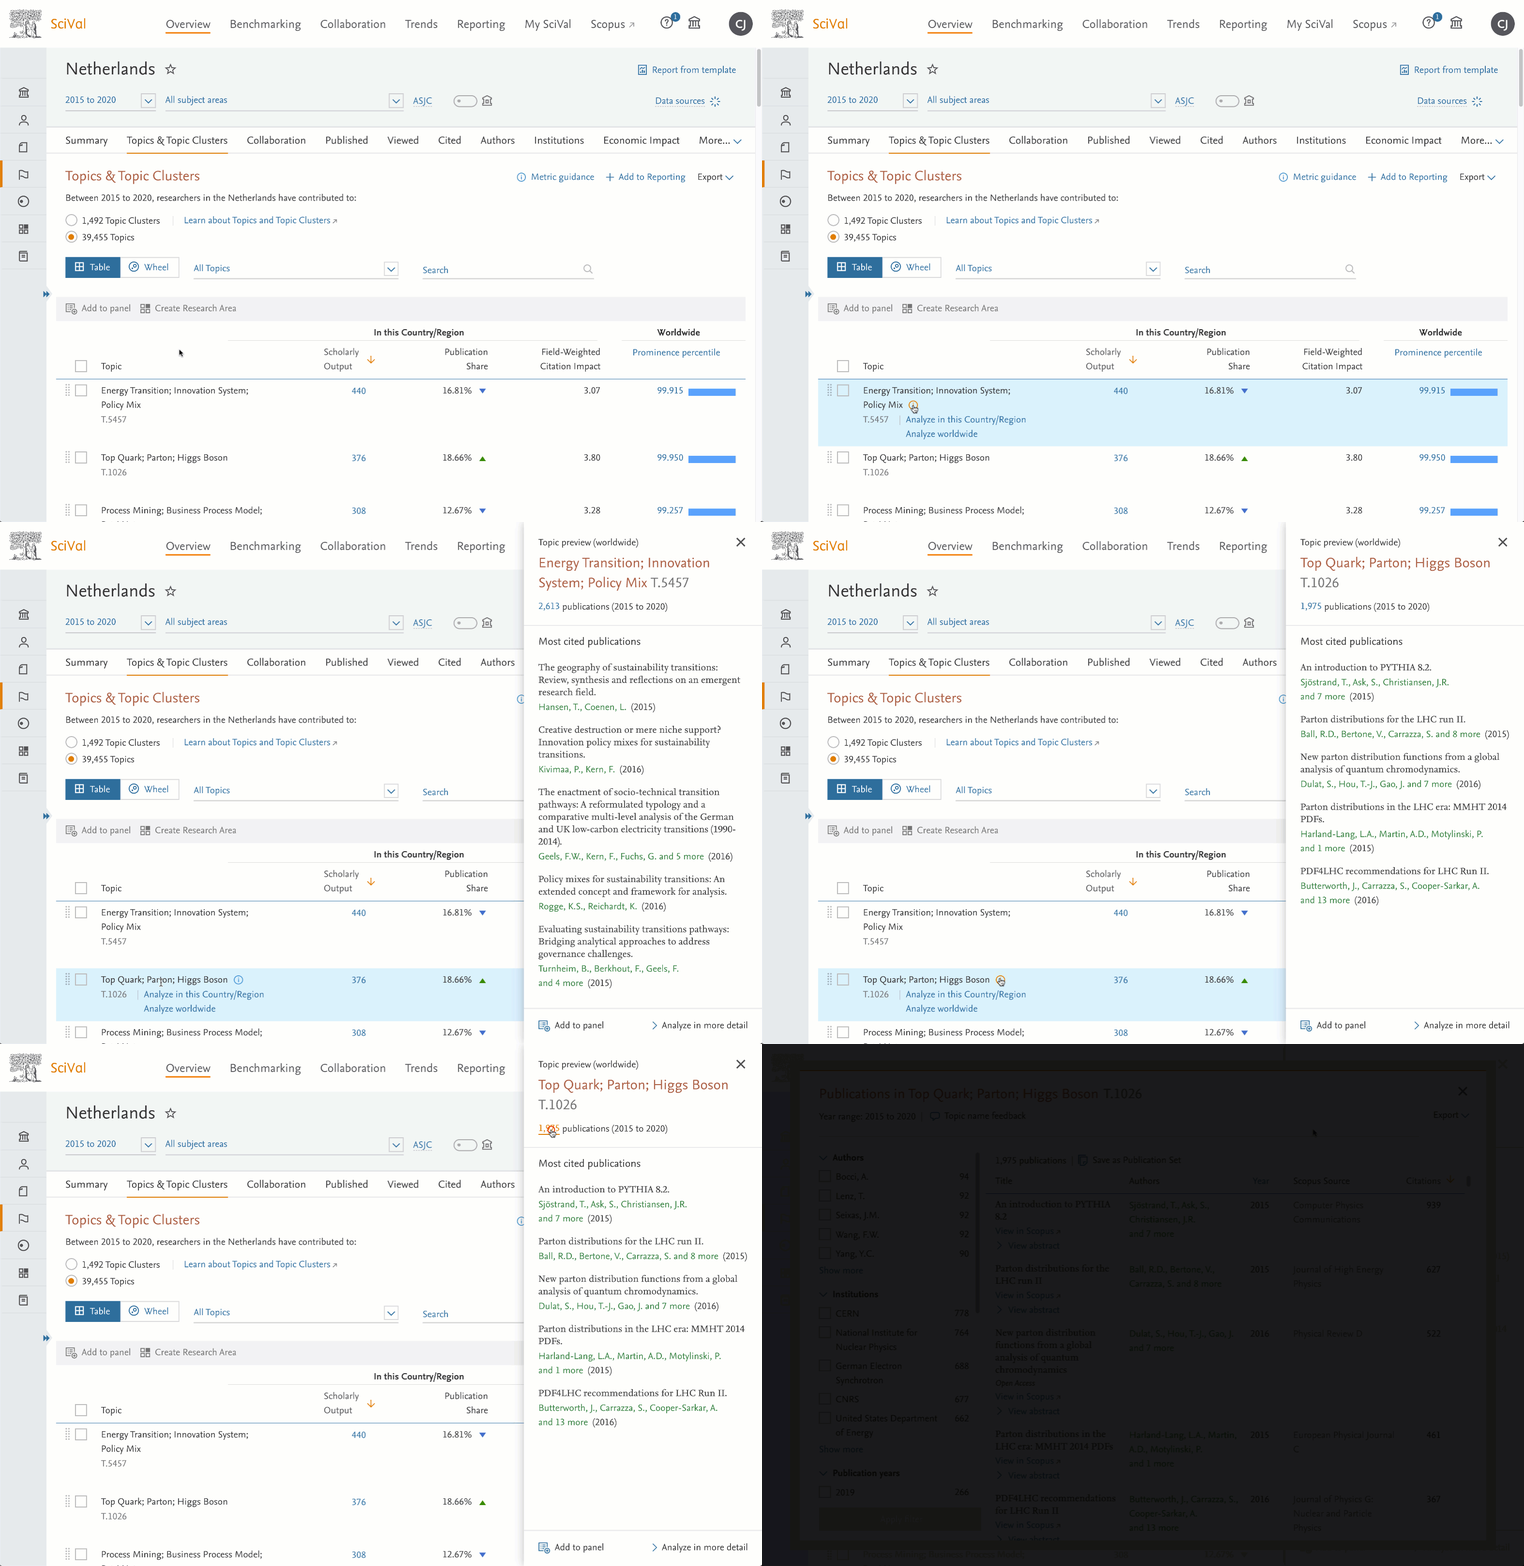
- Increased transparency for Research Areas and Publication Sets
Add a description when creating a Research Area or Publication Set to give more clarity on its composition. The details are visible in My SciVal via a fly-in panel for the entity of interest. Additional information such as the Scopus search query, has also been added to the SciVal provided Research Areas, for example the Curated Research Areas and SDGs.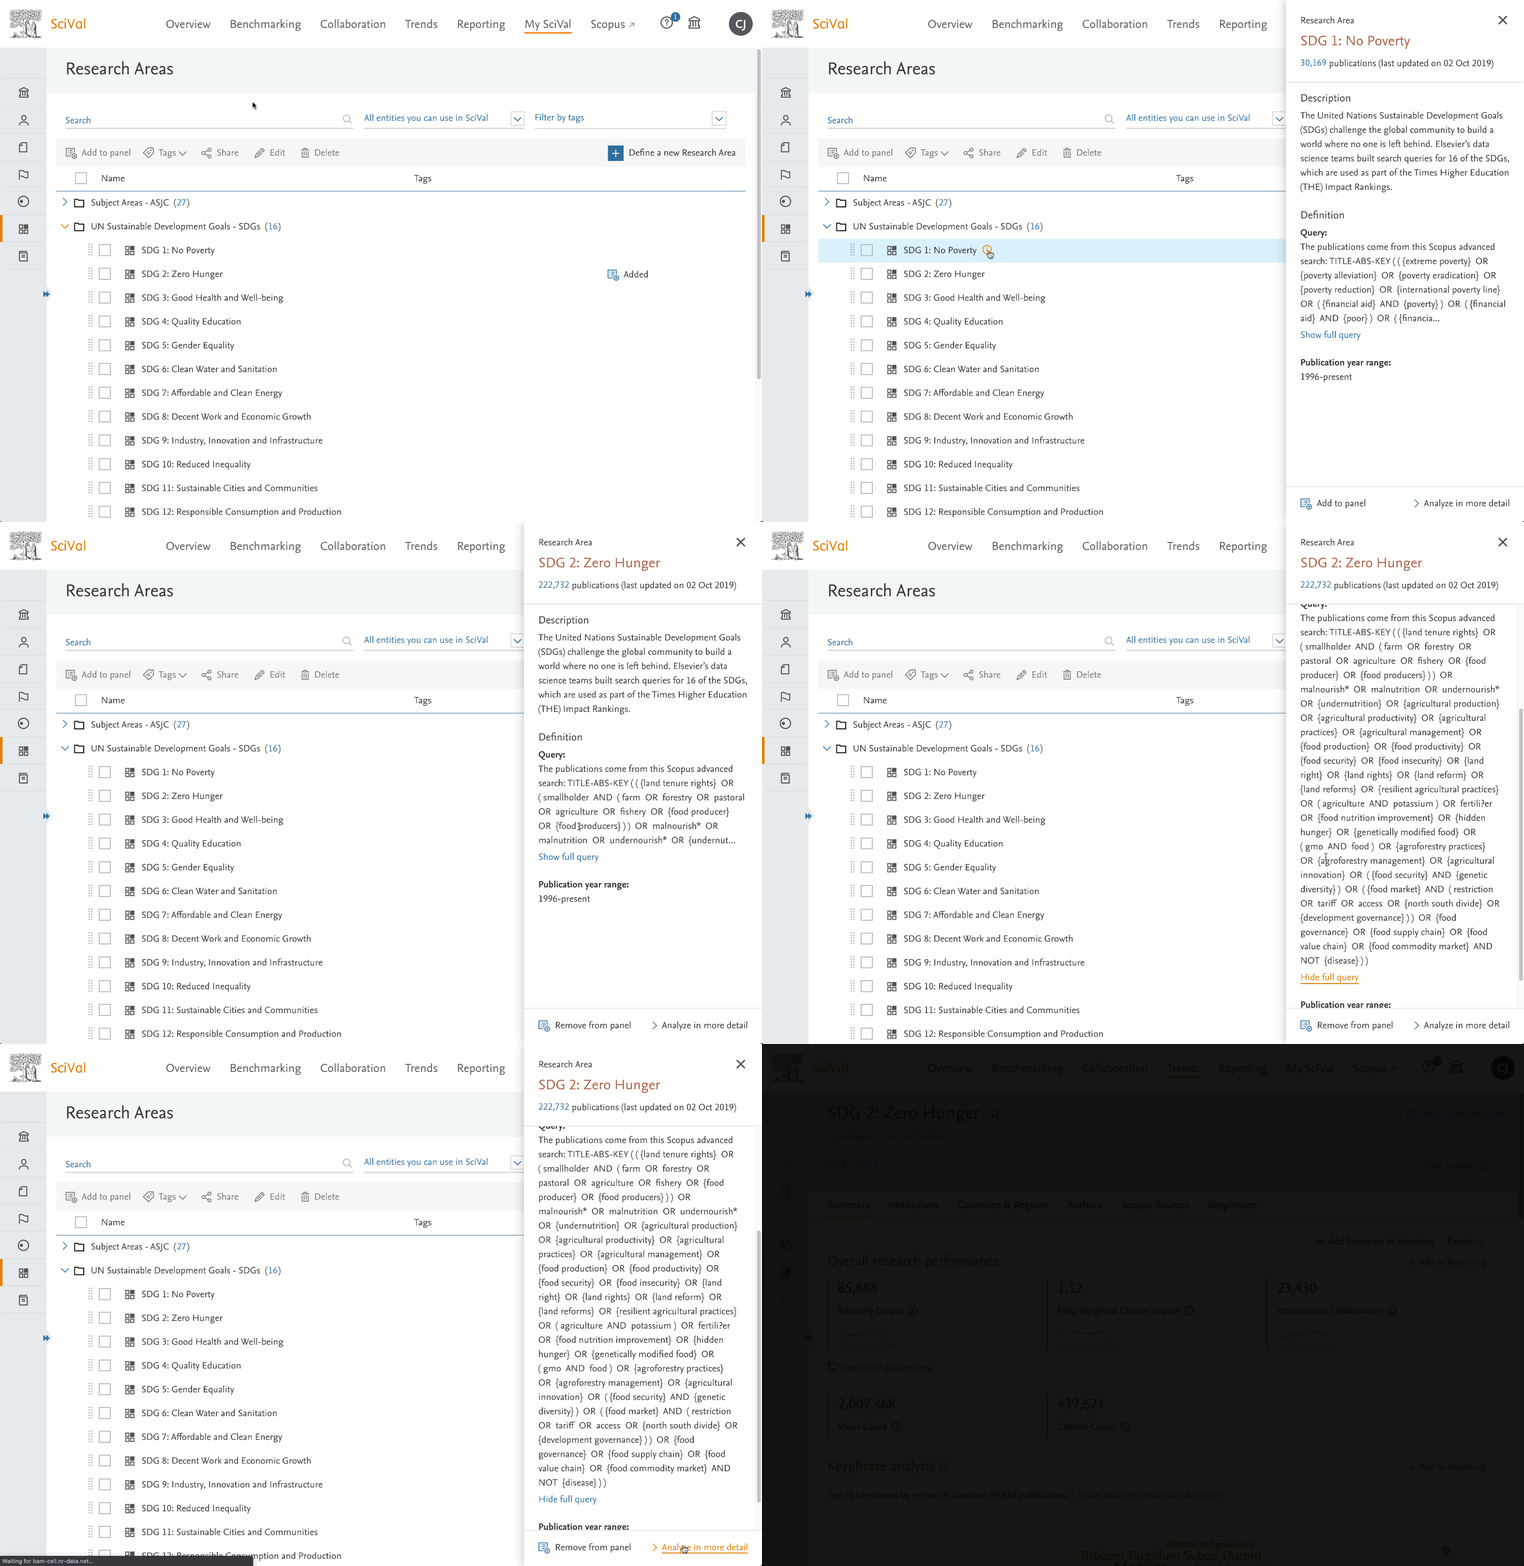
- Help improve Topic and Topic Cluster names
Give feedback and suggest specific keyphrases whilst looking at the publications of a Topic or Topic Cluster. Find the Topic name feedback link when looking at a Topic’s publications in Trends or via the publication link in the Topic transparency fly-in panel.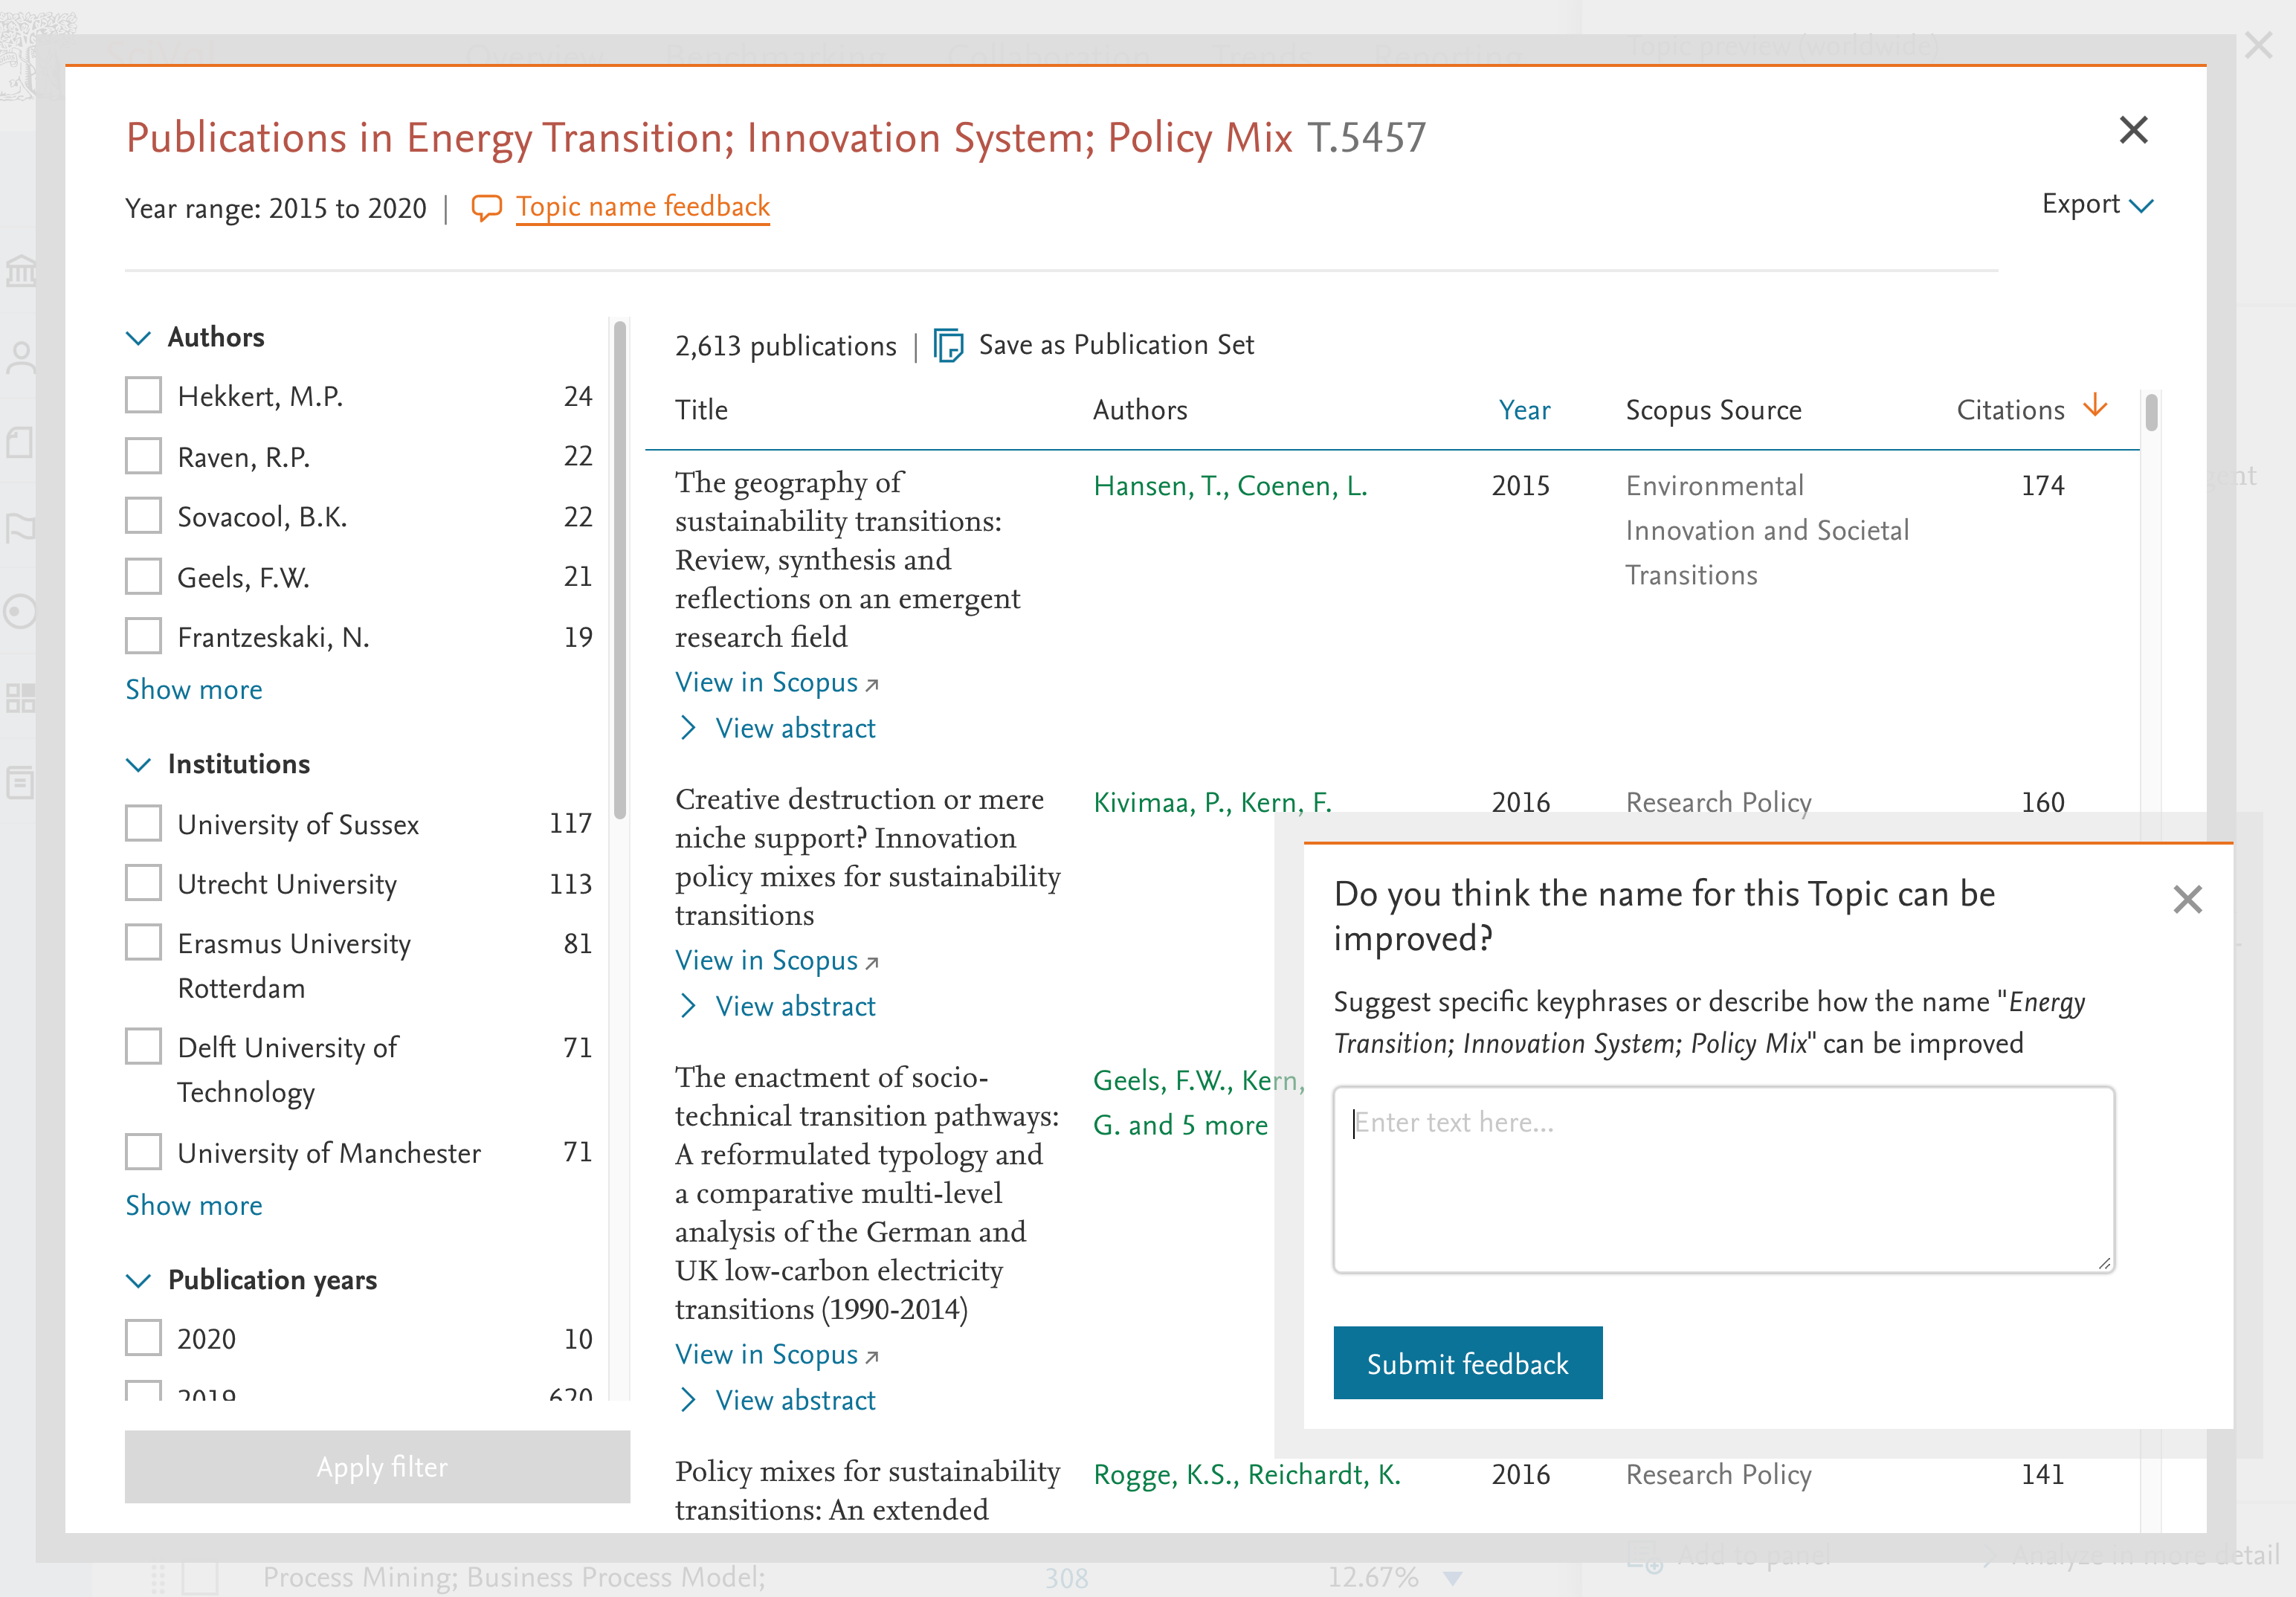
- Reporting enhancements
Using feedback from user testing we will make some improvements to Reporting over the coming months. This month we’ve made the naming of a report more intelligent by automatically changing it when the entity is changed. For example, if the report is called “Country Report – Brazil” and you change the entity to the Netherlands, the name will change to reflect the Netherlands.
We’ve also updated the Reporting module to remember the section you were last in. If you navigate away from Reporting and come back to it in the same session, you’ll return to the section from which you left.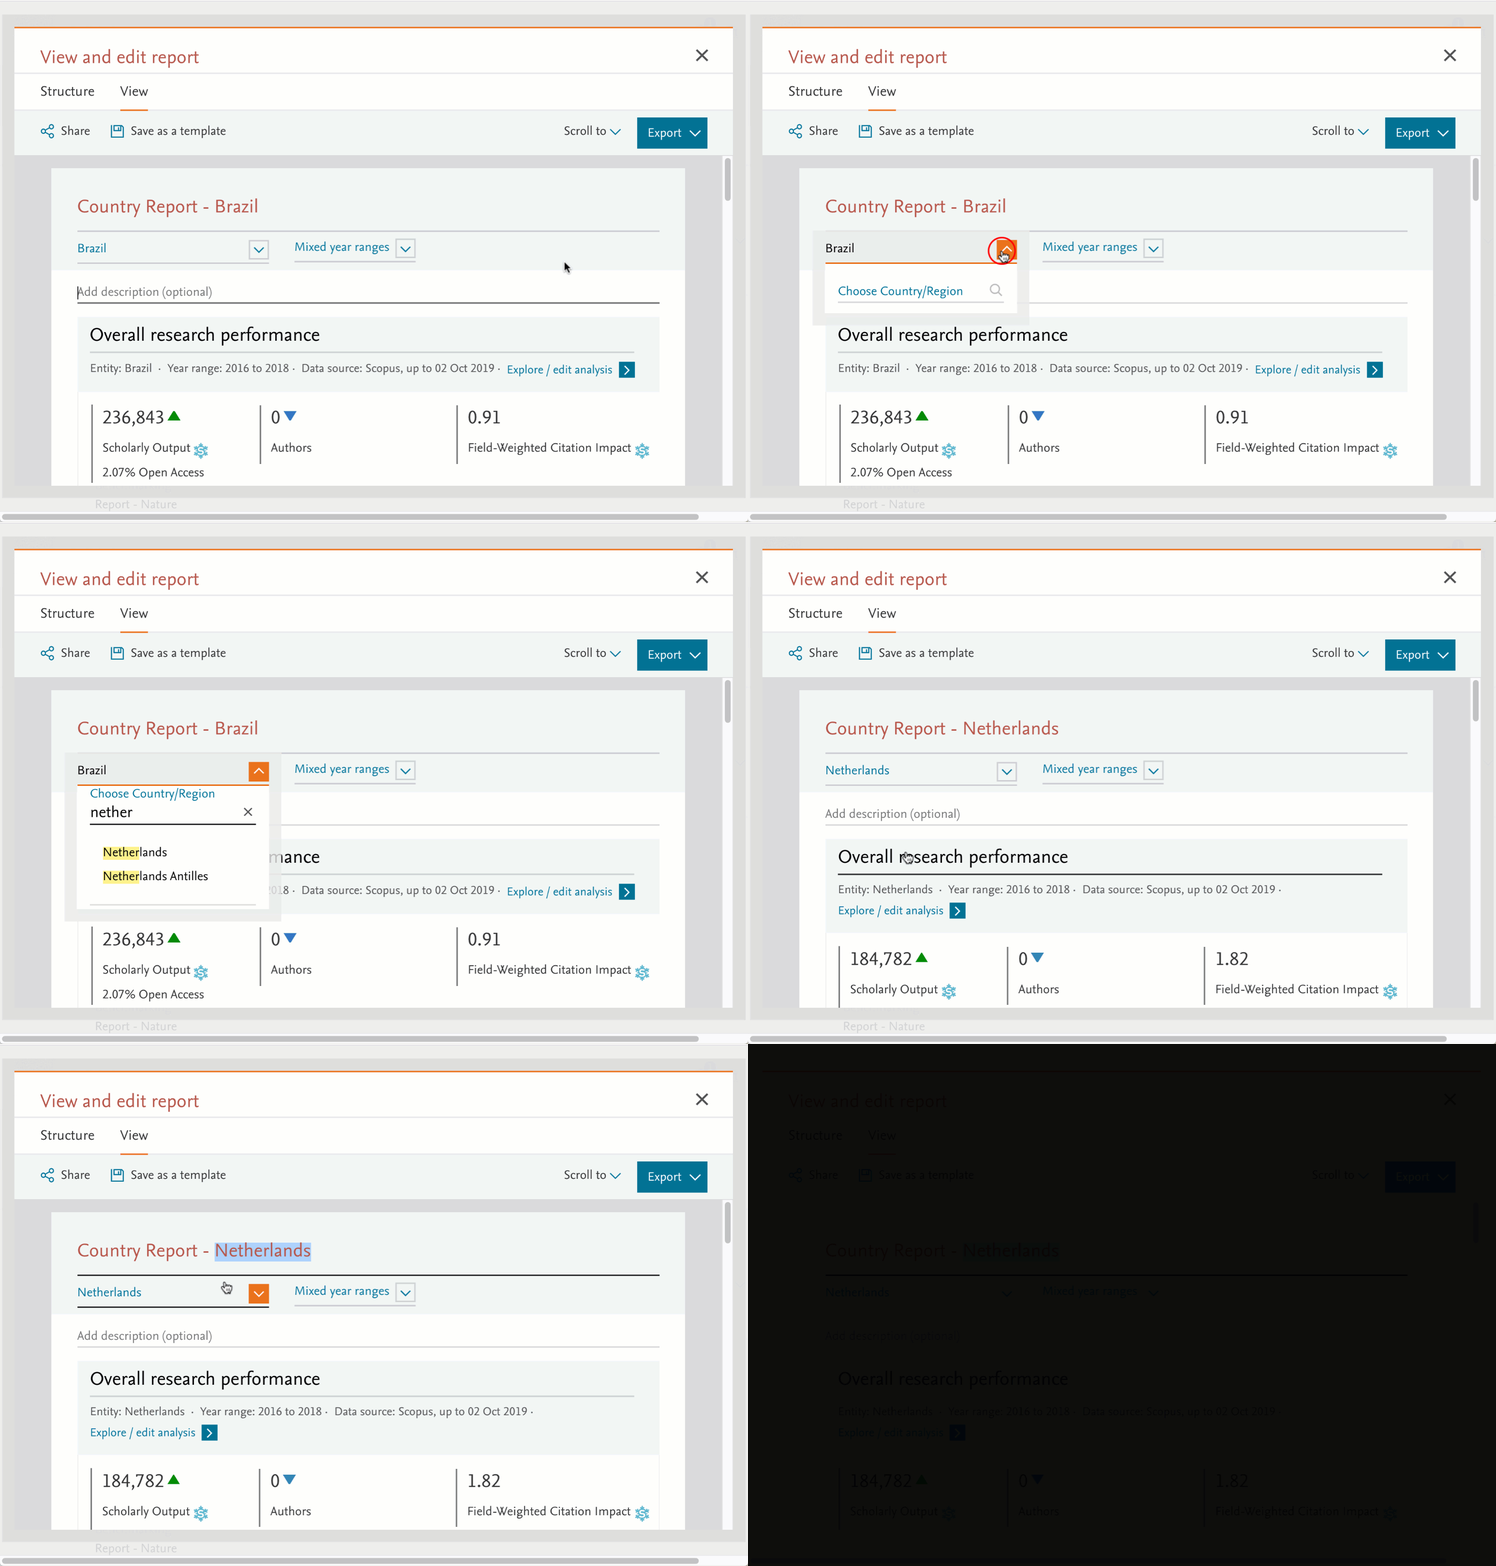
- SDG Data update
We’ve updated the SDG Research Areas with publications up to 6th January 2021
- Scopus Author ID added to Benchmark export
When benchmarking a list of single authors, to avoid confusion when 2 or more authors have similar names, the export now contains not only the author names, but their Scopus author ID as well.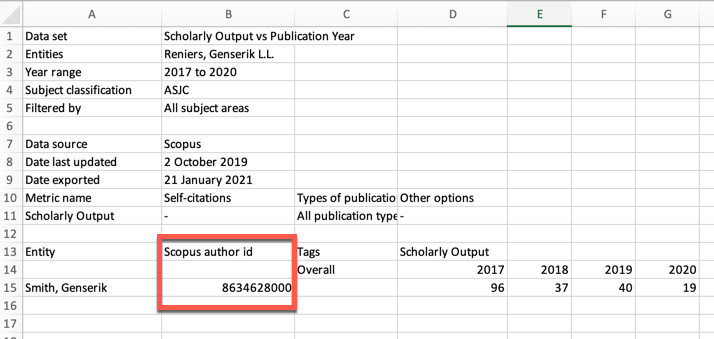
- Enhanced release highlights on the homepage
Get a quick overview of the key release item for the month via an animated gif on the homepage.
 Current Release Notes
Release Notes 2023
Release Notes 2019-2020
Release Notes 2017-2018
Did we answer your question?
Related answers
Recently viewed answers
Functionality disabled due to your cookie preferences