
View by category
The December 8, 2020 release brings Open Access analyses to SciVal, 97 publication classified China SDACD subject categories and an increase in our export limit to 100k publications:
- Get an Open Access overview for all entities
See an instant Open Access (OA) percentage for any entity in Overview, then create a Publication Set and analyze it in more detail. Powered by Unpaywall, the OA content is harvested from over 50,000 publishers and repositories. There are 4 types of OA captured – Gold, Hybrid Gold, Bronze and Green – which allows for granular analyses into of each type for any entity in SciVal. Learn more about the OA filters in SciVal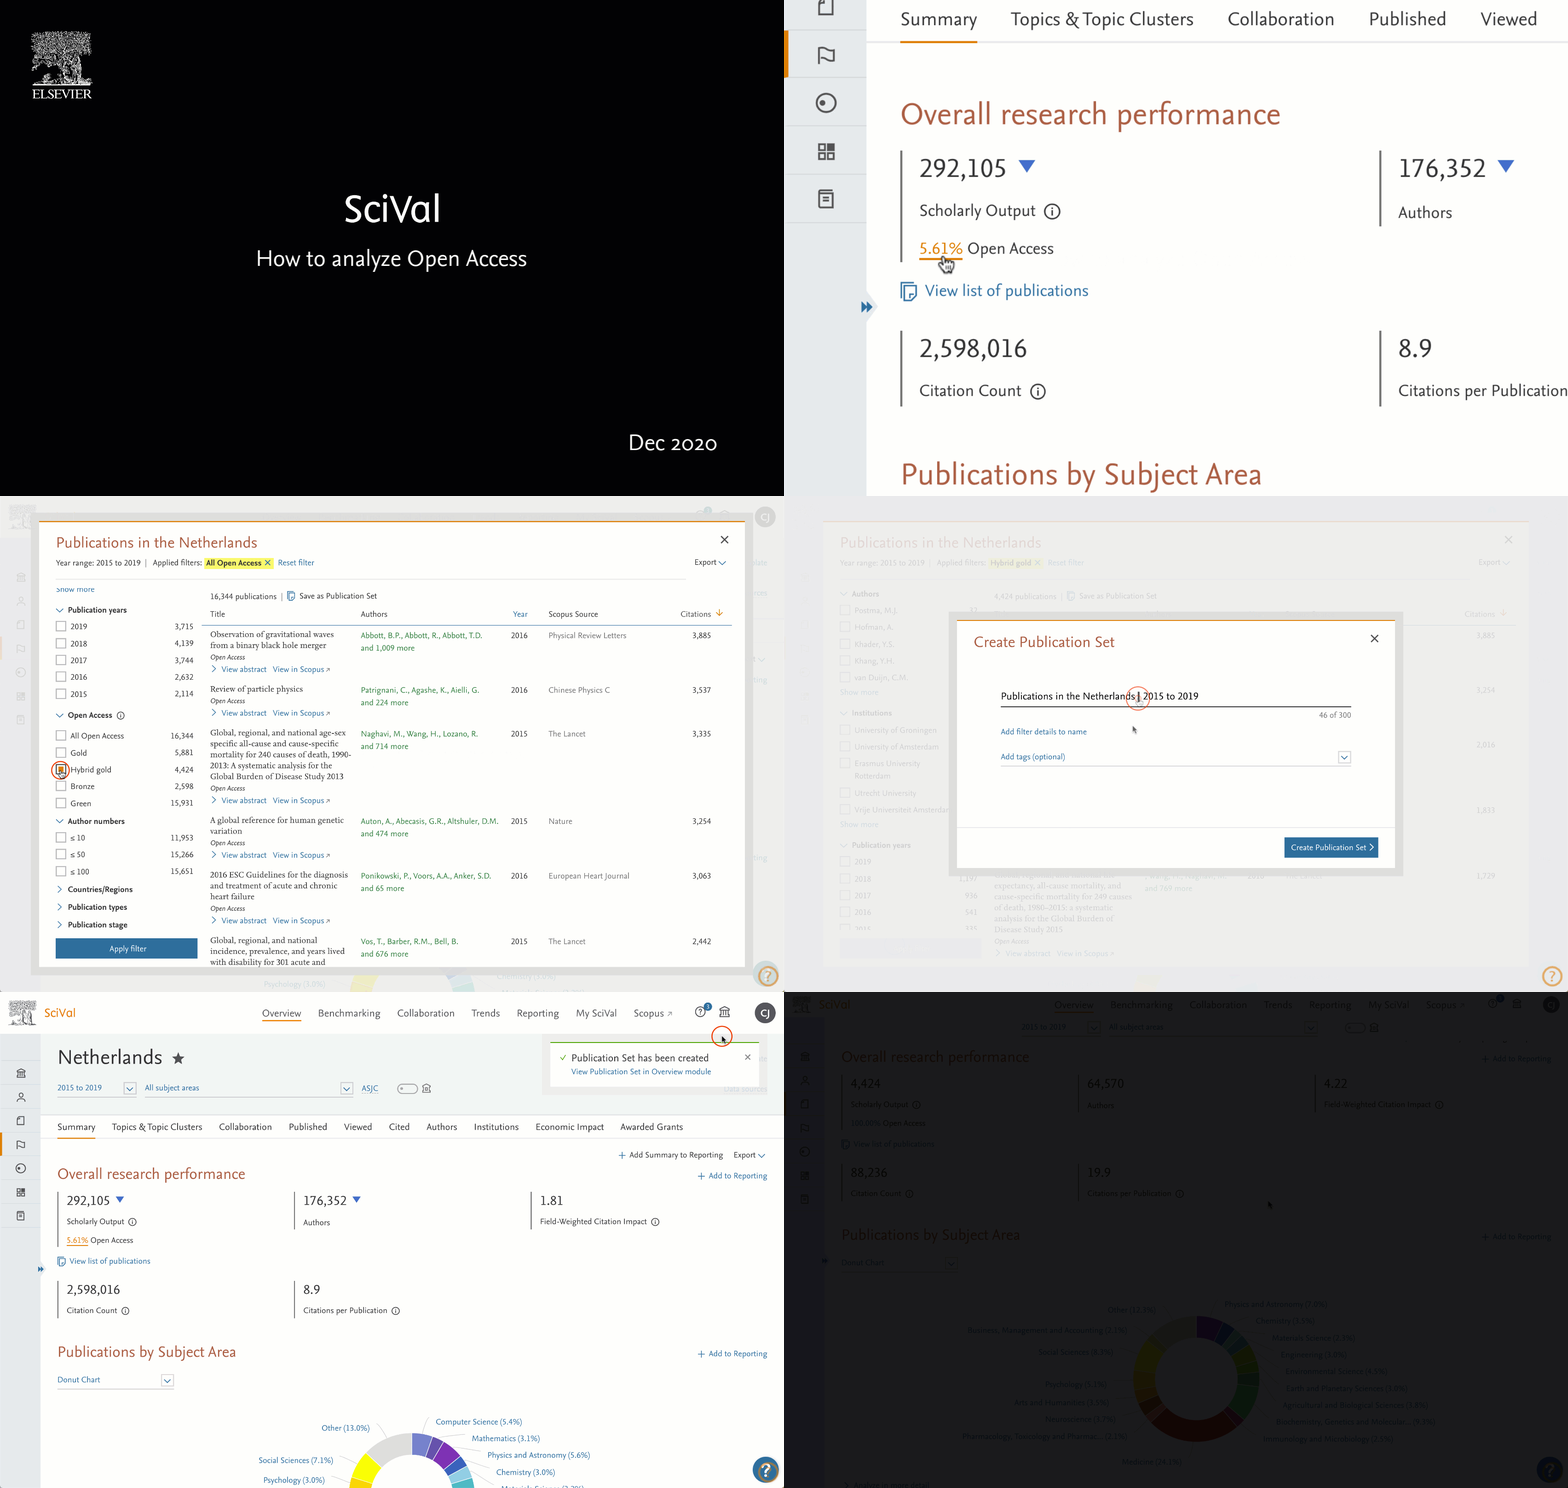
- Analyze publications mapped to 97 China SCADC subject categories
These categories can help Chinese institutions with their research evaluation and comparative performance reports. They have been mapped at a publication level rather than a journal level, using machine learning techniques. To use them, search for one of the 97 categories as a Research Area, using either the code or category name (in English or Chinese).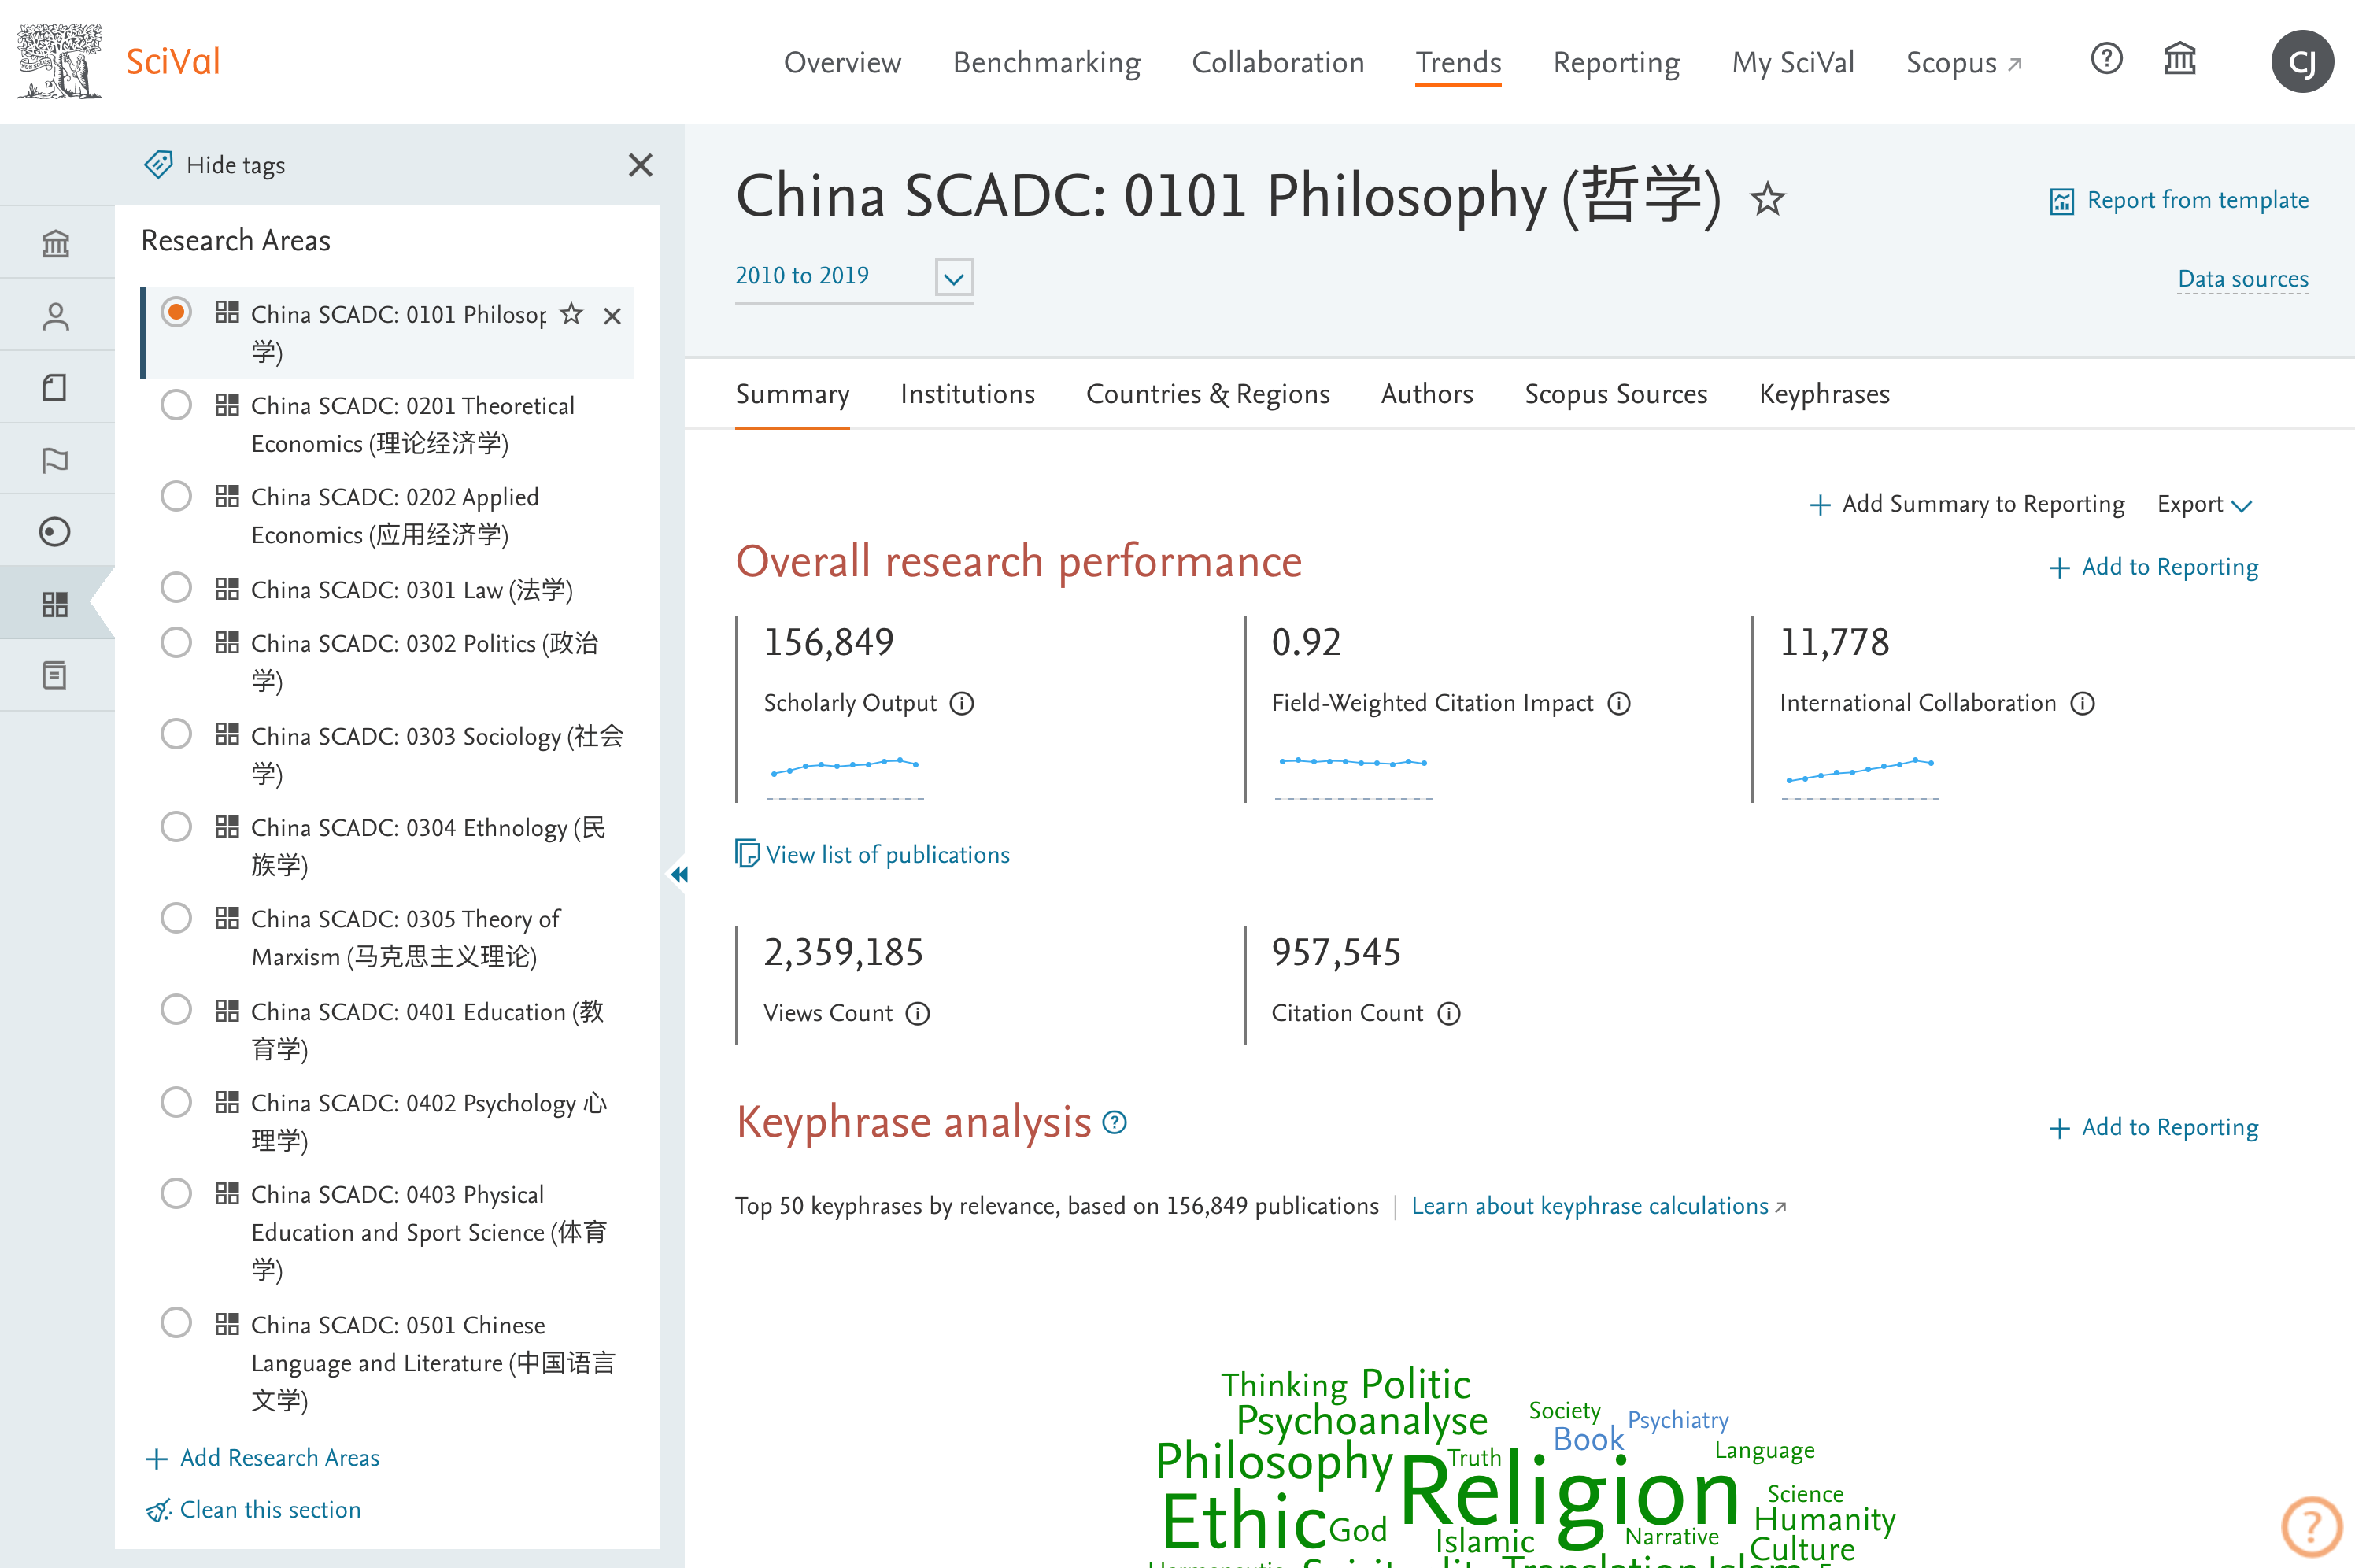
- Export metrics for 100,000 publications at once
We’ve increased our publication export capability from 20k to 100k, making it easier to analyze large entities such as institutions and countries outside SciVal. We’ve also made the filter options more powerful… - More powerful publication filter options
Select multiple options within each filter category to view only the publications of interest. For example, select Green or Gold OA publications for 2016 or 2017 for the Netherlands or the UK. Export up to 100k publications or create a Publication Set and analyze in more detail in SciVal.
Note: if within one filter category, for example the year range, you choose one year and apply the filter, then choose a second year range and apply the filter, an AND operator will be applied. If instead you choose both years at once and apply the filter, an OR operator will be applied. The filter breadcrumb at the top of the page shows this operator has been applied.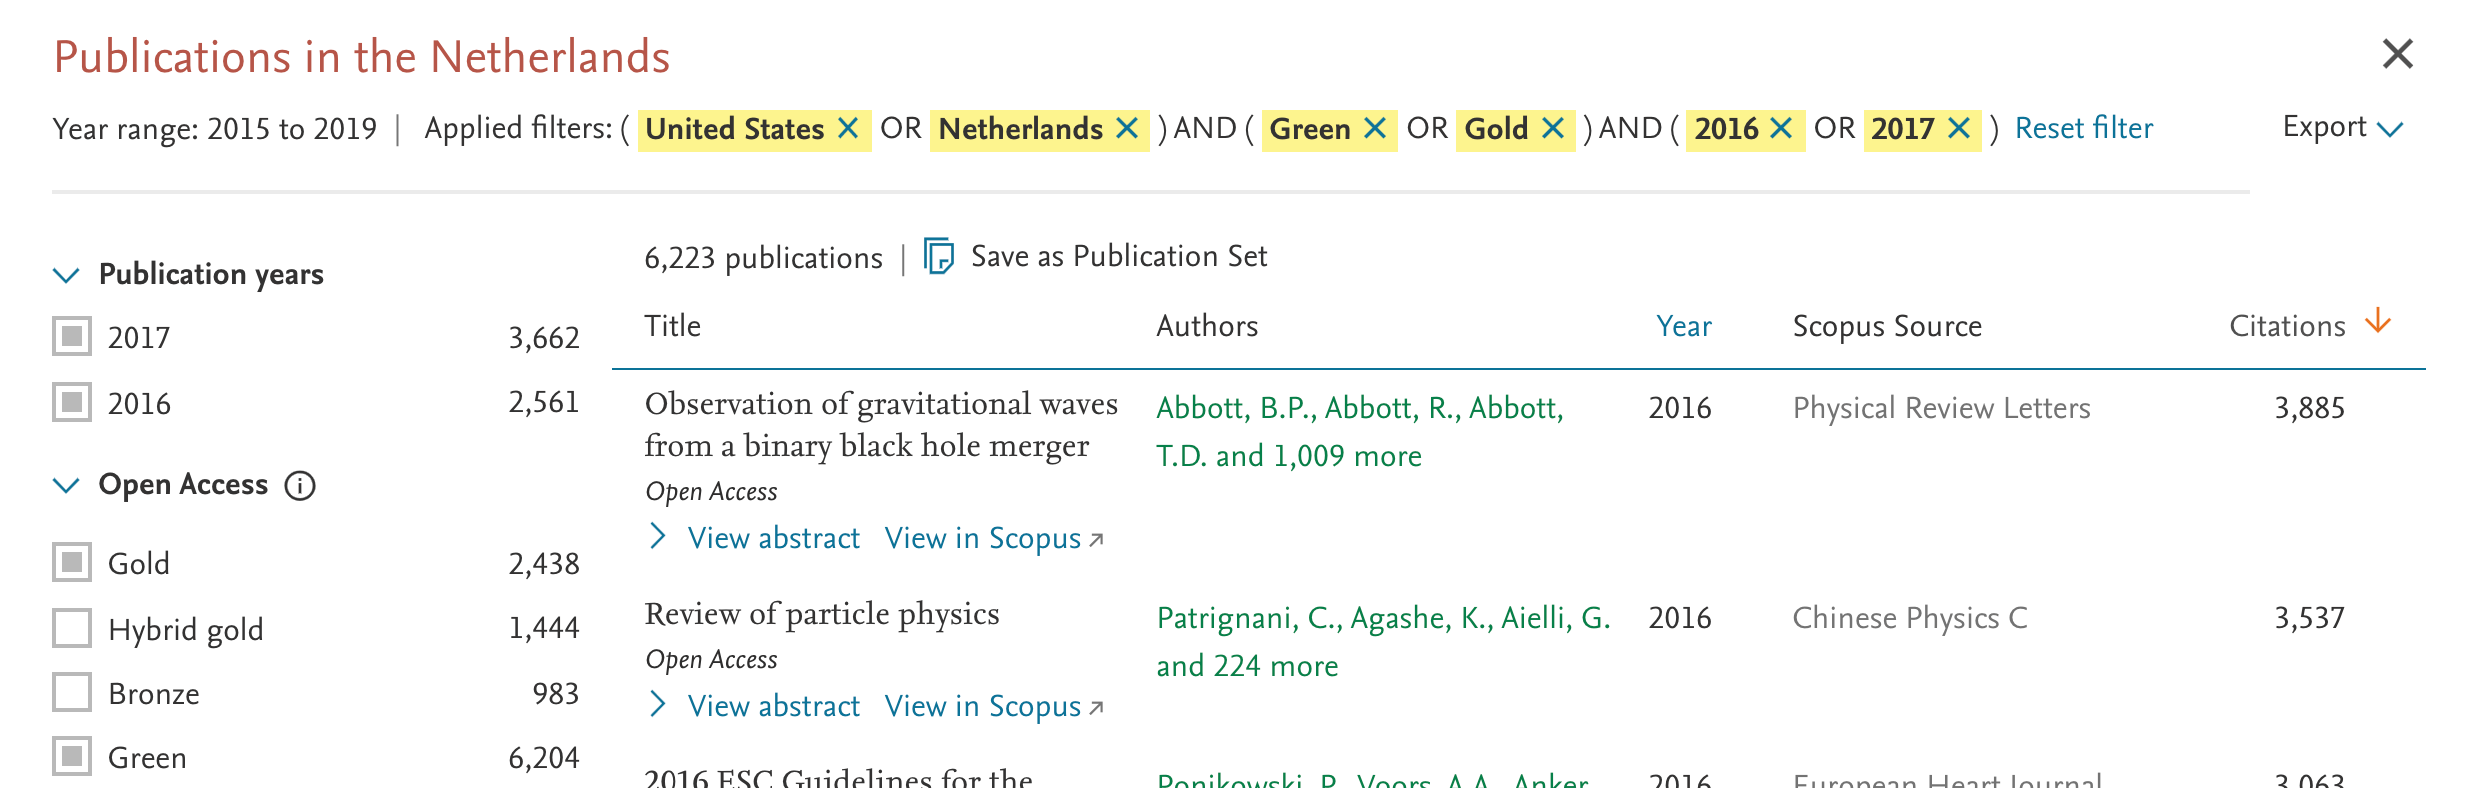
- New Research Areas such as COVID-19 and General Coronavirus Research
We’ve added a new folder of curated pre-defined Research Areas, which will grow over time. We’ve also made it easier to locate other pre-defined Research Areas, such as the UN SDGs, by putting them in folders.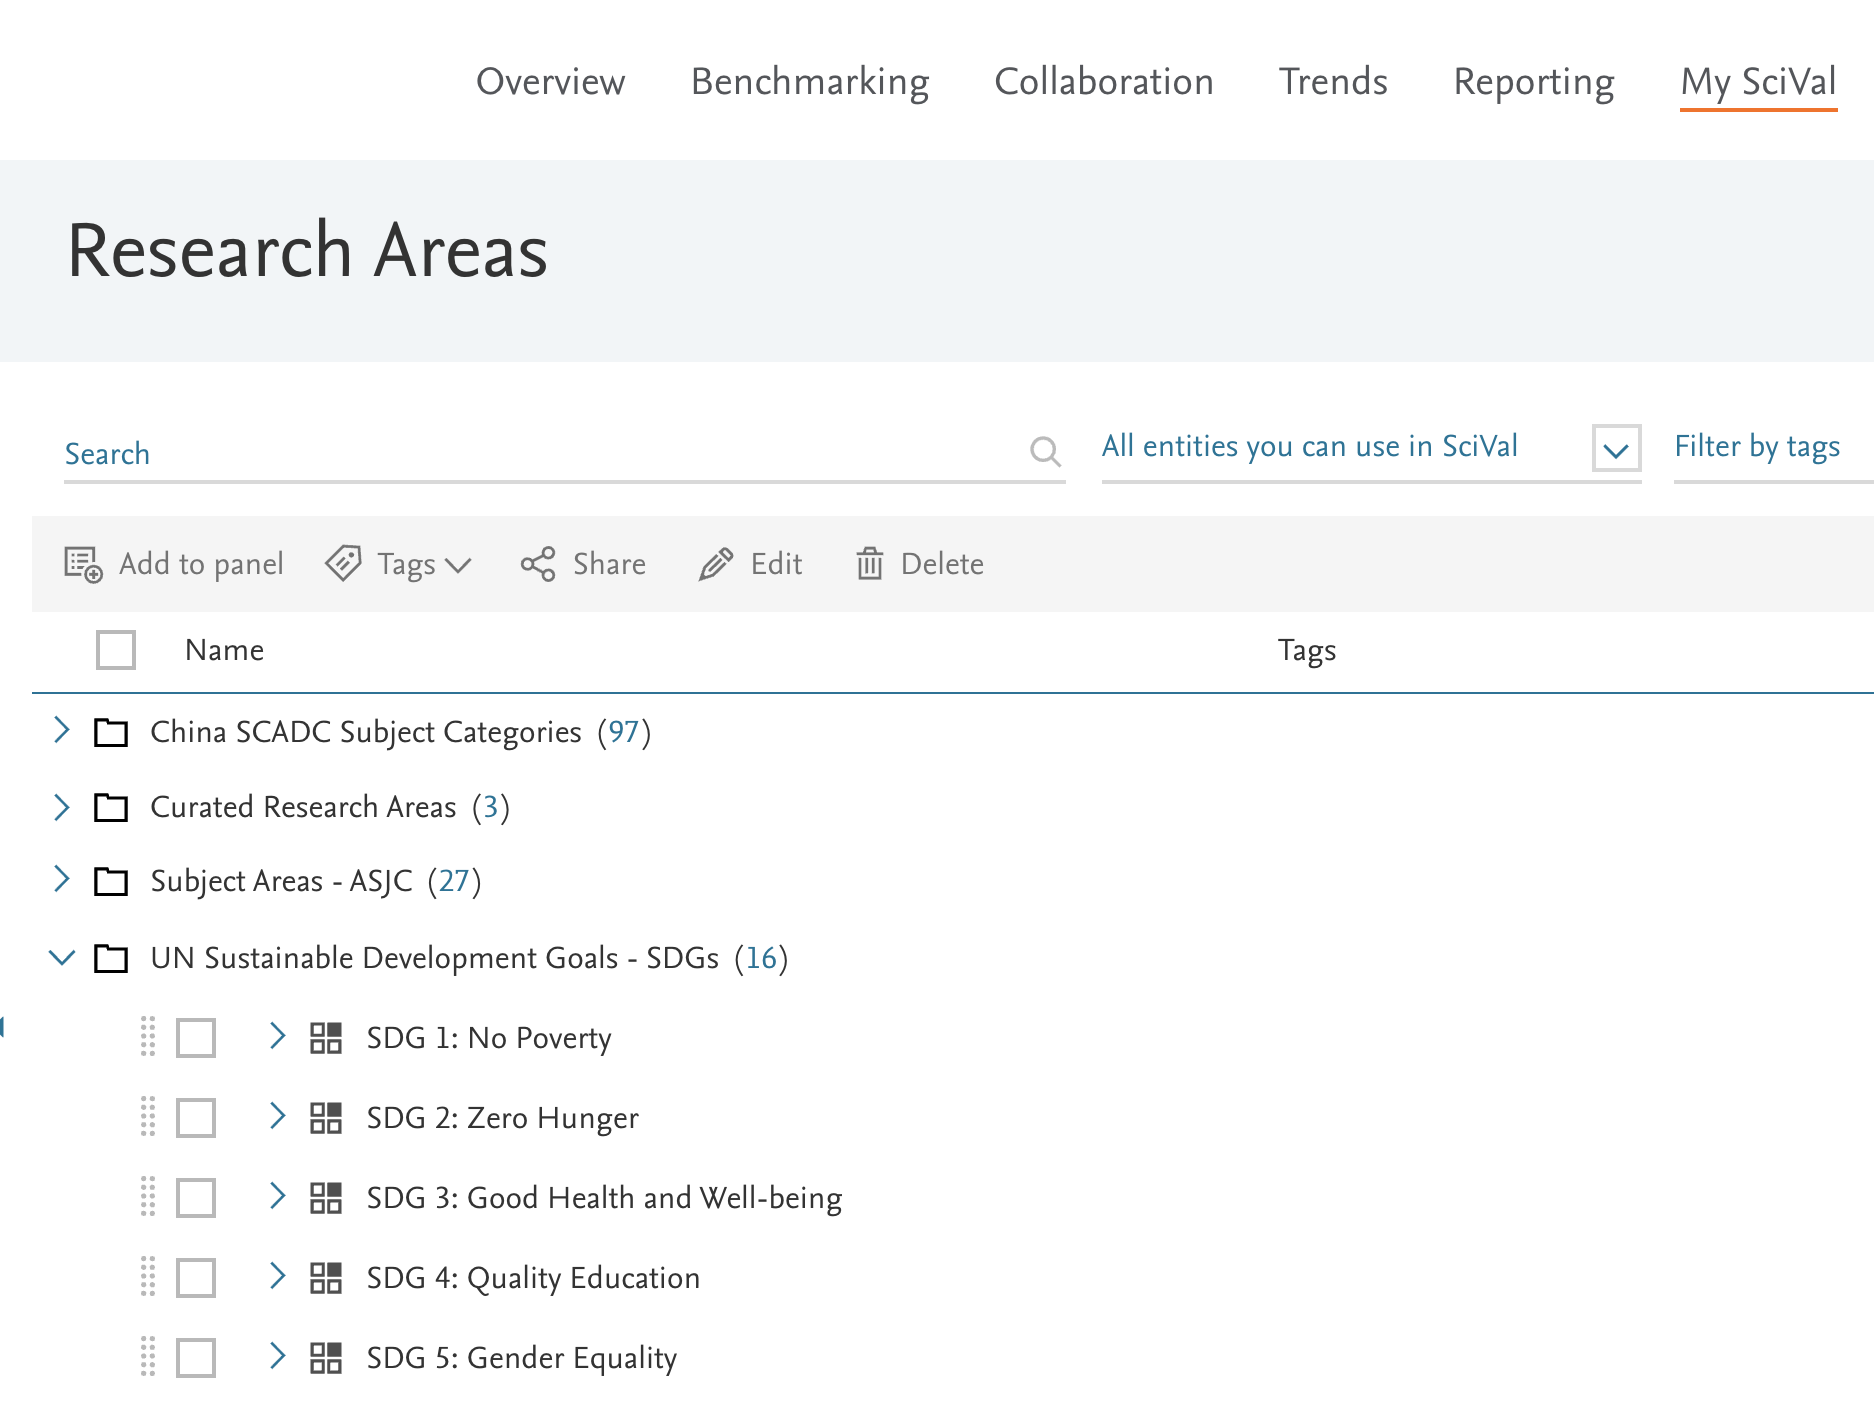
- More metrics guidance in tables
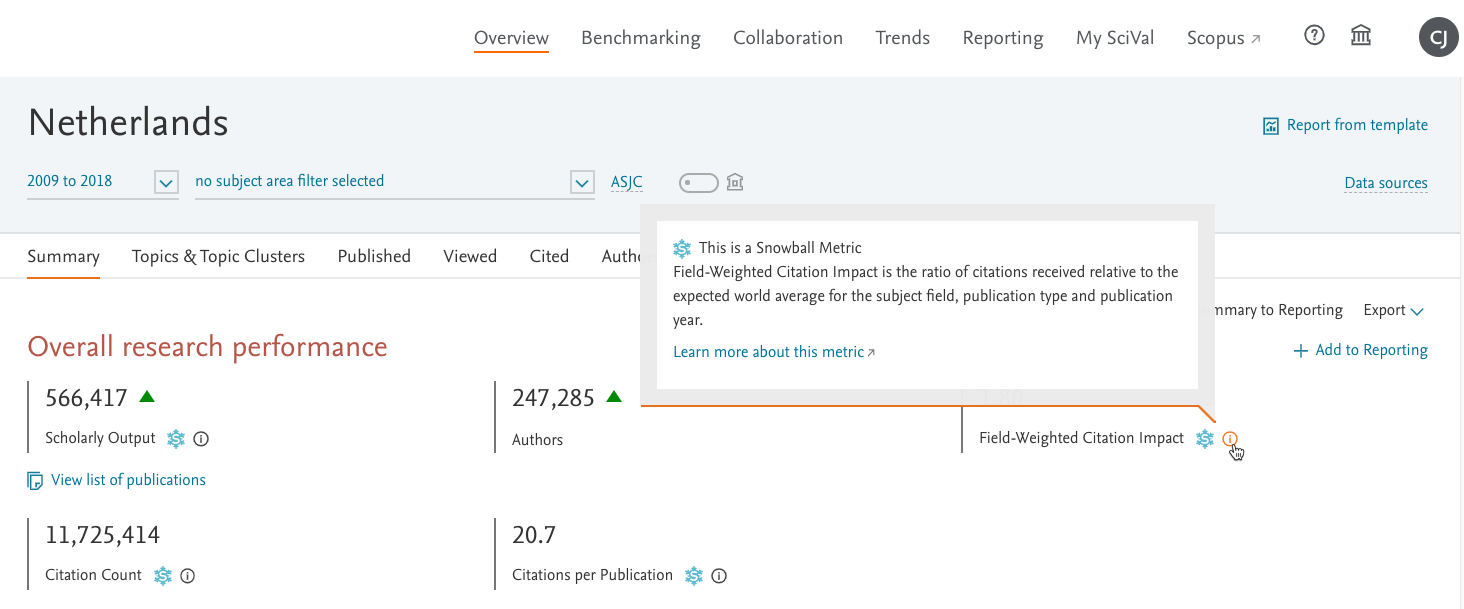
To aid the responsible use of metrics, you can now get information on the metrics in the tables in Overview. Click the metrics guidance link and a panel to the right of the screen gives you contextual information about the metrics selected in the table.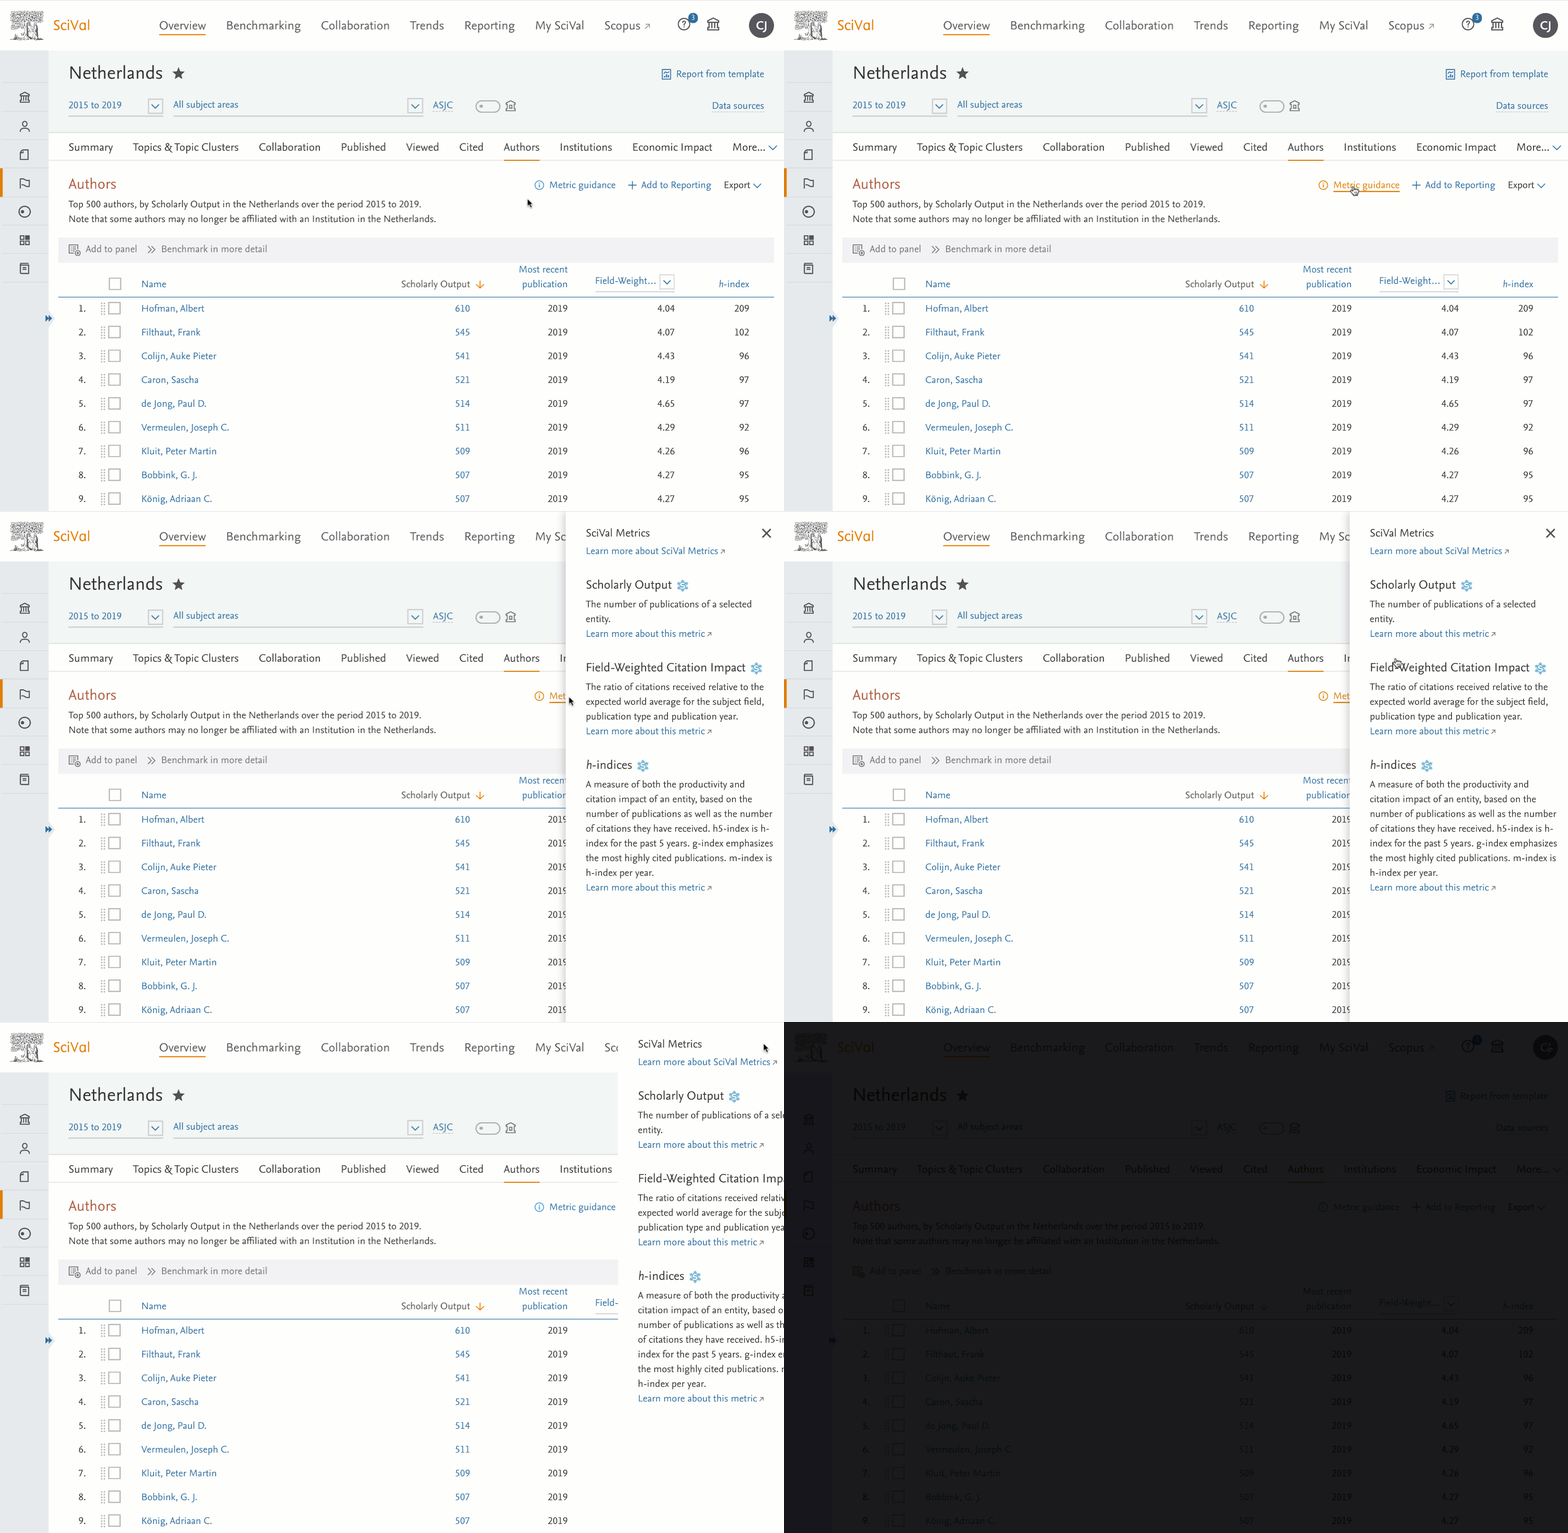
- Highlight and position Topic information on the Wheel with draggable tooltips
Simply hover over a Topic for the tooltip to appear, then drag it to the desired location so that the chart’s layout fits your needs.
- Improved search on the entity panel
Search across all entities and your tags to easily find the entity you’re interested in.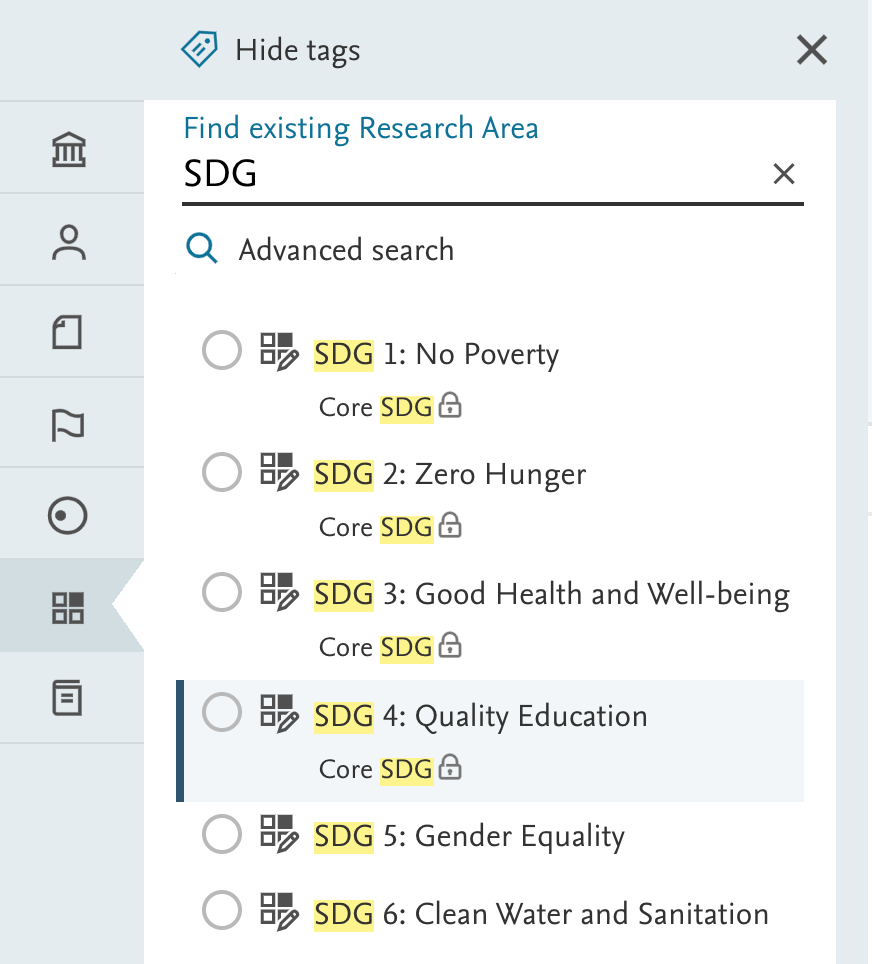
- Dissect an entity by keyphrases of interest and examine in detail as a Publication Set
A new option to view the list of publications for a selected set of keyphrases in Trends, lets you examine an entity such as a Topic, Research Area or Publication Set, based upon core terms of interest.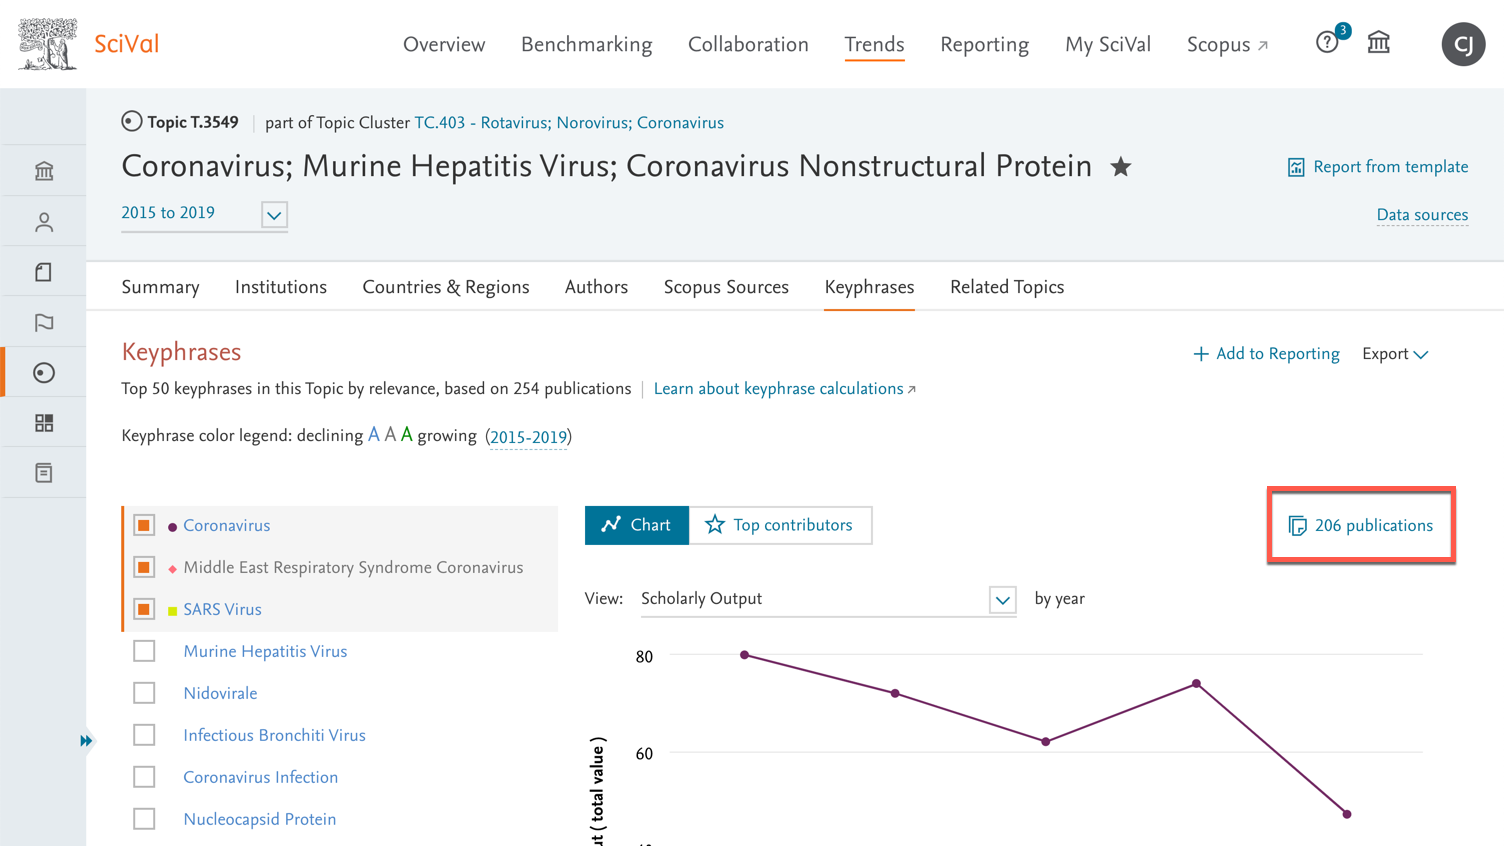
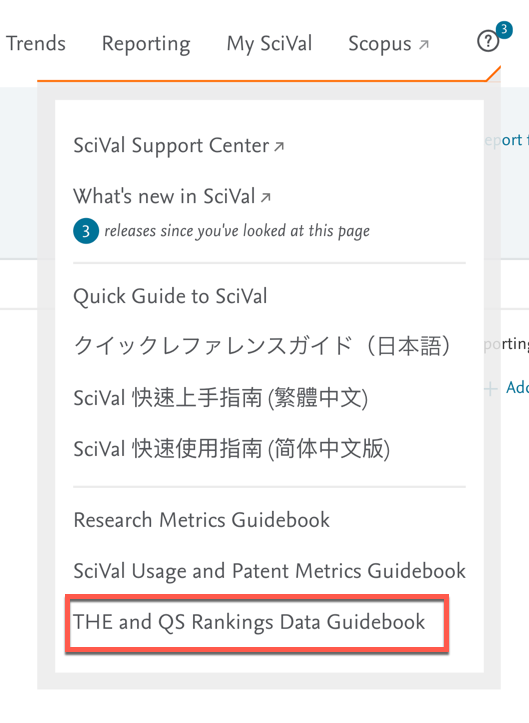
- New THE and QS Ranking Data Guidebook has been added to the help icon to complement the Research Metrics and Usage and Patent guidebooks.
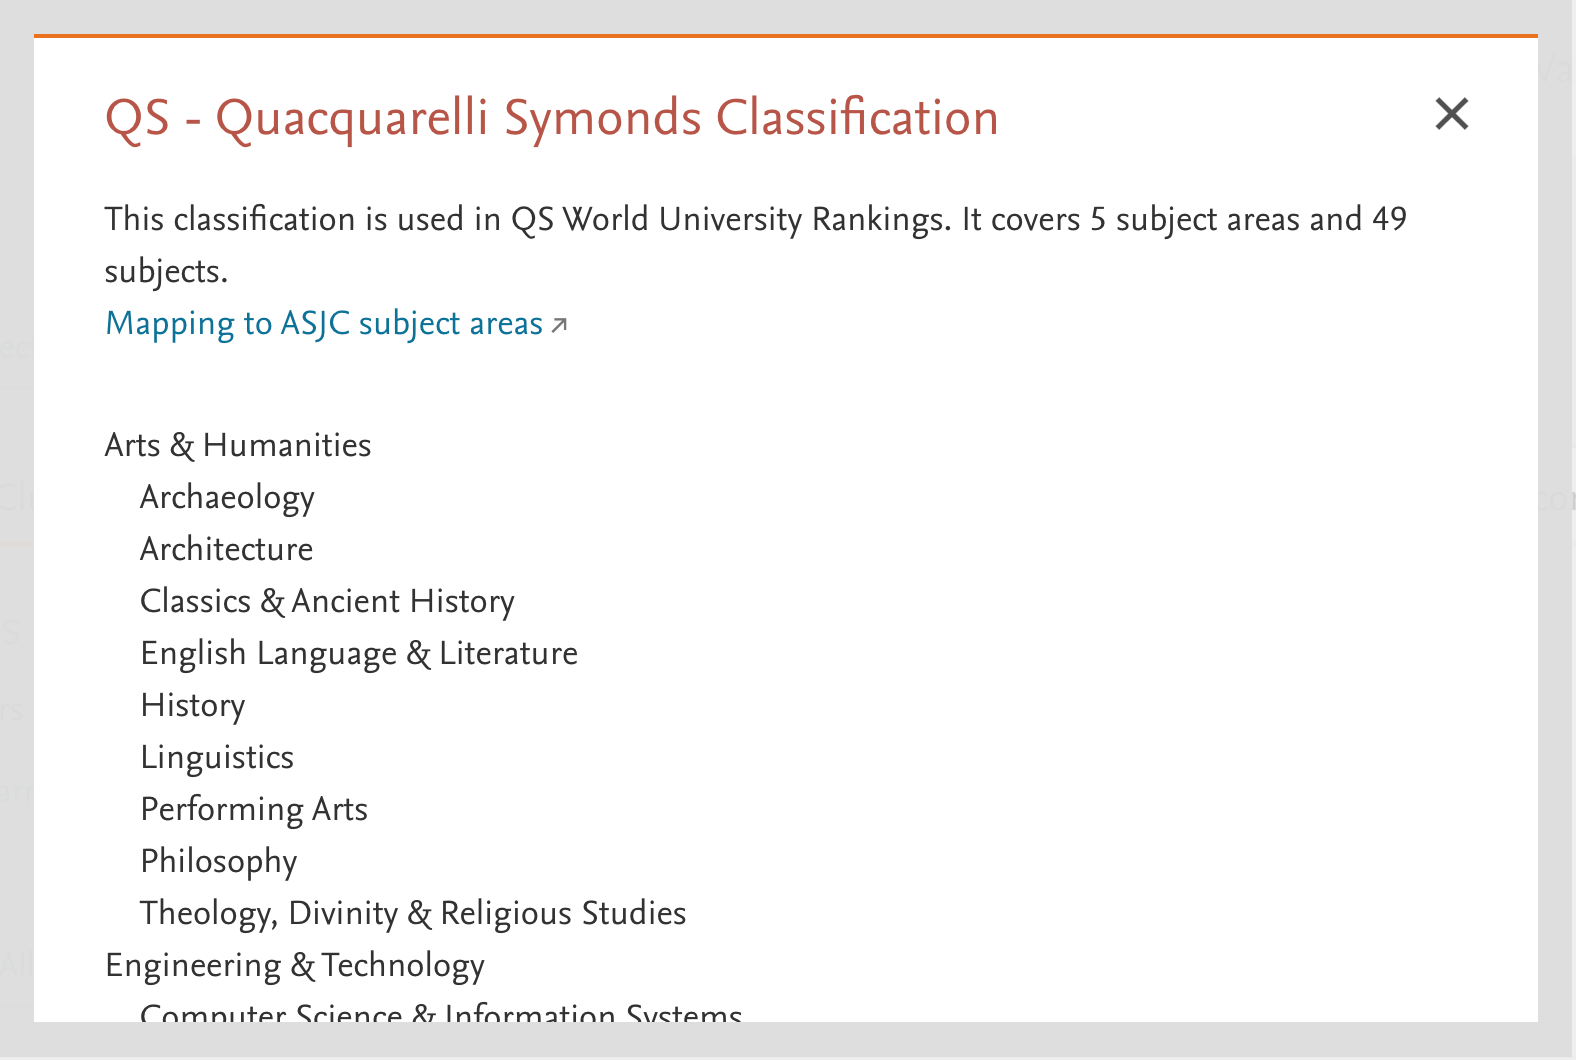
- Update to the QS subject classification to display the new categories for 2020, including Engineering – Petroleum, Geology and Geophysics. Download the full ASJC to QS mapping
We're upgrading the SciVal supported browsers with a switch from support of IE11 to MS Edge
For any customers accessing SciVal using IE11, you must switch to one of our supported browsers to ensure you have the full functionality of the site. Learn more
- Additional release items
- Add the Topic table heatmap to Reporting for institution groups of 20 or less.
- We’ve reduced the space webinars take on the homepage, limiting the initial view to the top three.
- When the entity panel is empty, we’ve added more guidance to help users get started.
The October 20, 2020 release allows you to export the timeline motion chart, along with a new trail option and launches an improved support center:
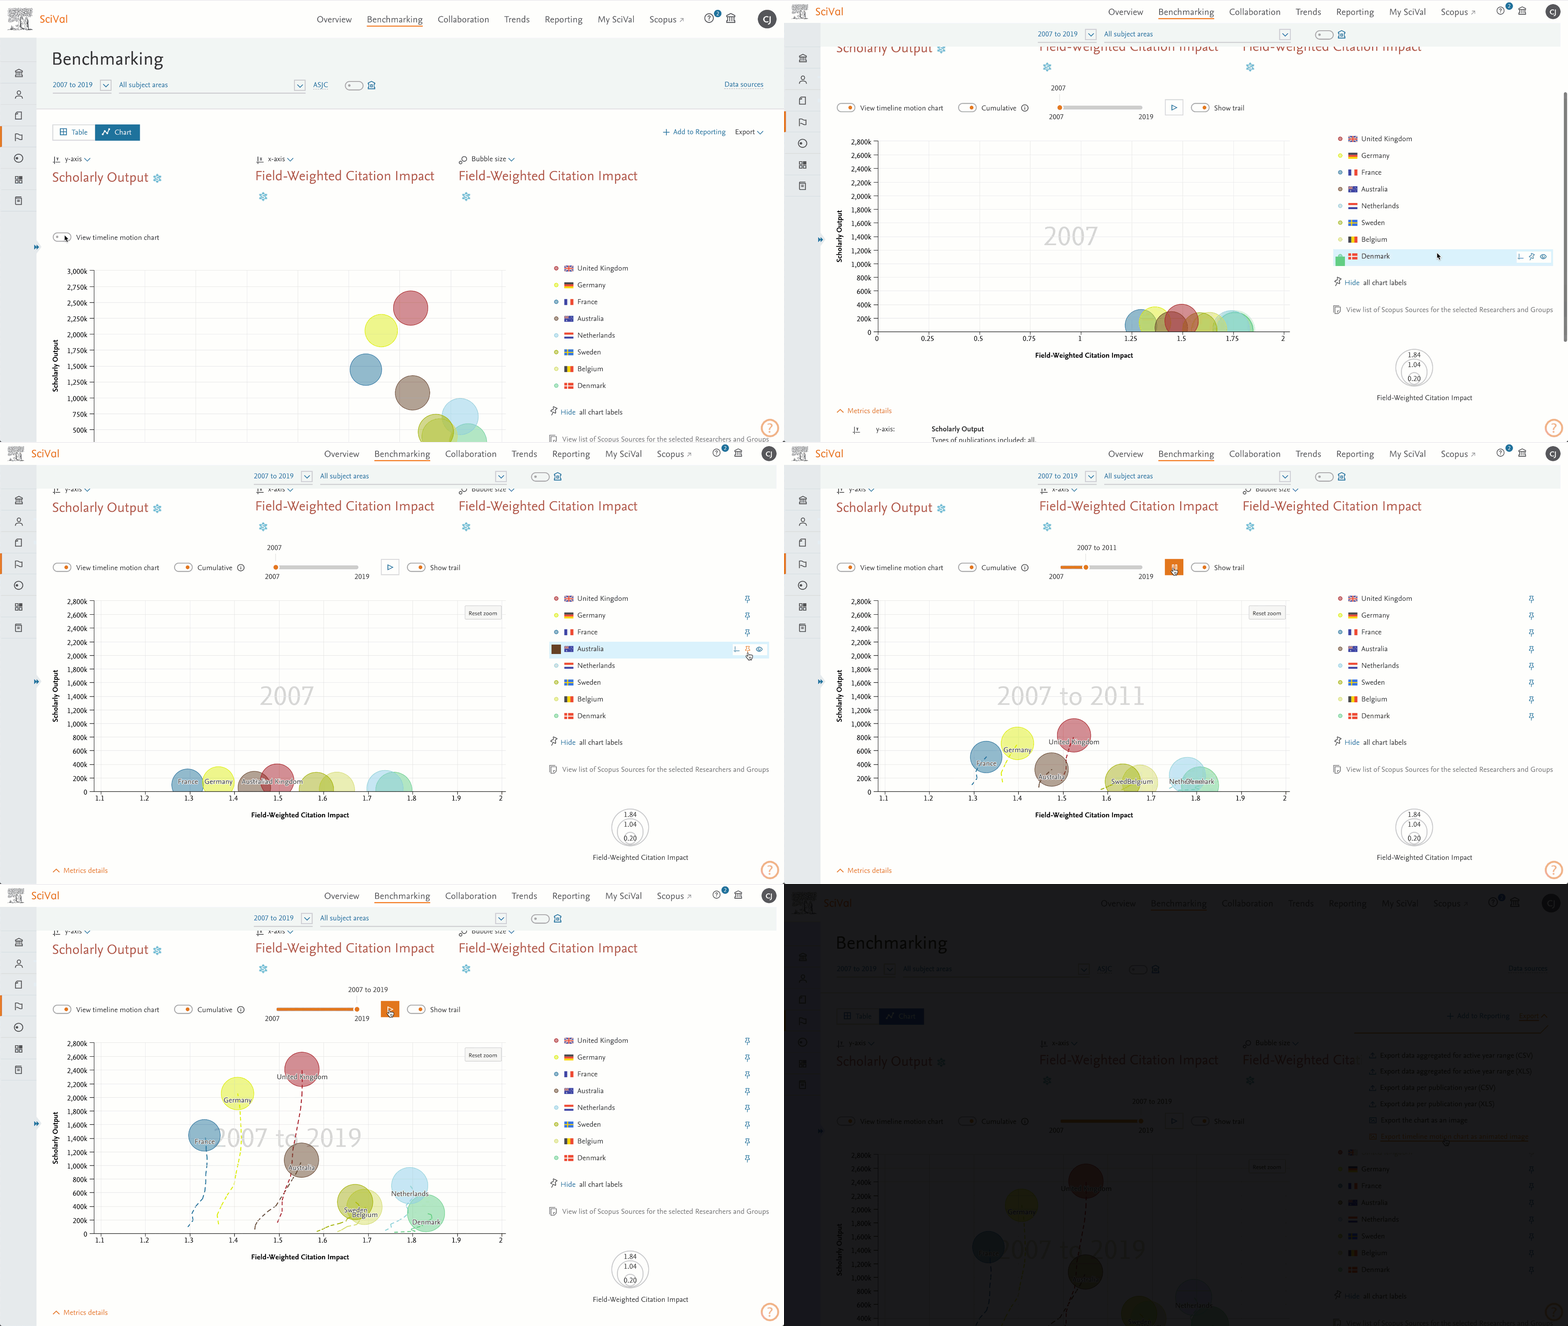
- Timeline motion chart - export as an animated gif, plus new trail option
Use the motion chart in a presentation and bring your analysis to life. The new trail option lets you easily see the progress over time and can be included as part of the gif file.
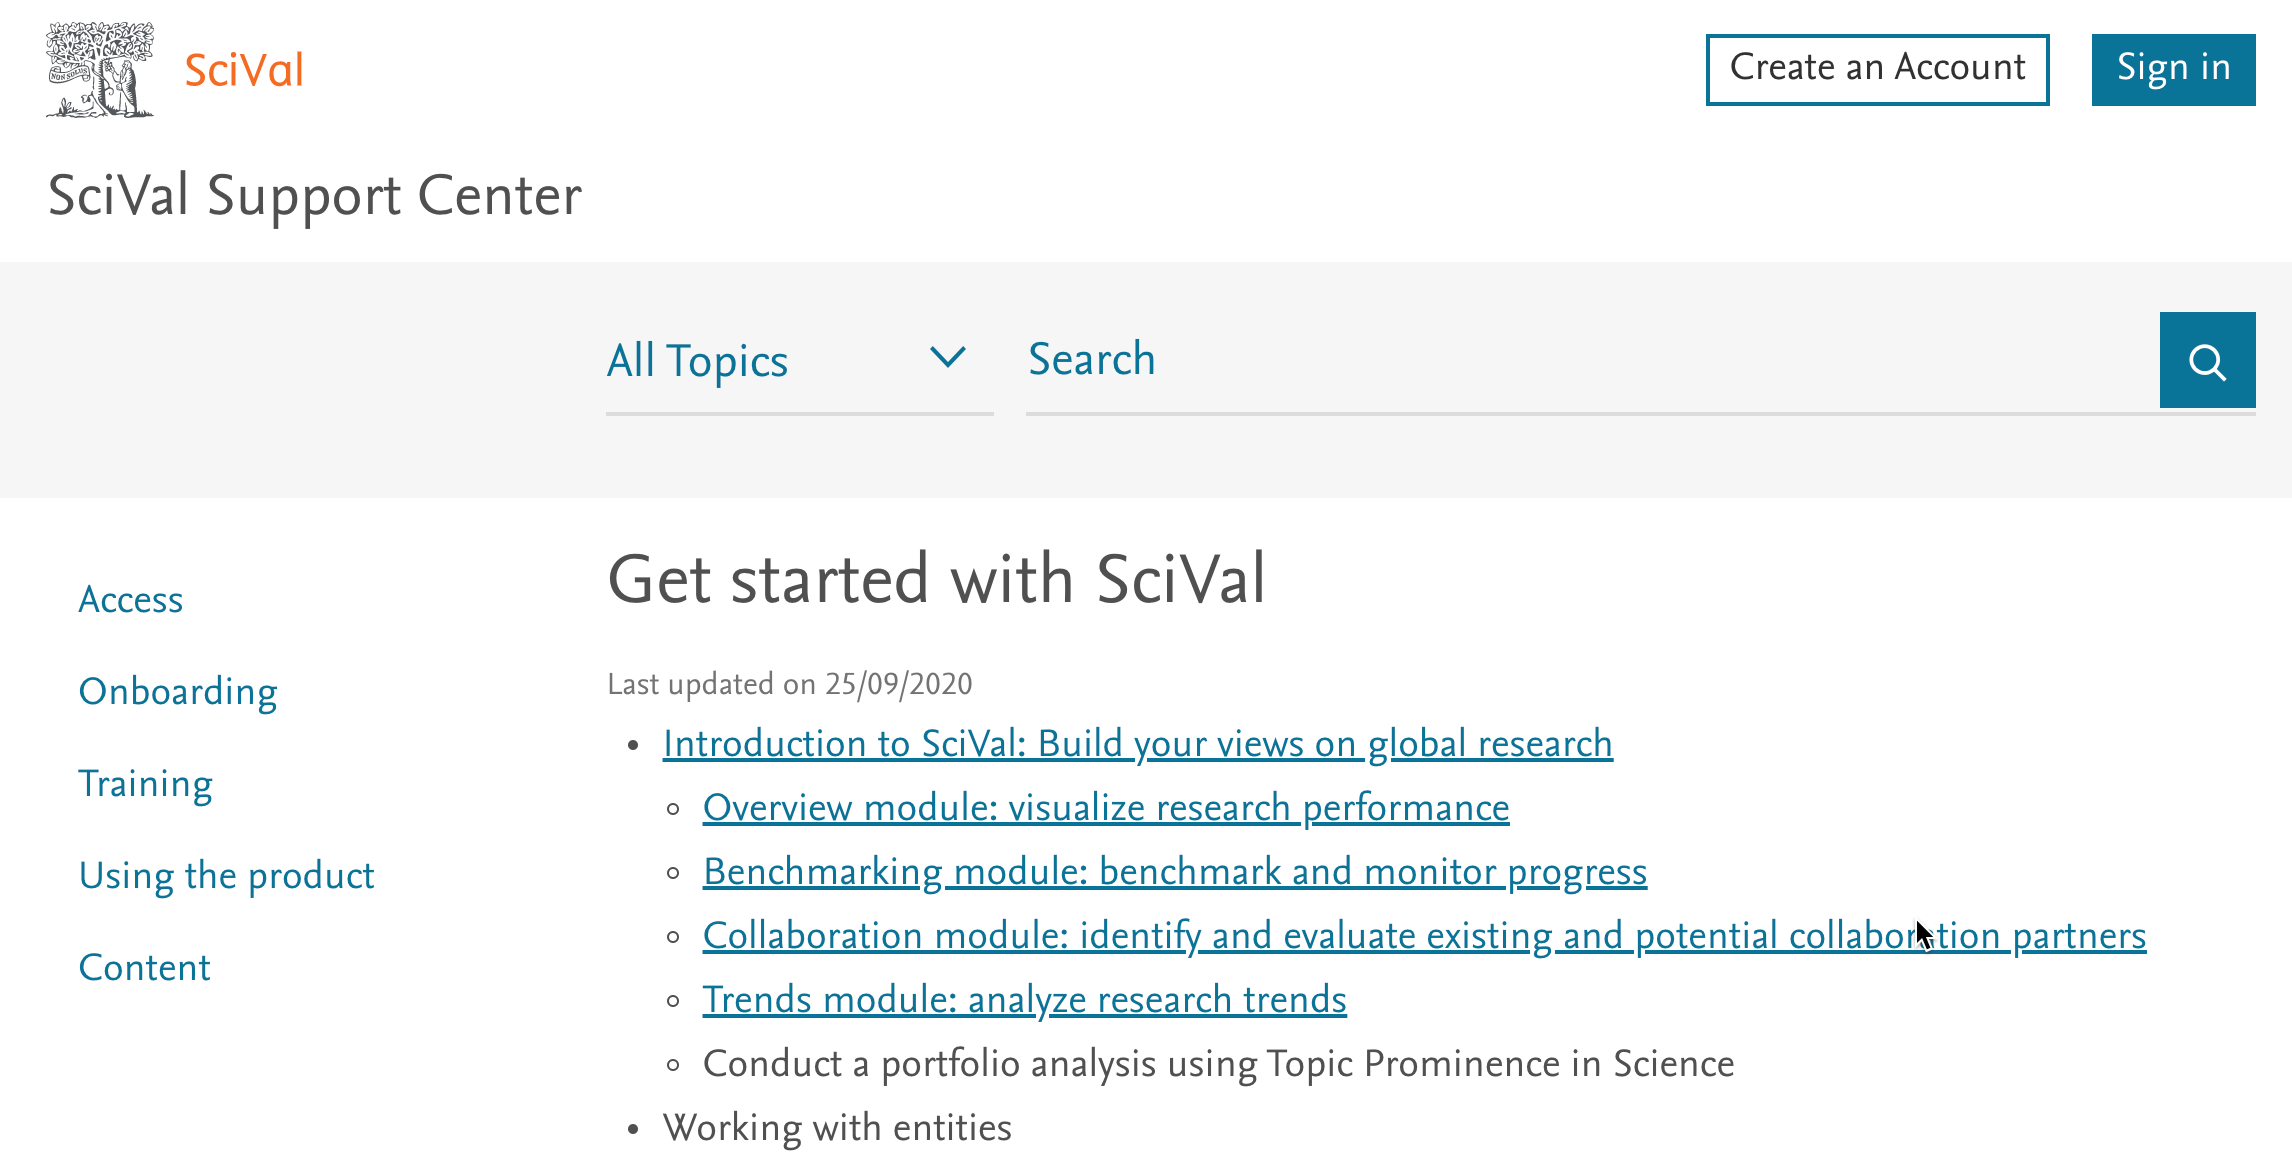
- Improved navigation in the Support Center
Following the SciVal Quick Reference Guide, it puts essential information at your fingertips. Simply click the SciVal Support Center link and learn something new.
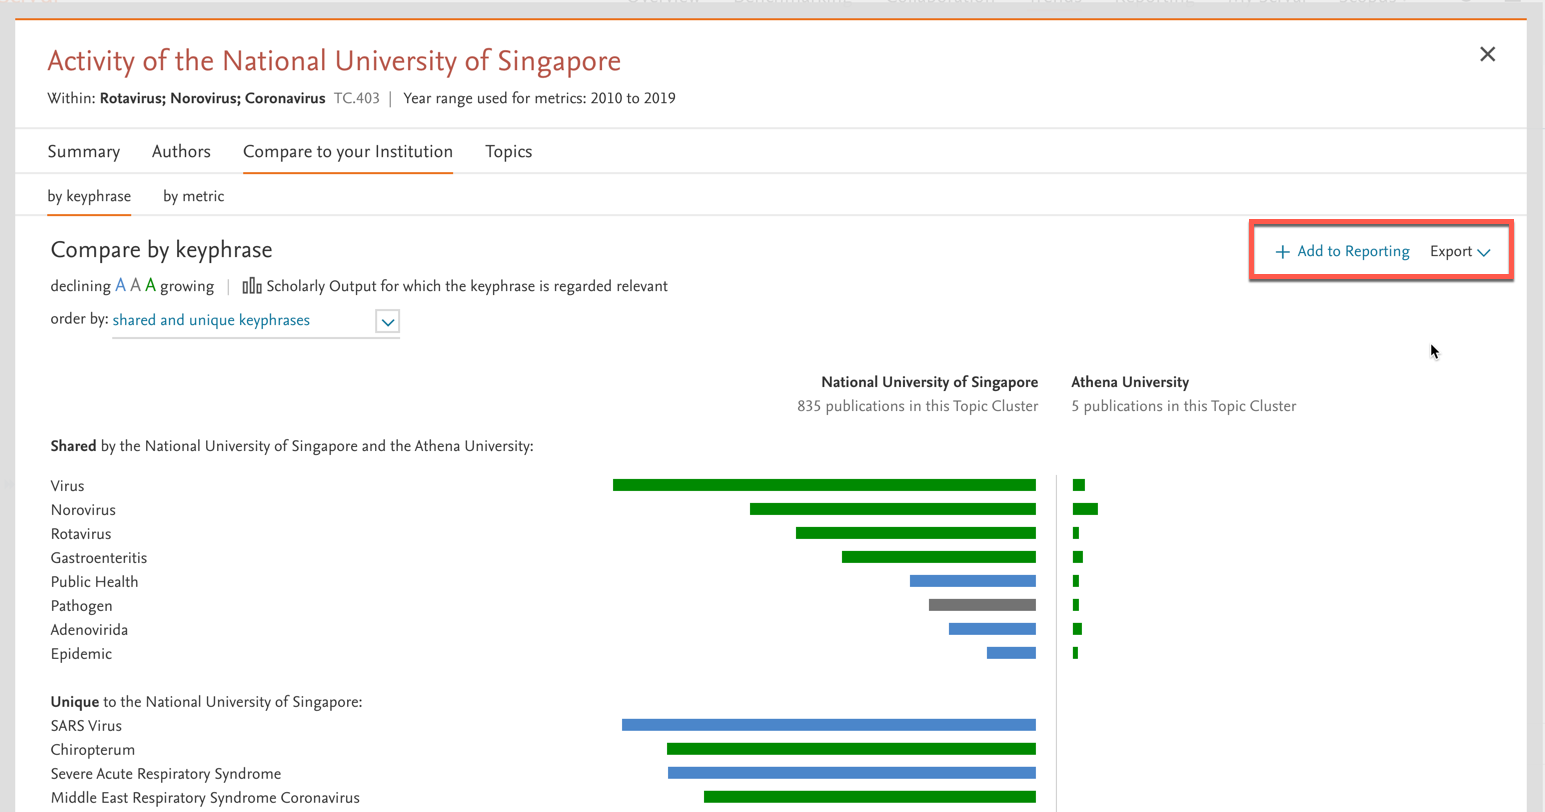
- Trends – add to reporting and export options available in more places
Add more depth to your reports and analyze more data with the new options
- Improved overview of Institutions in My SciVal
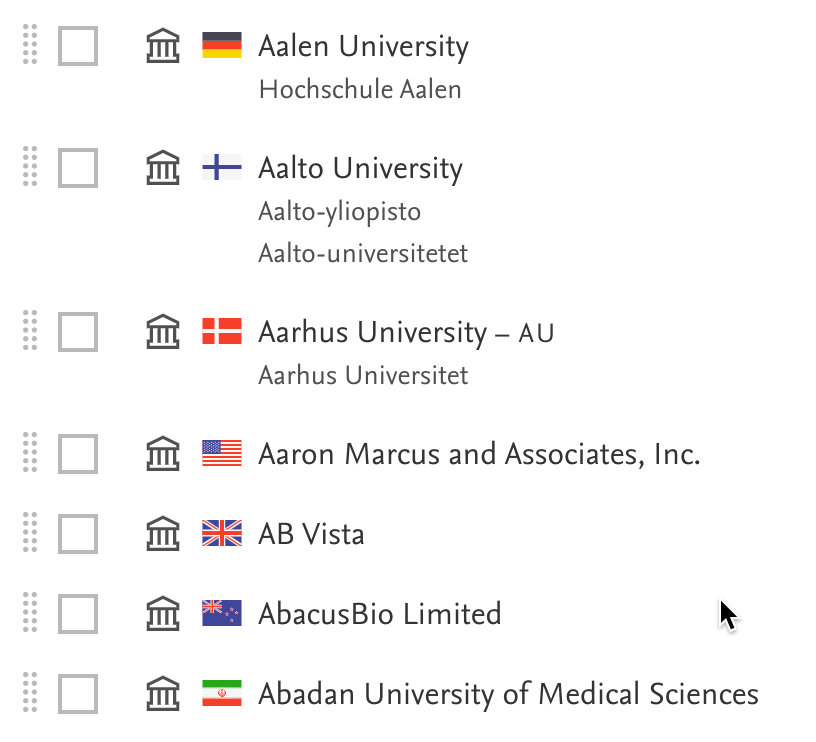
A new flag icon helps quickly identify the country linked to the list of institutions.
- Transfer ownership of a complete entity group, including children to another user
The new entity owner will have full edit rights over the group and any underlying children and can share with other users in your institution. You will still be able to edit the entity and it will be shared with you. - Update to the FWCI calculation
We noticed that a very small number of articles were receiving exceptionally large FWCI values. This was because they had received citations before the article was officially published, which was skewing their FWCI value. We've updated the FWCI calculation so that citations can only be counted in the time window from the publication year up to pub year +3 (previously it was any citations received from pub year + 3 and earlier). As a result you may notice some articles receive a lower FWCI, which is actually the correct value.
The September 22, 2020 release brings new authorship analyses, an improved homepage and additional metrics guidance:
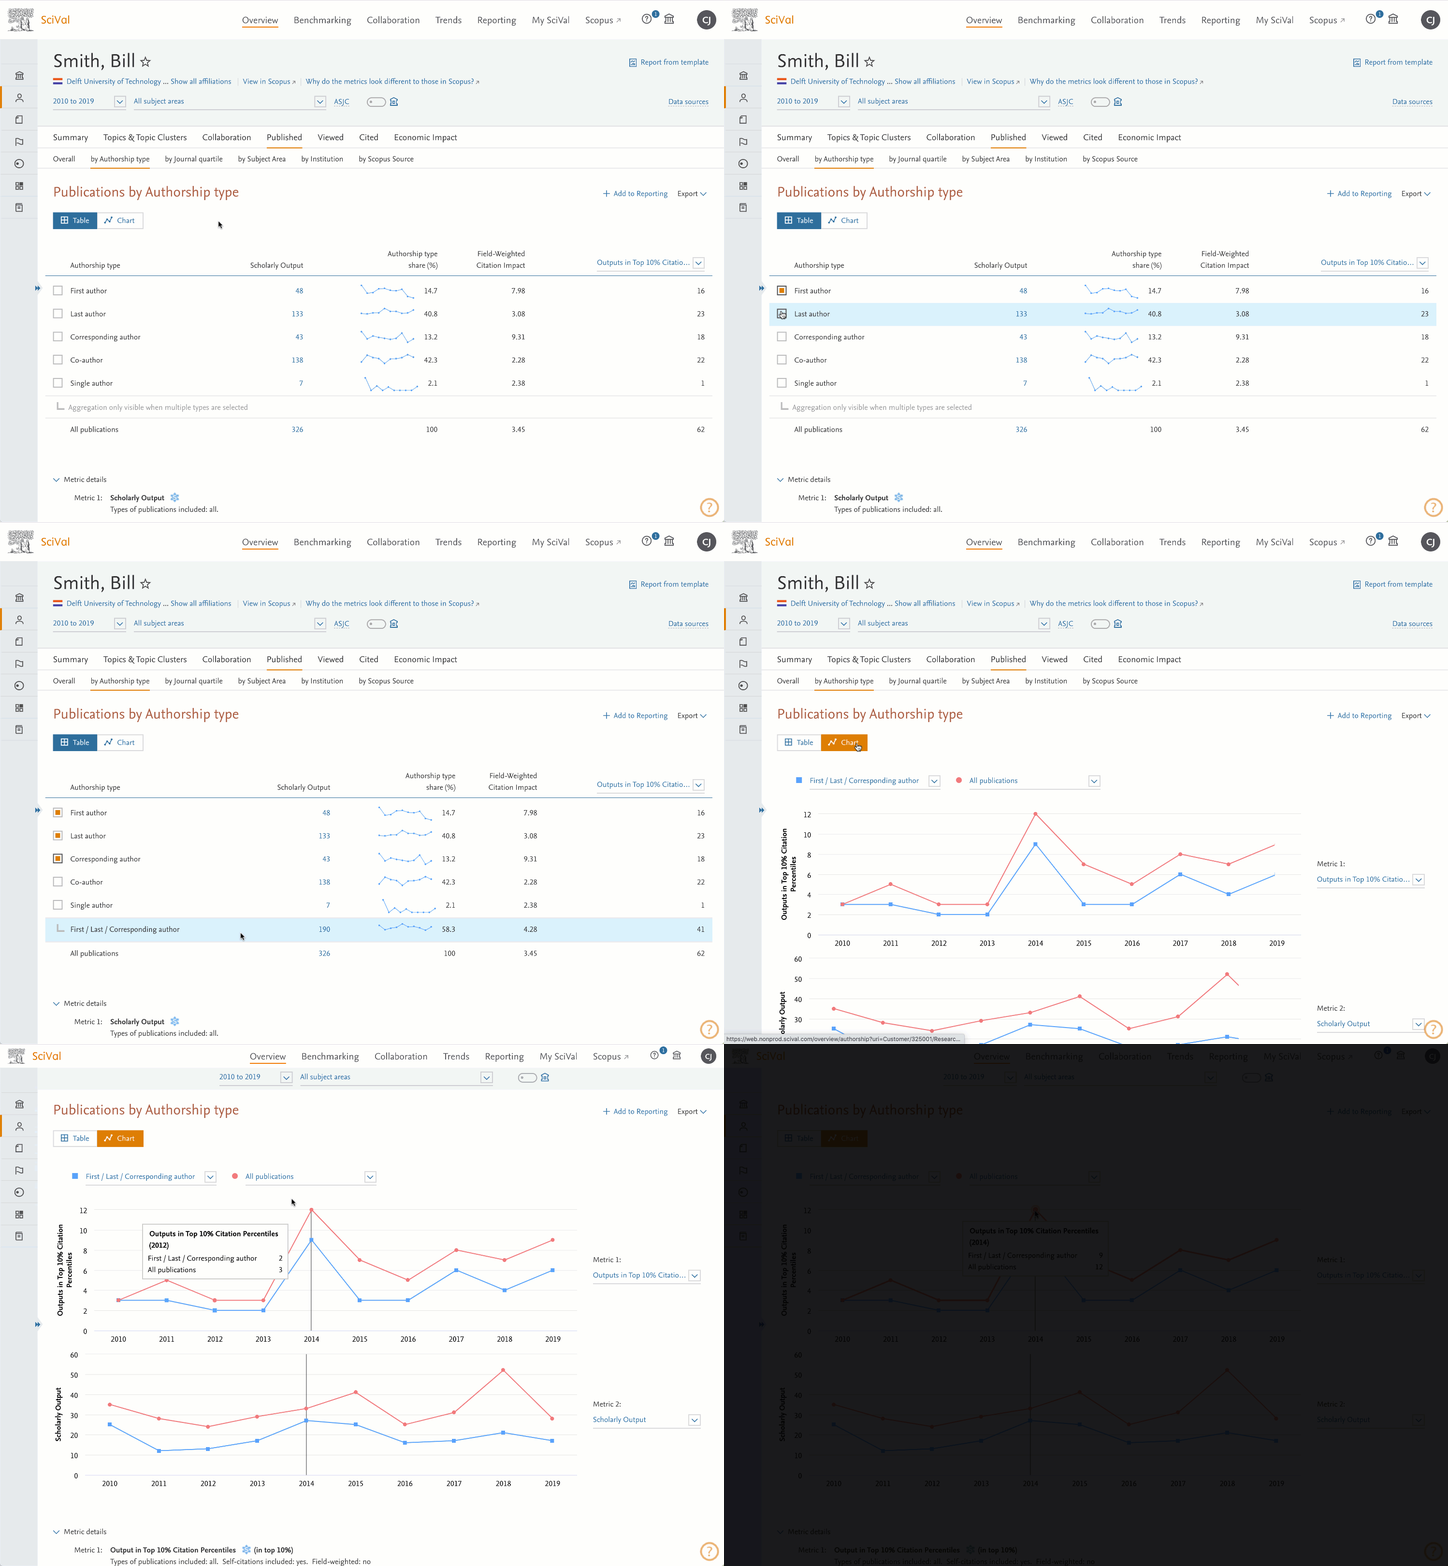
- Analyze authorship position as a proxy for a researcher’s contribution to their publications
See how often a researcher has been listed first, last, co-author, single and/or corresponding author or any combination of these options. This feature is available in 3 ways:- for Researchers in Overview > Published > by Authorship type
- for Researchers as an option in 5 metrics in Benchmarking (Scholarly Output, Citation Count, FWCI, Citations per Publication and Outputs in Top Citation Percentiles)
- for all entities as part of the spreadsheet download on any list of publications (the spreadsheet shows the Scopus author IDs)
Learn moreopens in new tab/window on the new authorship features.
- Improved homepage
We've listened to your feedback and enhanced the homepage to make the content more visible and have removed less used features such as the Twitter feed. Expect to see additional enhancements over the coming months!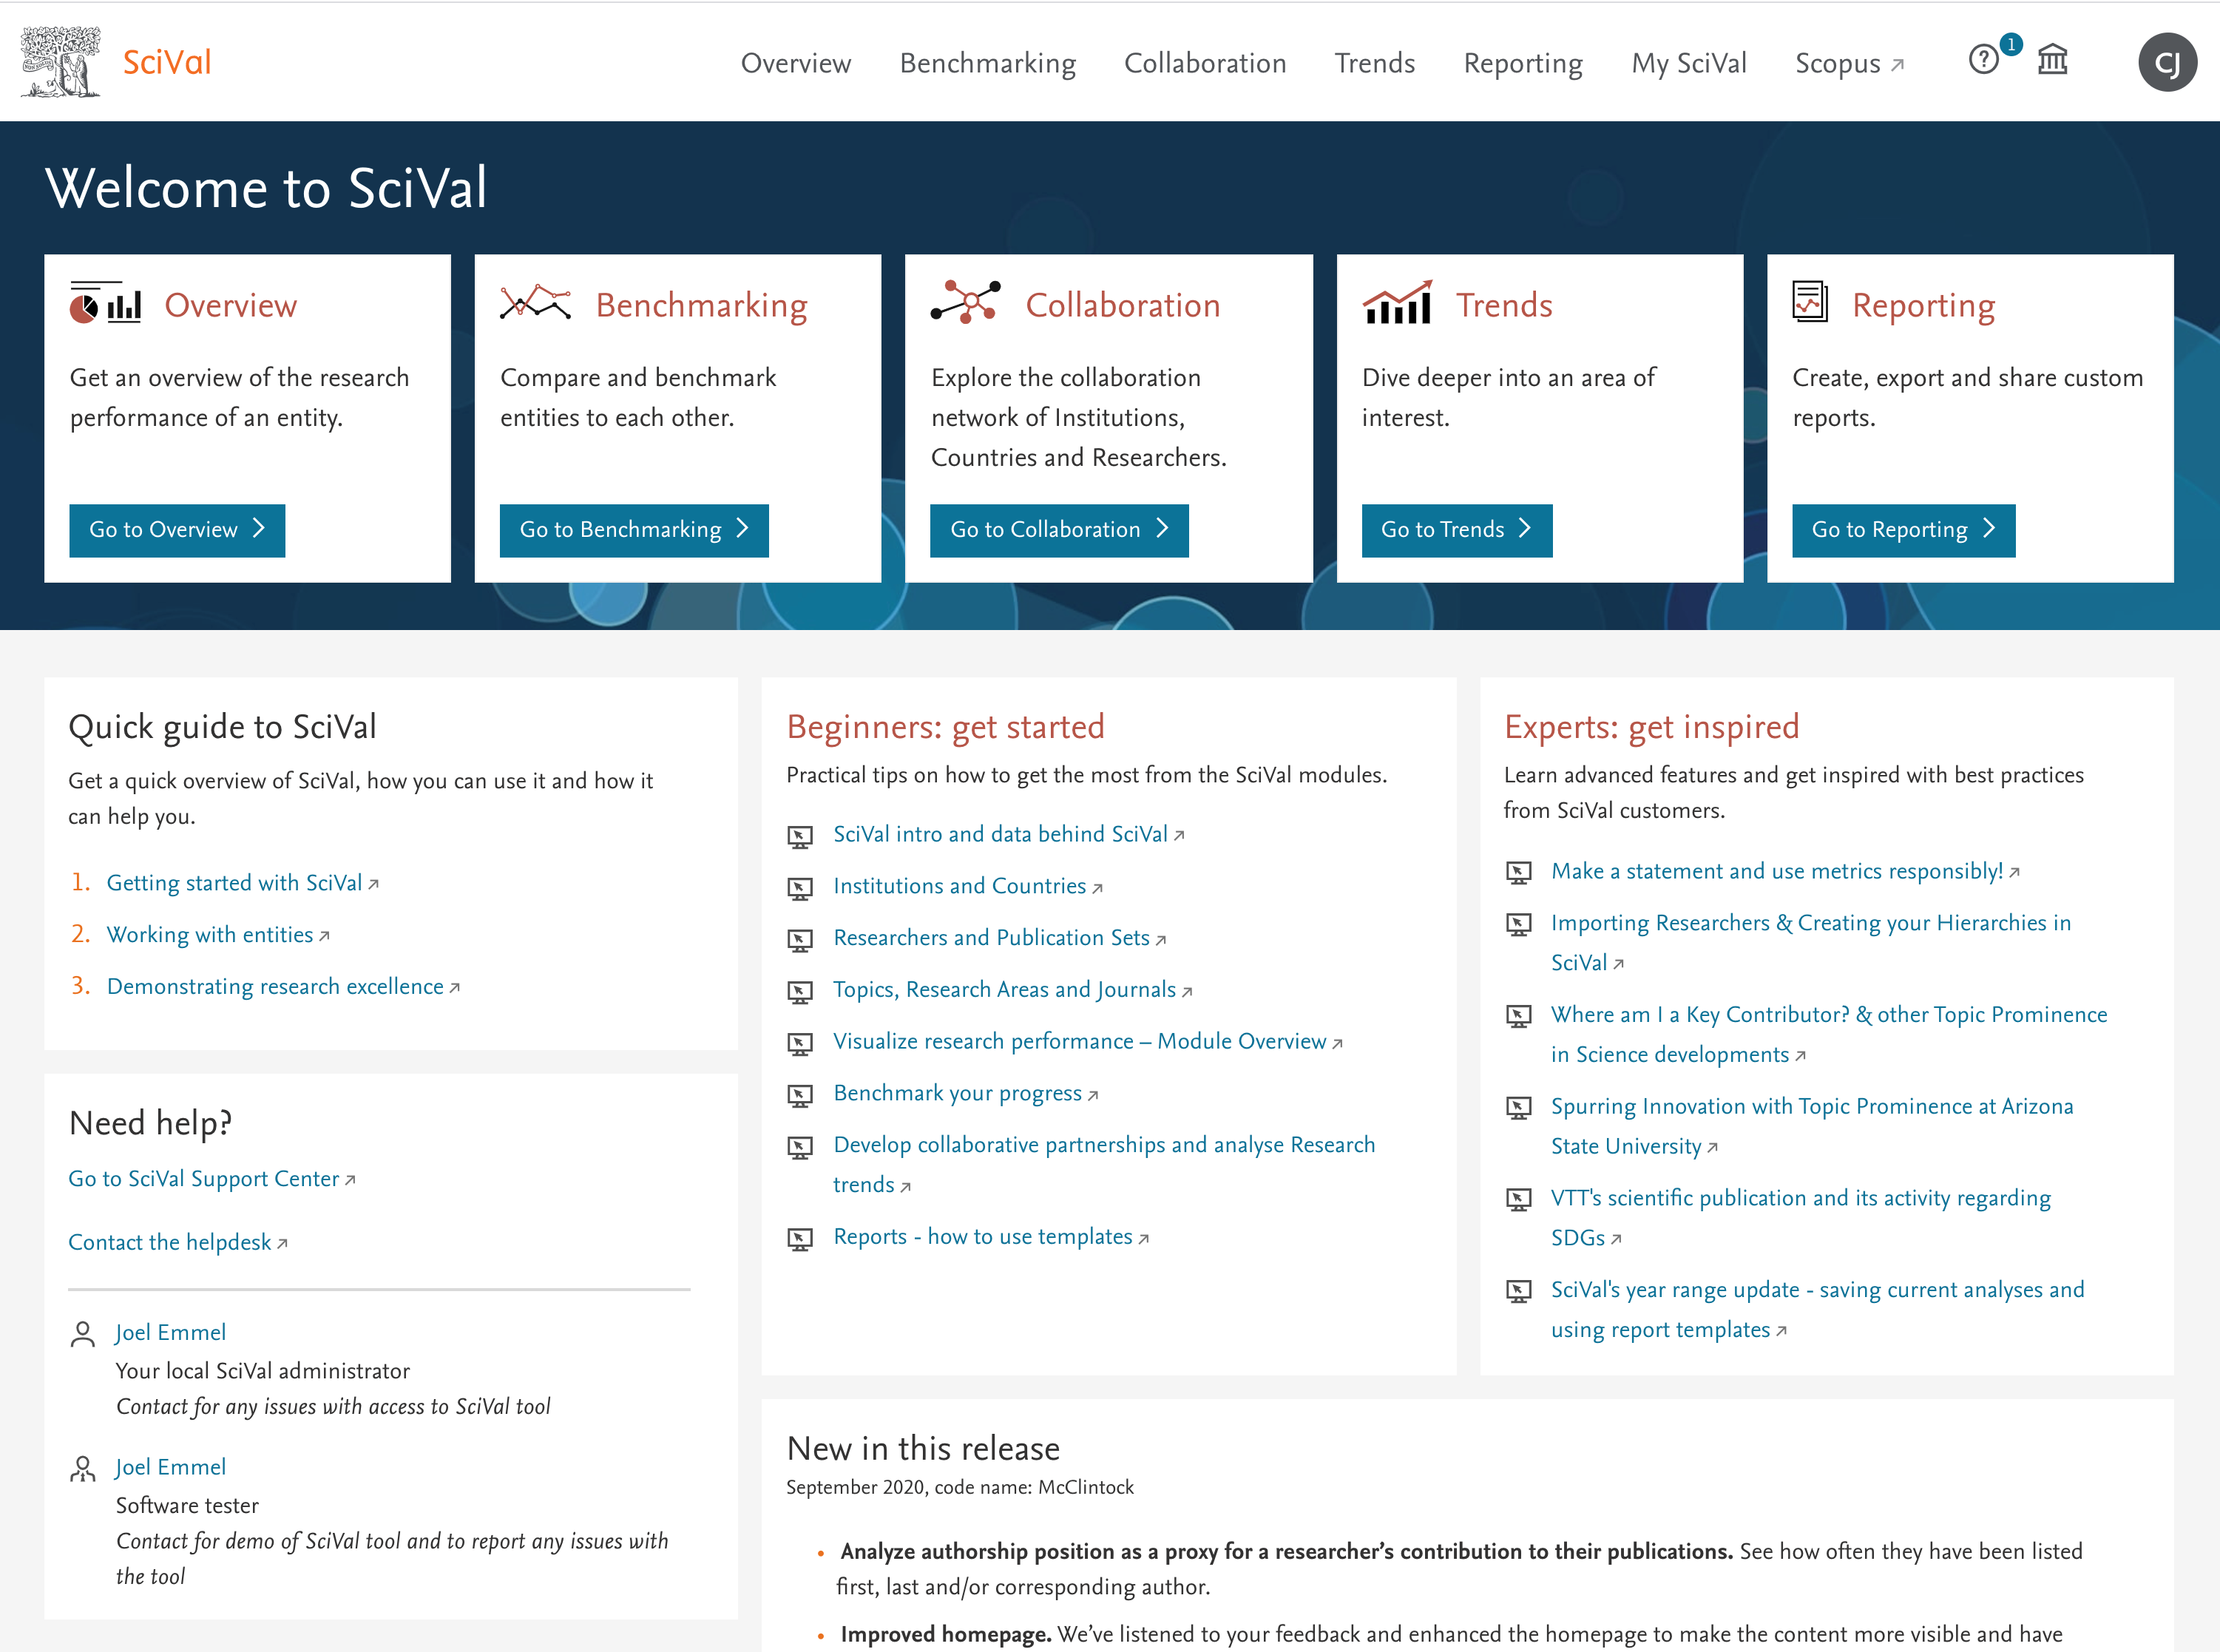
- More support for the responsible use of metrics.
More contextual metric help is now available throughout the Overview module, along with links to additional information.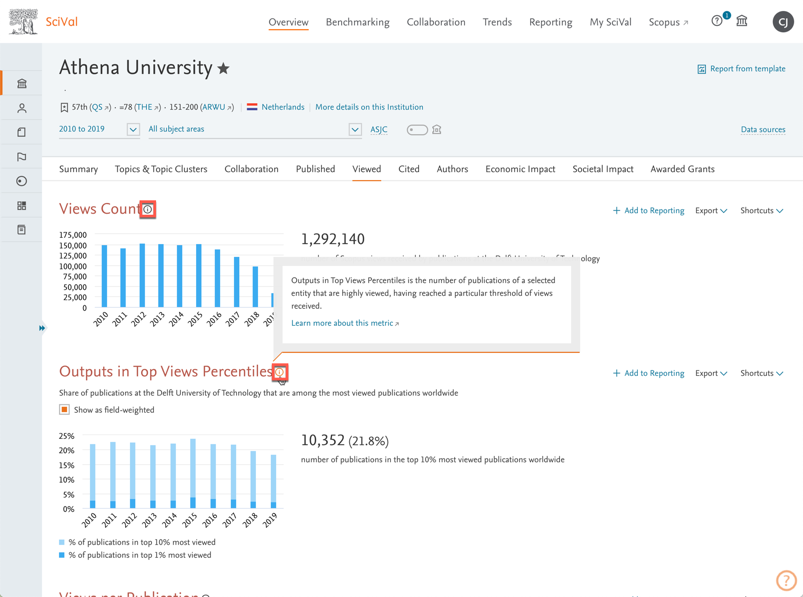
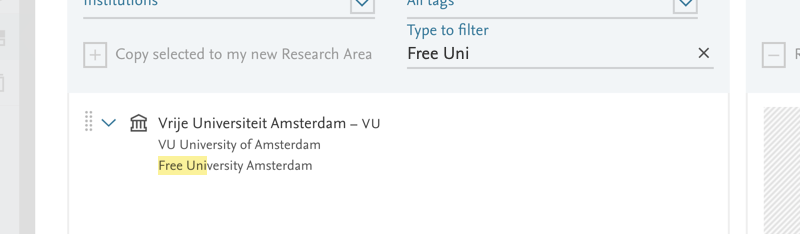
- Quickly build Research Areas from Scopus Affiliation IDs in the Institution modal
Generate institutional analyses quicker by creating Research Areas directly when looking at the list of Scopus Affiliation IDs of a SciVal Institution. Or use institutional acronyms and abbreviations when using an Institution to define a Research Area.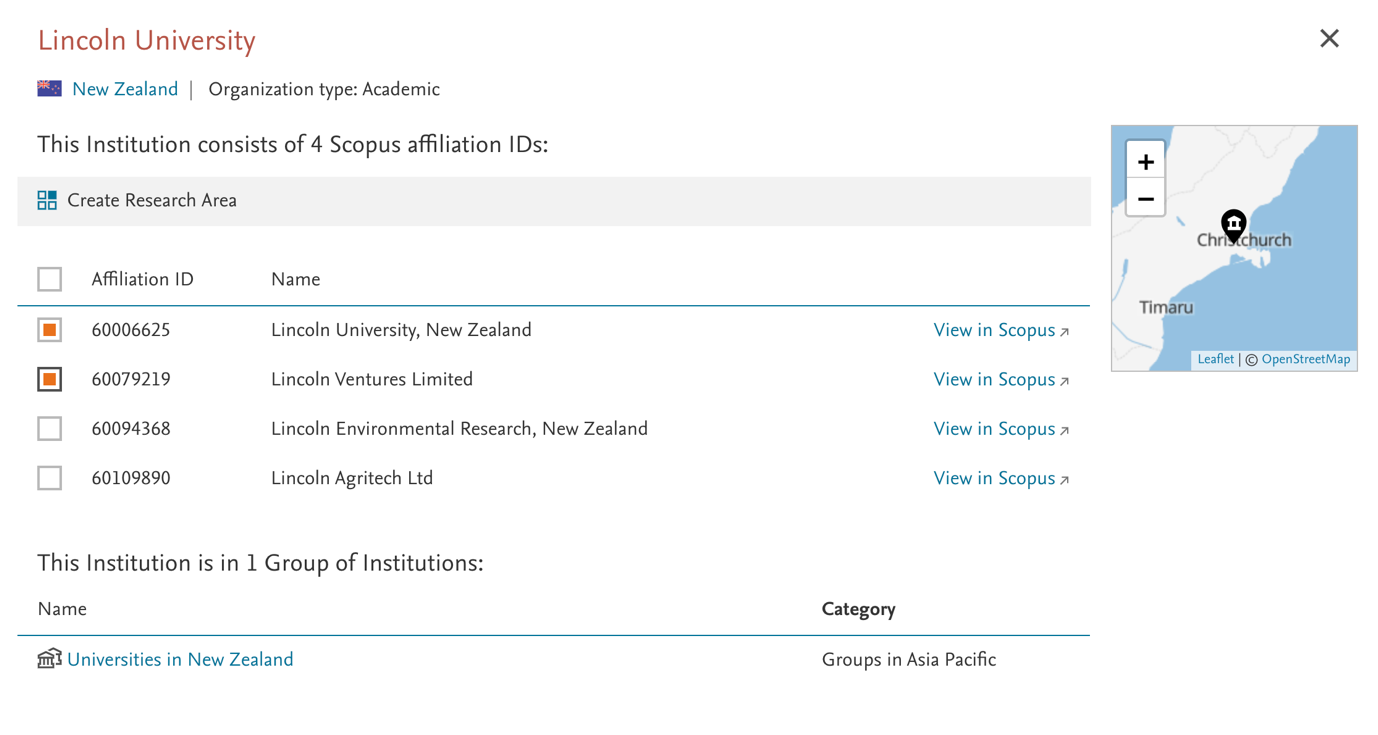
- Add Topic and Topic Cluster Table and Wheel views to Reporting in Trends.
Enhance reports with Topics and Topic Cluster Table and Wheel views in Trends.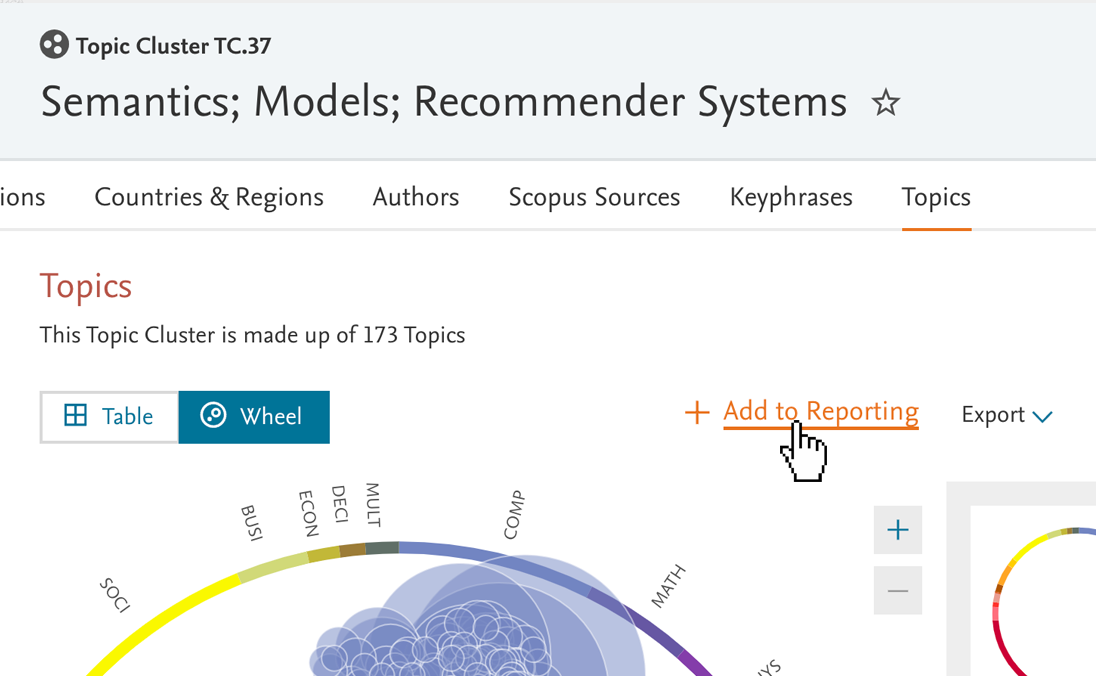
- SDG data update
The SDG Research Areas have been updated with publications mapped to each SDG up to the end of August 2020.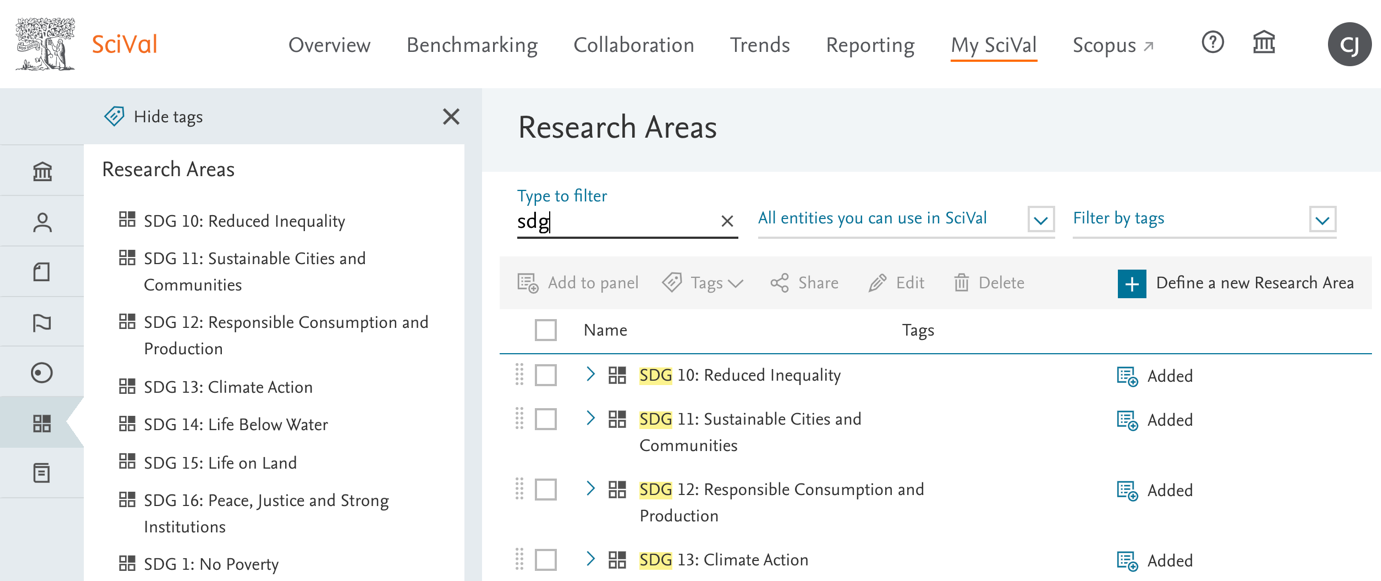
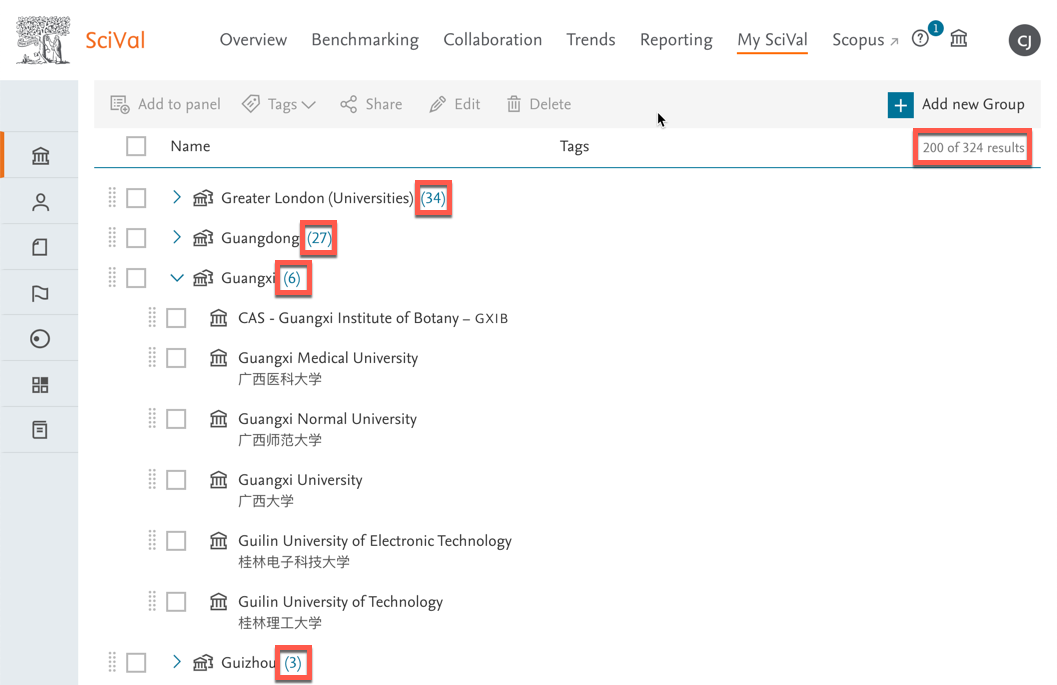
- See the number of search results and content of hierarchies
- Search for a subject area
Locate a subject area of interest with a text search in the subject area dropdown menu.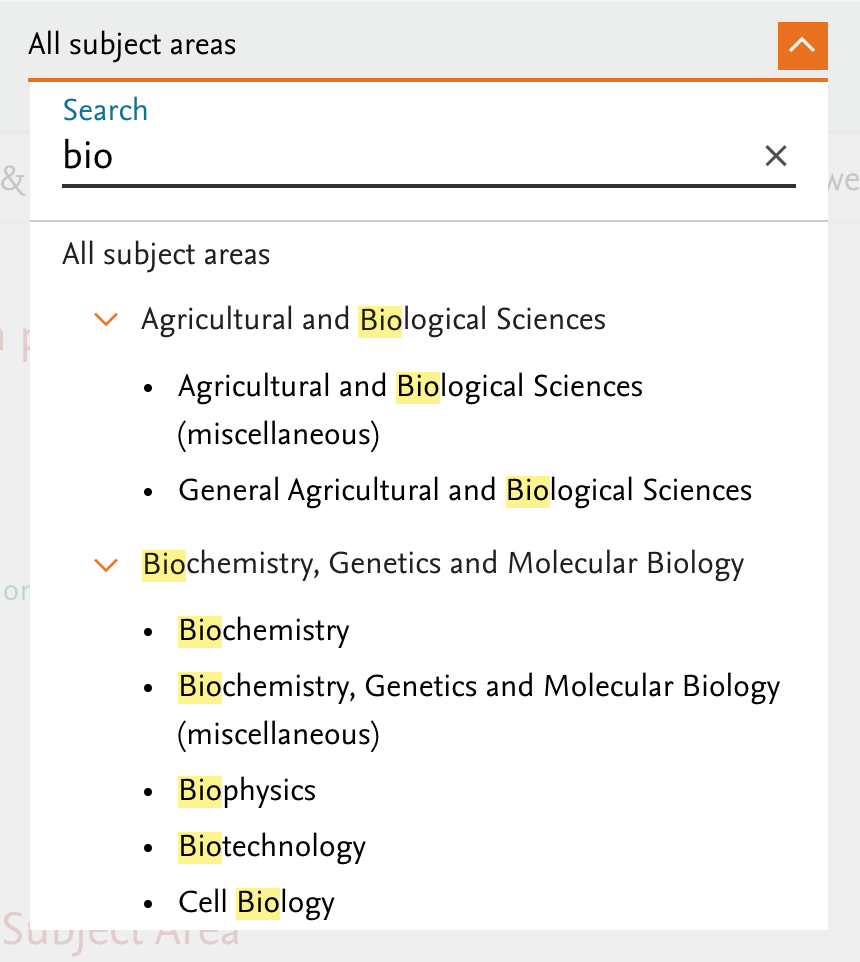
- Updates to the Institutional QS, THE, ARWU and Chinese Ruanke rankings
The latest rankings data can now be seen in the Overview module for relevant Institutions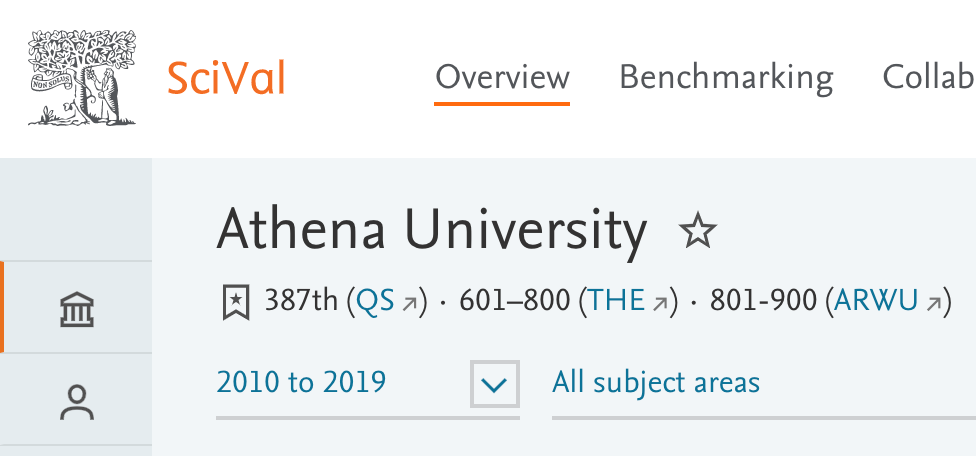
- SciVal API update
Get Topic and Topic Cluster metrics for a country
The August 11, 2020 release brings quick ways to create Research Areas and Institution Groups, along with a sector breakdown for Country Groups:
- Easily create a Research Area from Scopus Sources in Trends
When looking at a Topic, Research Area or Publication Set, quickly create a Research Area from the Scopus Sources of interest for further analysis. Simply select the items of interest from the Scopus Sources tab in Trends and convert them into a Research Area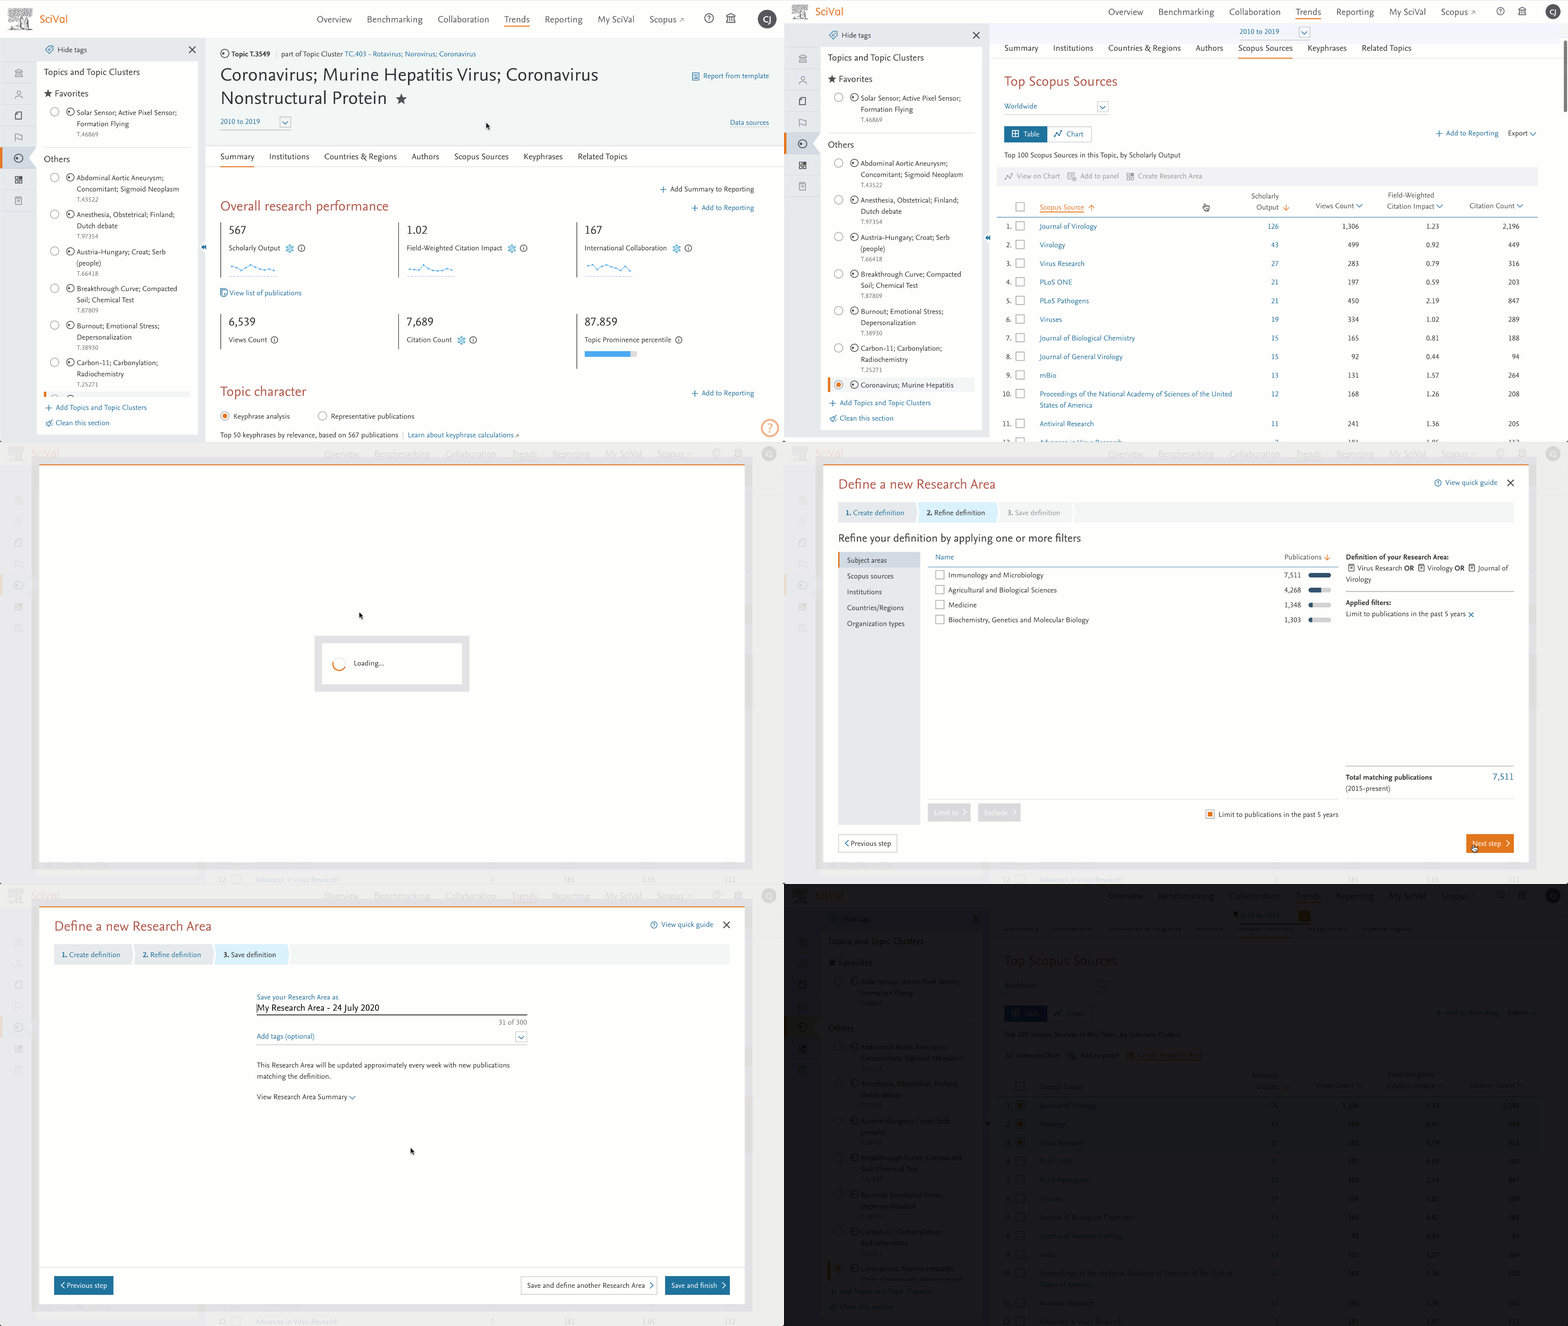
- See the sector breakdown for Country Groups in Overview
Use this to identify different institution types and their research impact. Go to Overview – Institutions and click the drop down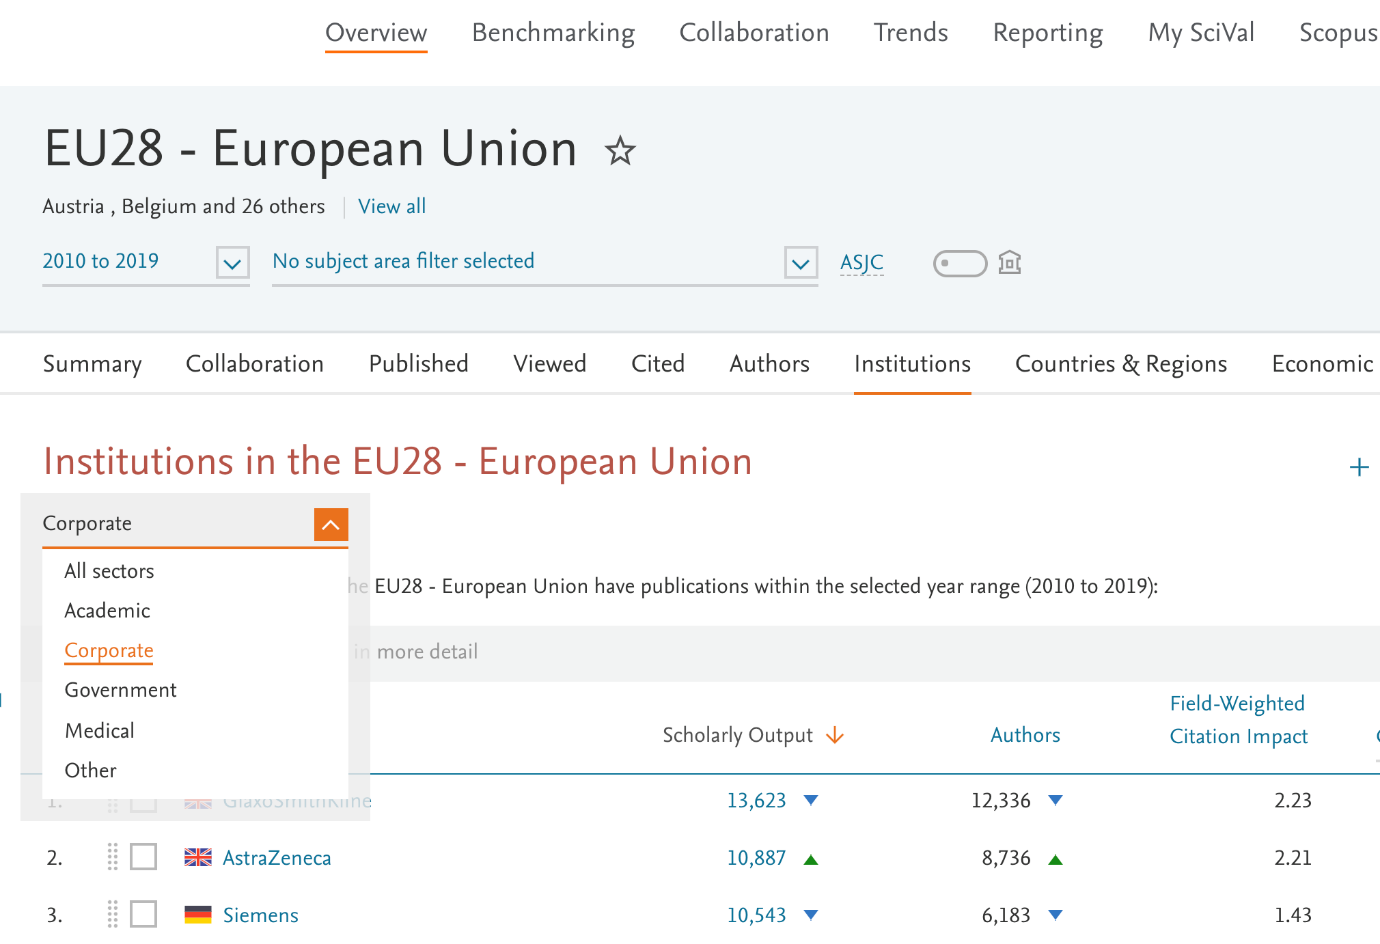
- Quickly create an Institution Group from a list of Institution IDs
Use the new group to analyze the research performance compared to other groups, or as a reference line to benchmark the institutions within the group against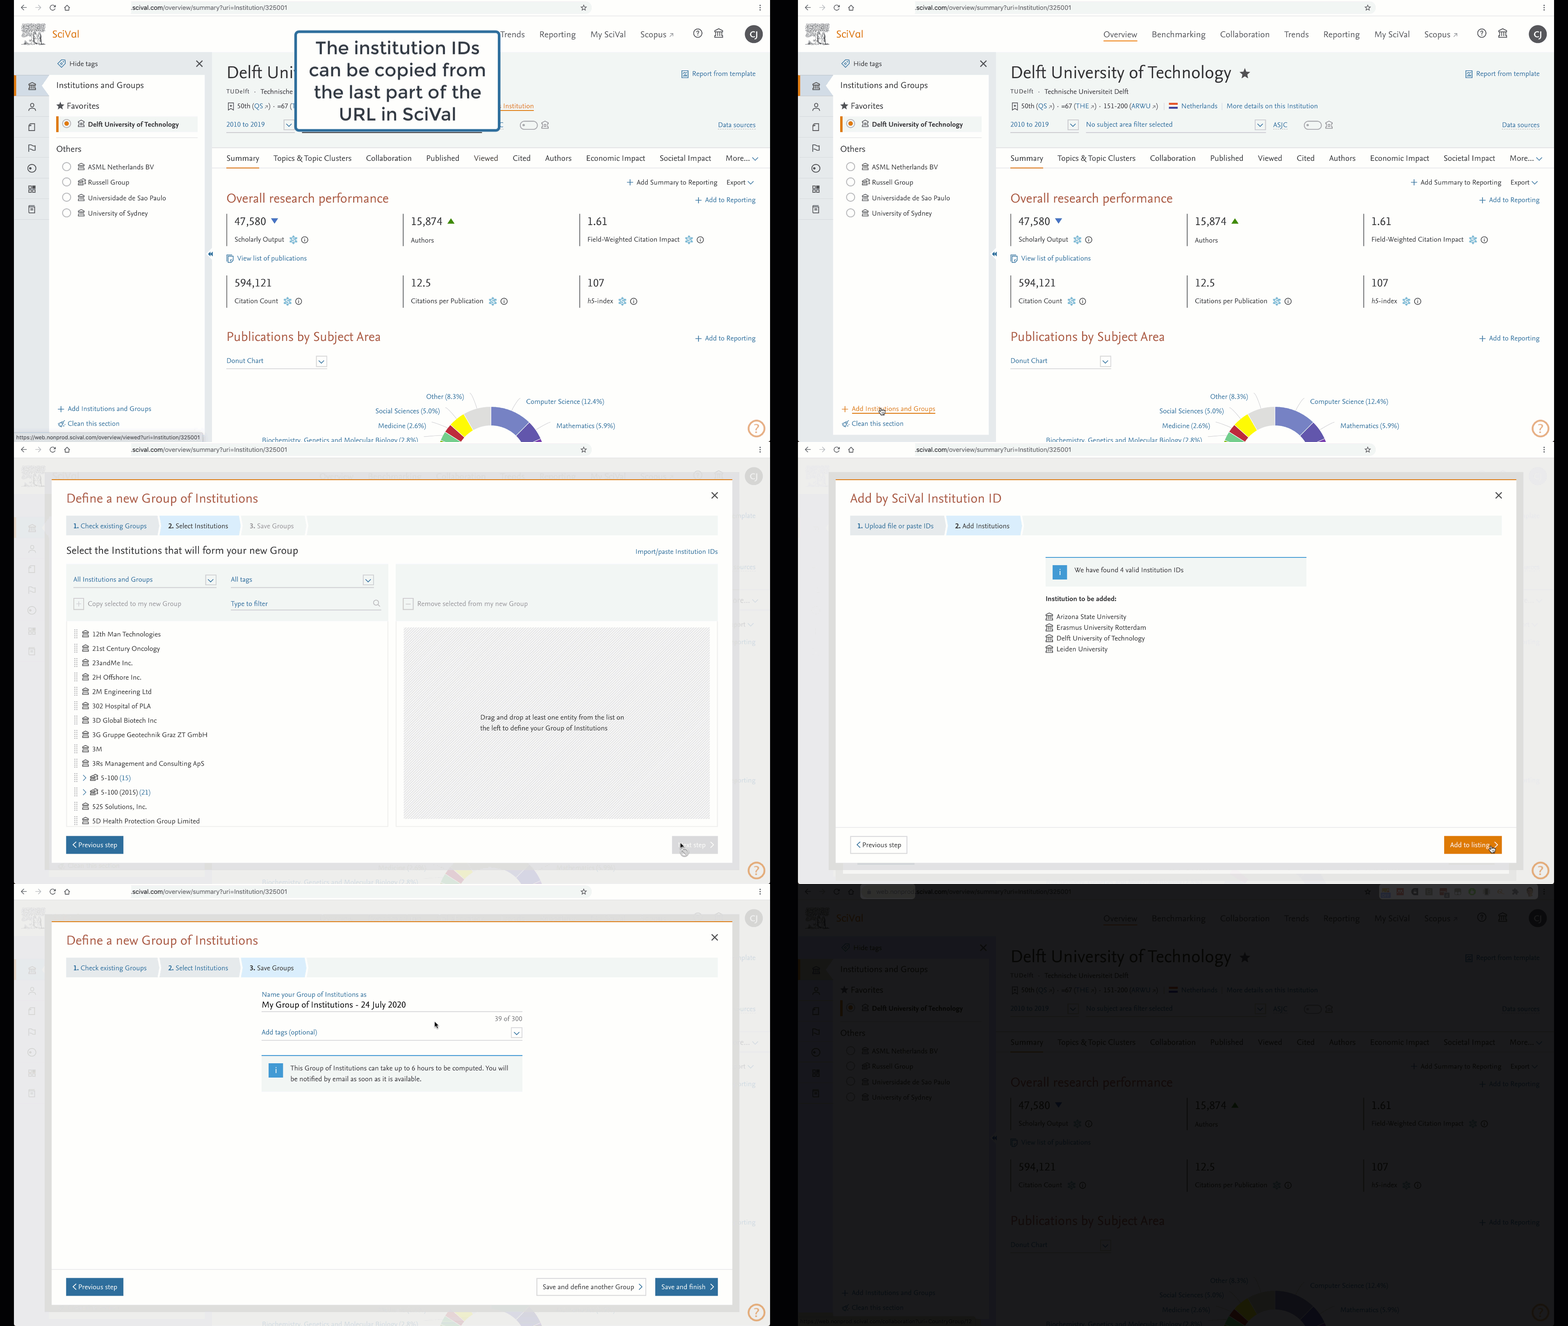
- Review your group sizes faster in My SciVal
The bracketed number at the end of each group shows how many entities are in the next layer to provide a quick size overview.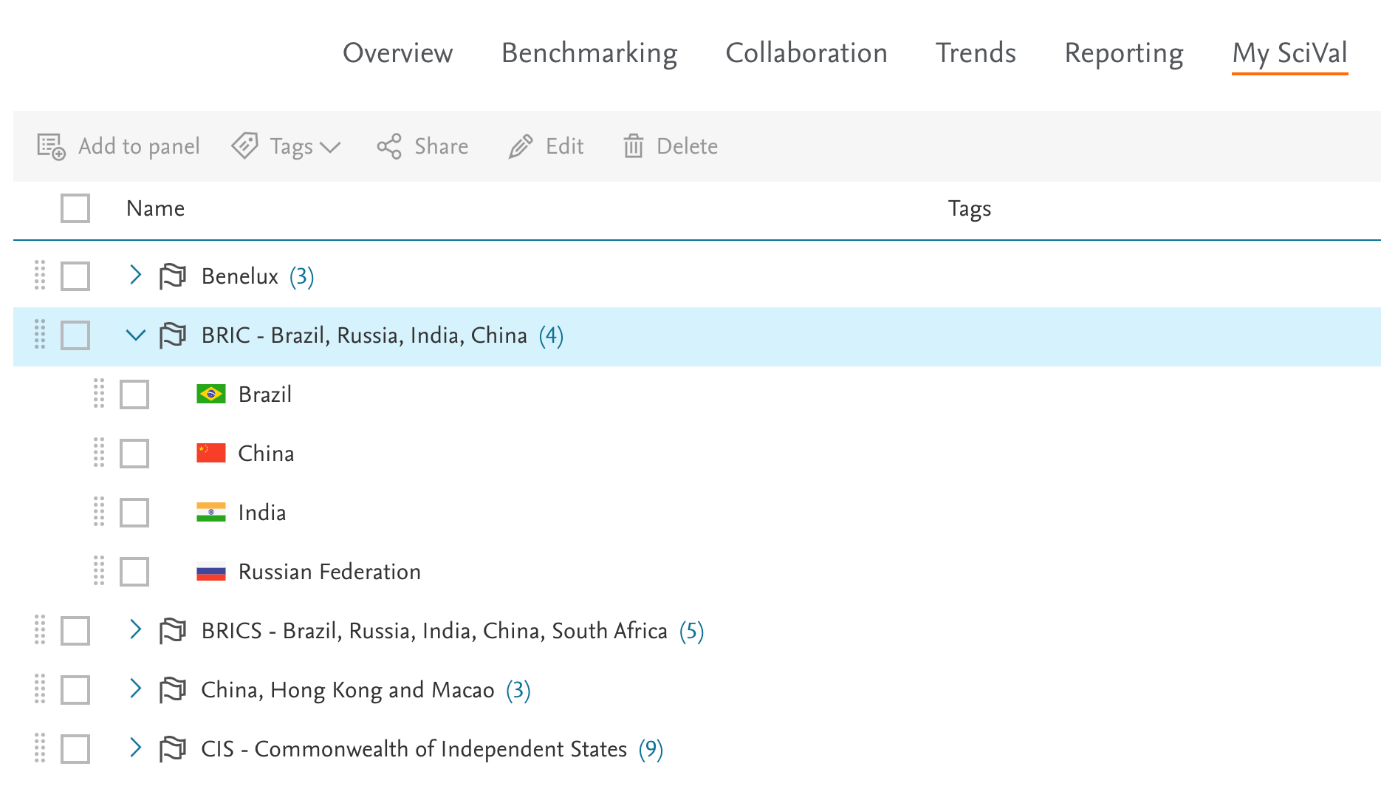
- Get journal metric percentiles with a publication export
When exporting publications from SciVal, you can now get the CiteScore, SNIP or SJR percentile values for each article’s journal or source, which can be used to compare across subject disciplines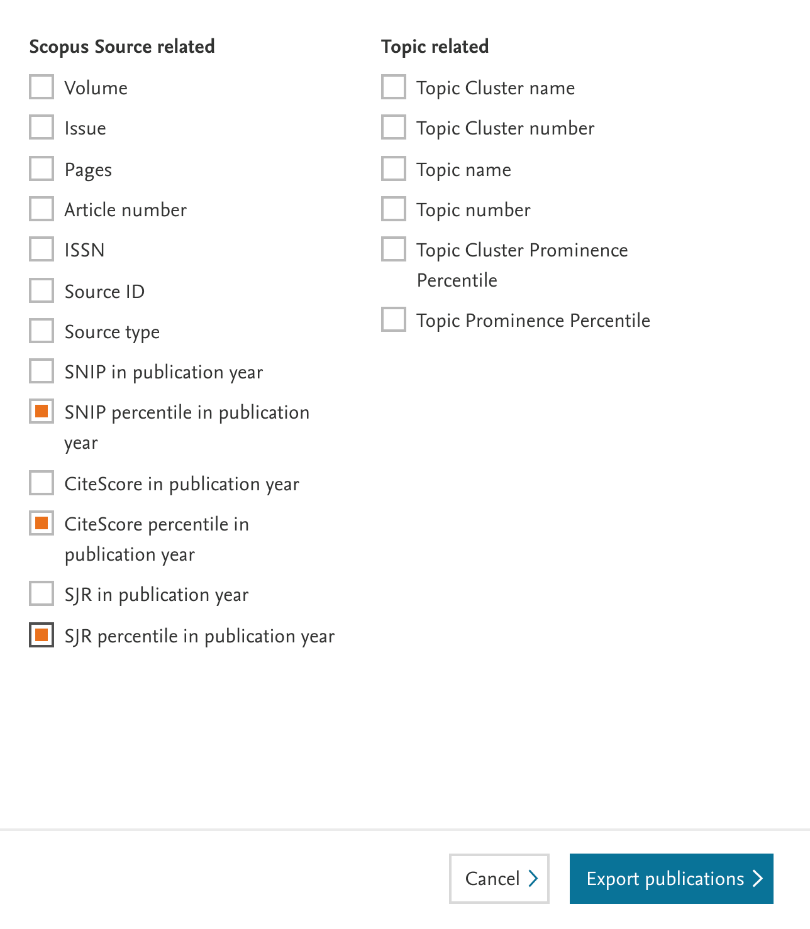
- Get an instant report for any Scopus Source
Choose from an Overview or Benchmarking report to get a set of balanced metrics with which to analyse the performance of a Scopus Source.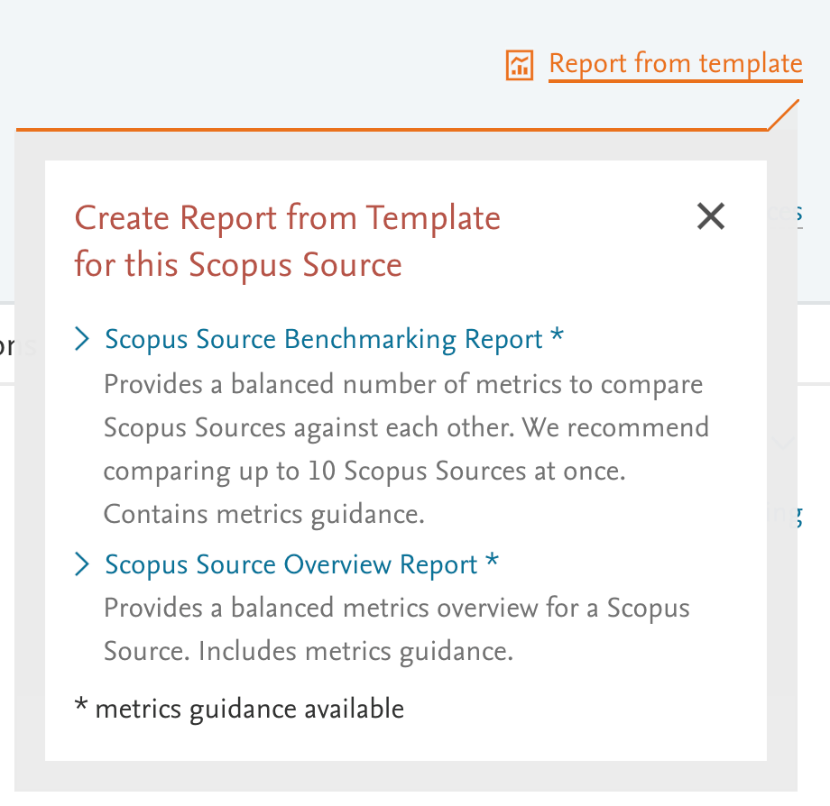
- Additional release items
- Admins can create and share tags with institutionally shared Researcher and Researcher Groups
- Select all option available per entity type in the Benchmarking entity panel
- Use “shift” and click to select multiple rows in one go on the tables in Overview and Trends
- WAYFless URL is available to support additional authentication methods
- The bubble chart for Related Topics can be added to Reporting
- Improved resolution of images exported from Benchmarking
The June 23, 2020 release brings updates to Topics as part of our yearly rollover, new visualizations and an improved thesaurus:
- Yearly rollover and Topics update
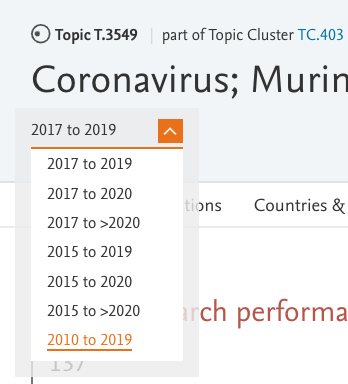
Each year in June, the Scopus content for the previous year (i.e. 2019) is over 95% complete. This is the point we consider it a “complete year” and we then move our pre-defined time ranges in the Overview, Collaboration and Trends modules, forward by one year. The new ranges and other Topic updates have been used to make a number of changes to the Topics and Topic Clusters as below:- recalculate the Prominence Percentiles for all Topics and Topic Clusters using the new CiteScore metrics
- rename all Topics using the most relevant keyphrases based on a new updated thesaurus
- recalculate related Topics
- recalculate the ASJCs linked to each Topic (used in the filters and to plot the Topic on the Wheel of Science)
- reallocate papers published between 2010 – 2017 from their current Topic to a more dominant Topic where applicable
- a new icon for Topics and Topic Clusters (to help differentiate with the Research Area icon).
Learn more about the yearly rollover.
- View the connections between a Topic and its related Topics via a new Bubble Chart
The new visualization helps expand your understanding of a Topic by highlighting the top 10 most related Topics, along with the Topic Clusters to which they belong.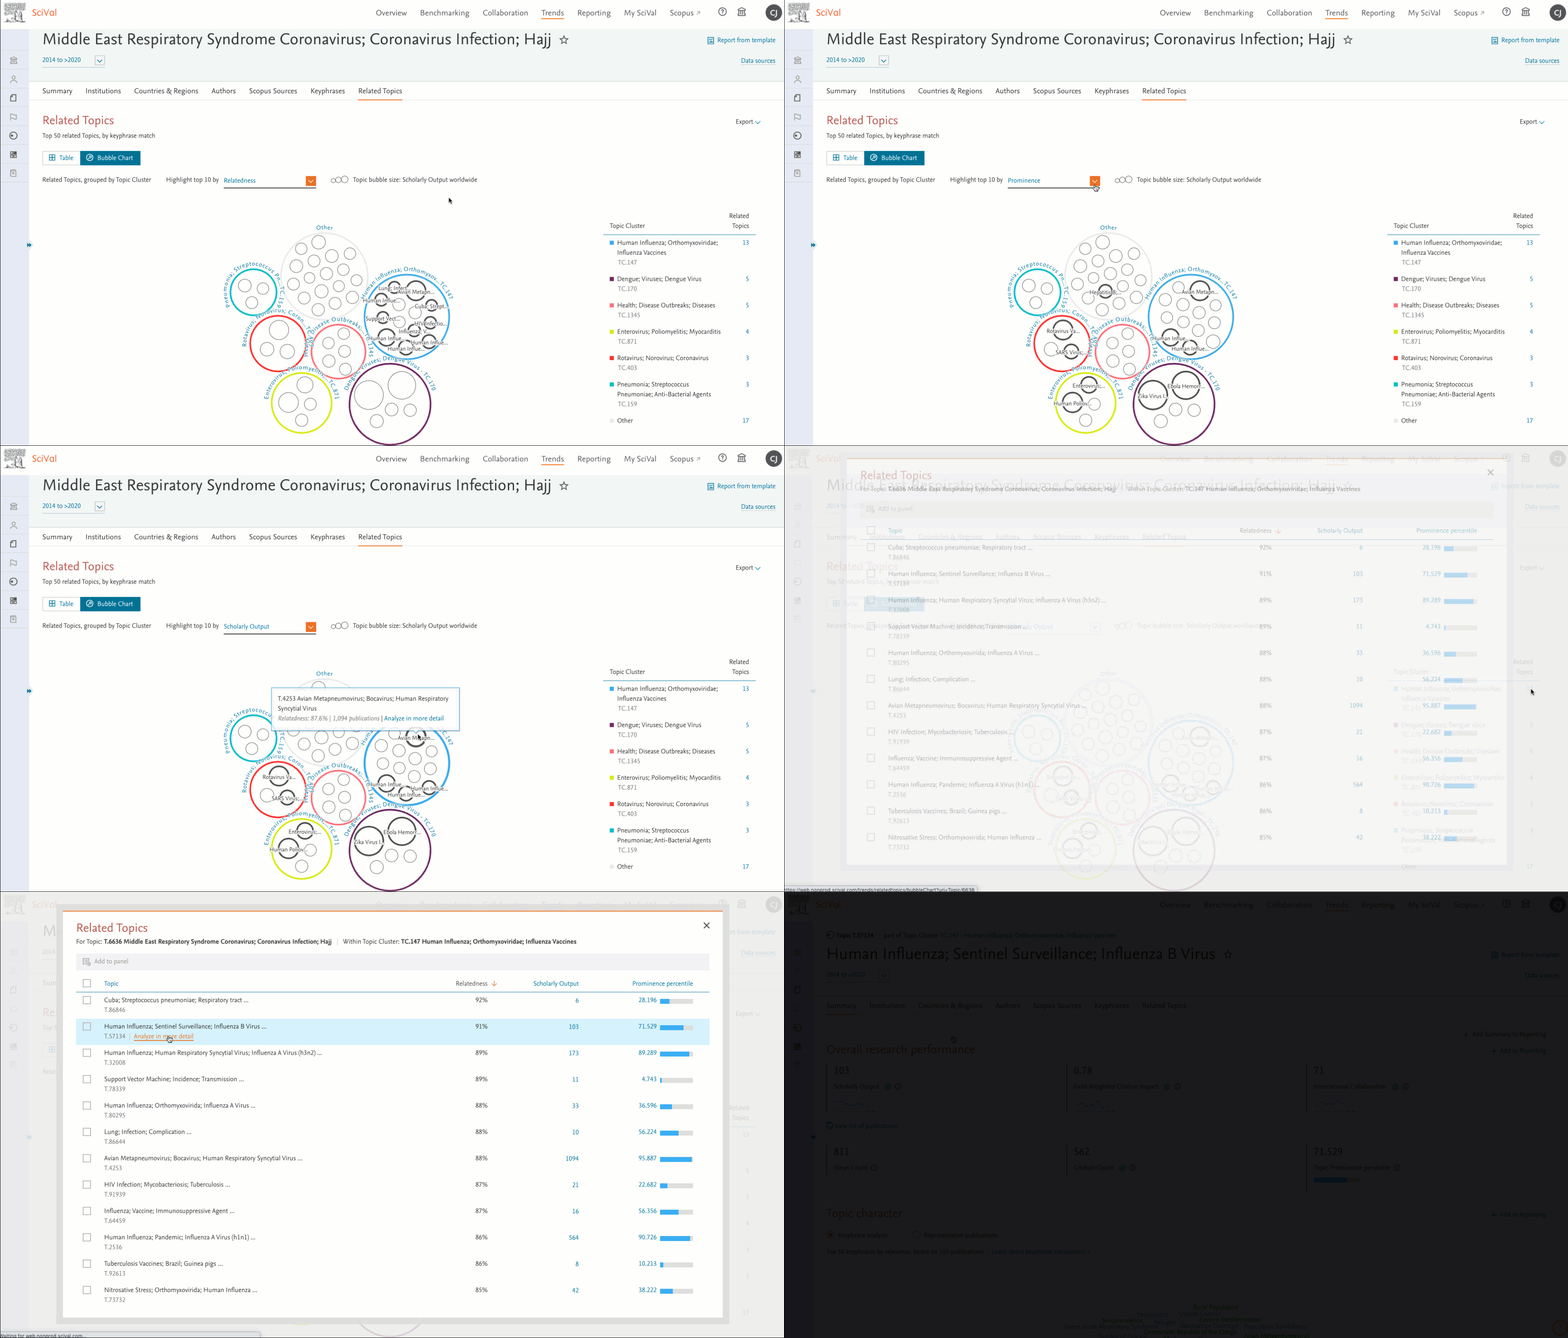
- Add your own benchmark reference lines for any entity
Get a clear visual aid on how entities compare to each other, with horizontal and vertical reference lines in Benchmarking. For example, you can compare individual EU countries against the averages of the full EU group. Find the option in the entity key to the right side of the chart.
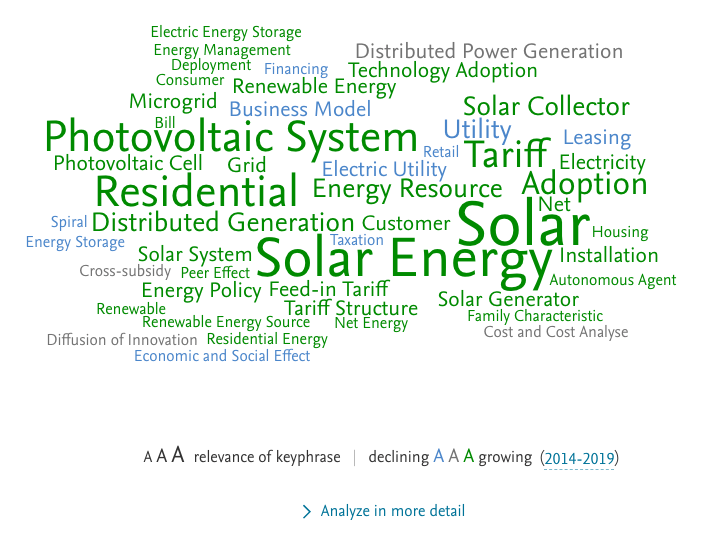
- New improved thesaurus for keyphrase analyses
We have replaced the multiple subject area thesauri with a single unified thesaurus, which has improved the keywords displayed in SciVal. The thesaurus has removed singular/plural combinations and gives a better grouping of related terms to provide an improved depiction of the area at which you’re looking.
- 3 new visualizations available for Country Groups
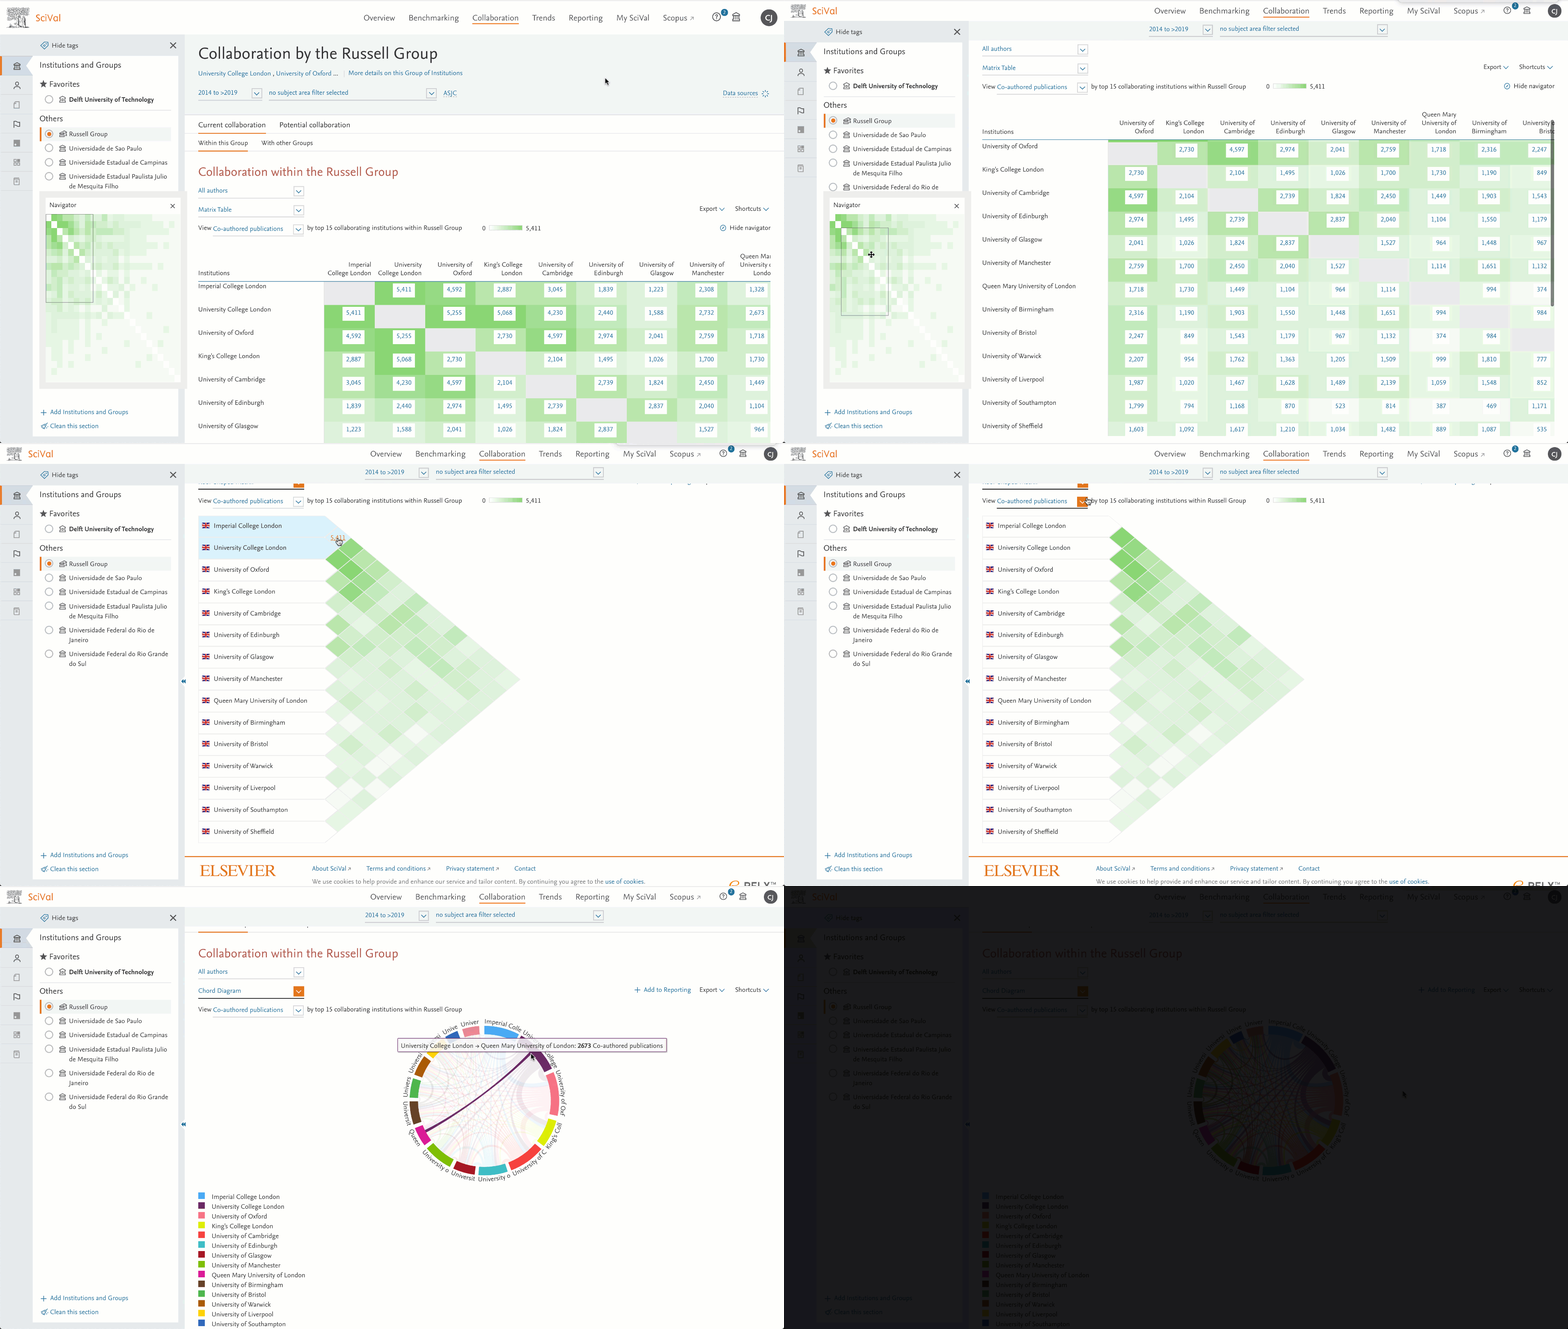
In the Johnson release we added 3 visualizations to view current collaboration impact (by co-authored publications) within an Institution Group and we’ve now expanded this for Country Groups! The Matrix Table, Roof-Shaped Matrix and Chord Diagram are now also available to help visualize which collaborations in a Country Group have the most impact via 8 available metrics.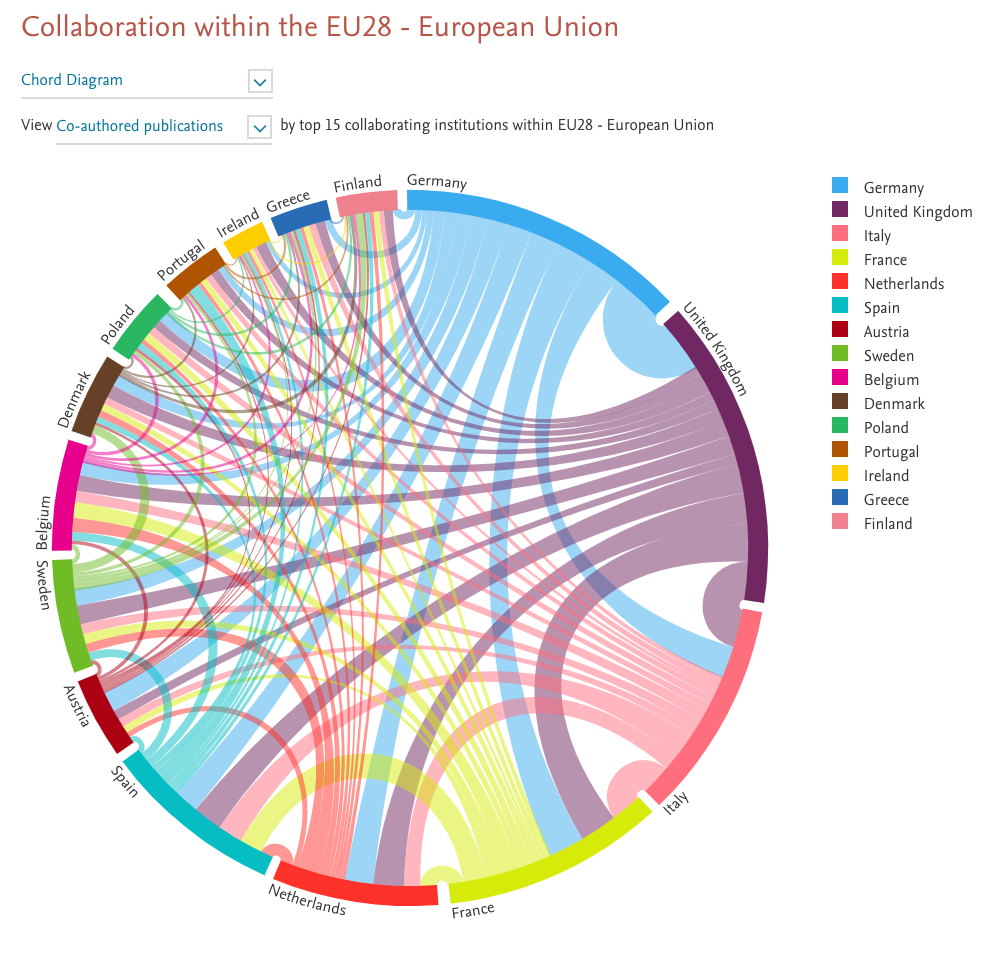
- Quickly edit entities and the date range in a report
Change the entity and / or date range for all analyses in a report in one go, instead of one at a time, via 2 new dropdowns. This option is available for reports that contain a single entity type.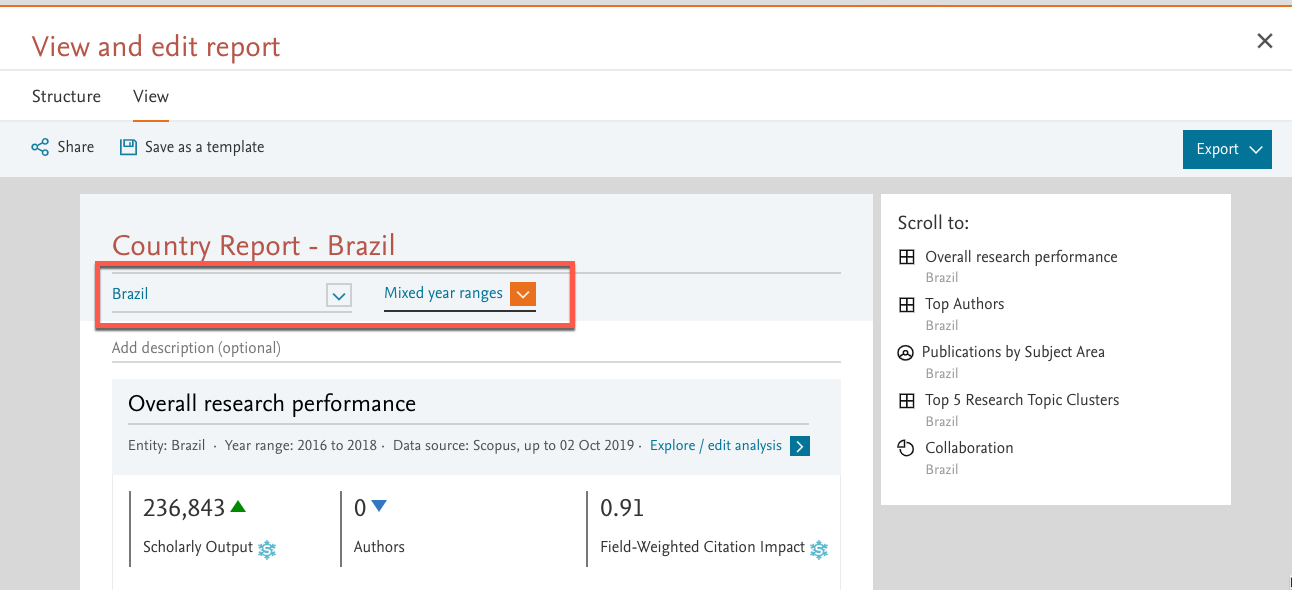
- Updated SJR percentile values
We have fully aligned with Scimago and use the exact SJR percentile values that are available on the Scimago Journal Ranking website (previously we had calculated them ourselves). - Quickly add Scopus Sources to the entity selection panel
Select and add Scopus Sources to the entity panel from a list in Overview or Trends and have them instantly available for further analysis.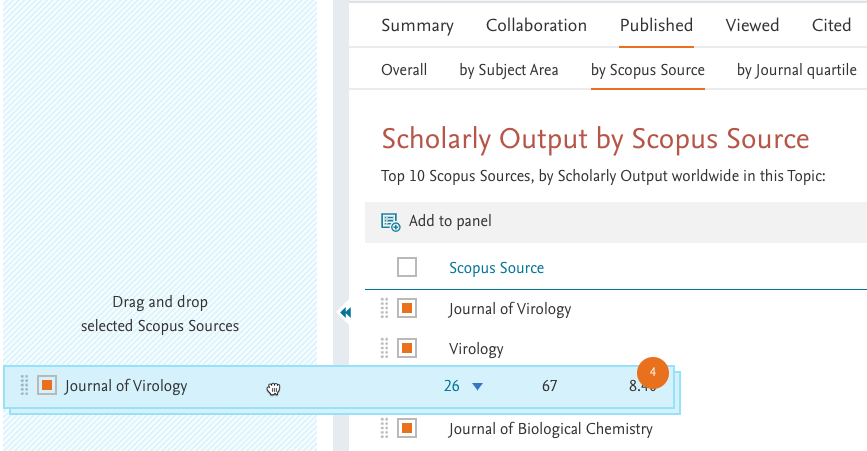
- Added a field-weighted option to the Outputs in Top Citation Percentiles (Overview Summary page)
We’ve listened to your feedback and have added the option to turn on the field-weighted option for the Outputs in Top Citation Percentiles metric in the Overview Summary page. This field normalized metric allows the entity to be compared against other entities that are focused on different subject areas.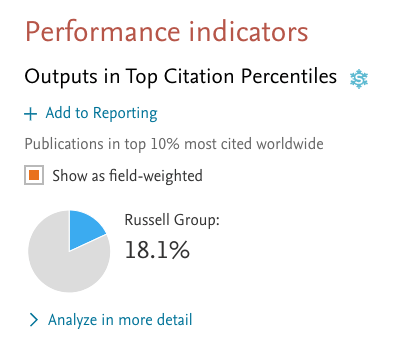
- We’ve added the subject area breakdown in Overview for Topics, Topic Clusters and Research Areas
To see the subject areas these entities are publishing in, scroll down on the Overview, Summary page. - New SciVal API calls for Publications and Scopus Sources
Get the 12 most selected metrics in SciVal via a document EID or for a Scopus Source for deeper analysis outside of SciVal, or to populate your own site with metrics.
The May 19, 2020 release brings 3 new visualizations, a faster way to build Research Areas from Topics and greater transparency on entity calculation timings:
- 3 new visualizations available for Institution Groups
View current collaboration (by co-authored publications) within an Institution Group and its impact via 3 new visualizations – Matrix Table, Roof-Shaped Matrix or the Chord Diagram. Learn which collaborations in the group have the most impact via 8 available metrics.
- Create a Research Area from Topics faster
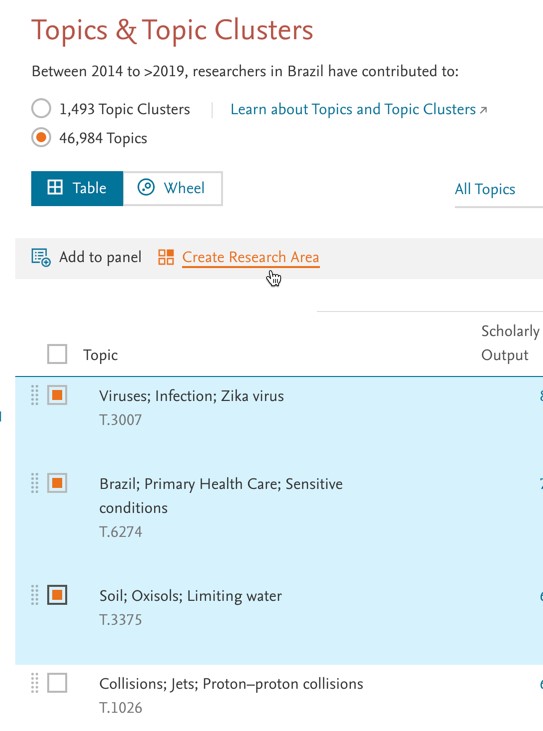
Anytime you see a list of Topics within SciVal you can select the Topics of interest and quickly combine them to create a Research Area (to a maximum of 100k publications). Alternatively, you can import a list of Topic IDs and build a Research Area that way!
- Get a more accurate estimate of when your new entities will be ready to use
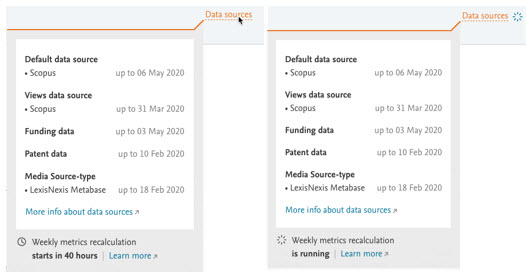
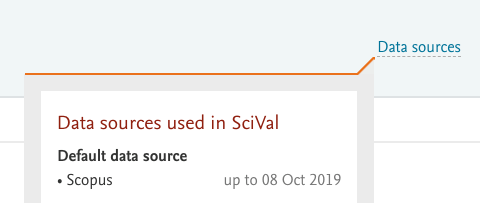
At the end of the entity creation process SciVal will tell you if your entity will be calculated within 6 hours or if you’ll need to wait longer because the weekly metrics recalculation is taking place. Want to know when the next weekly metrics recalculation will take place? Click the Data sources link and it will tell you.
- Subtle release alerts
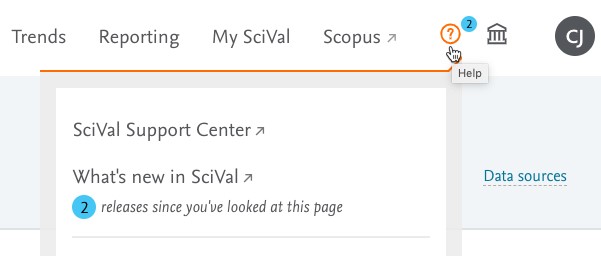
We will no longer use splash screens to alert you of a new release (a lot of you used to click it away without reading anyway ). Instead you will see a number next to the question mark icon on the top right of the screen, which will guide you to the release page. The number indicates the number of releases that have taken place since you last visited the page. Much more subtle!
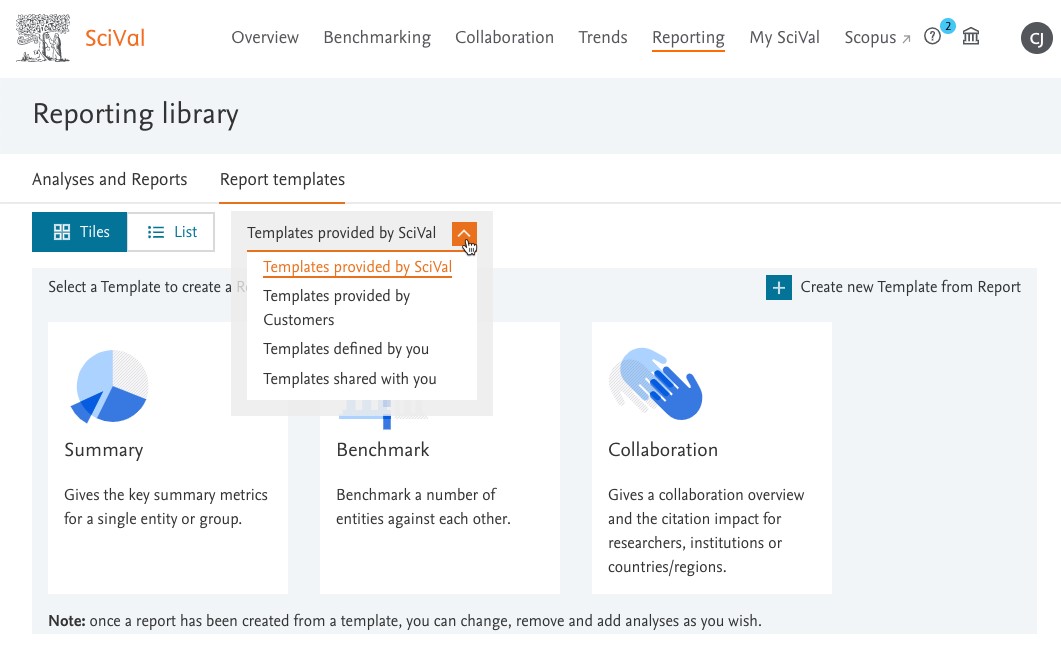
- Report templates are more visible in the Reporting section
We see that you are using the report templates more, so we’ve added a number of new features to help make them easier to locate. We’ve added a new tab within the Report library for the report templates, provided a simple way to filter between shared and pre-defined templates and added a list view.
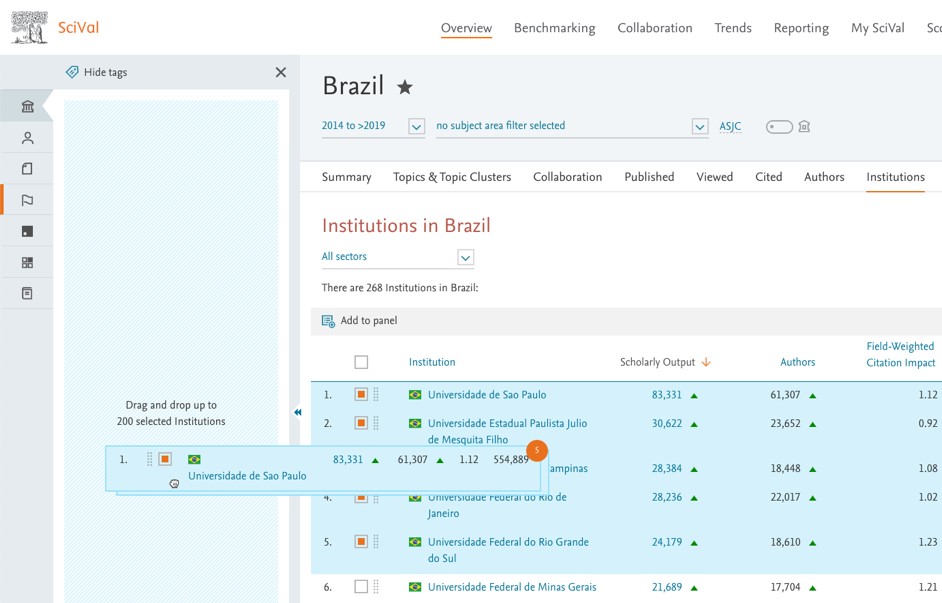
- Drag and drop institutions to the selection panel for quick analysis
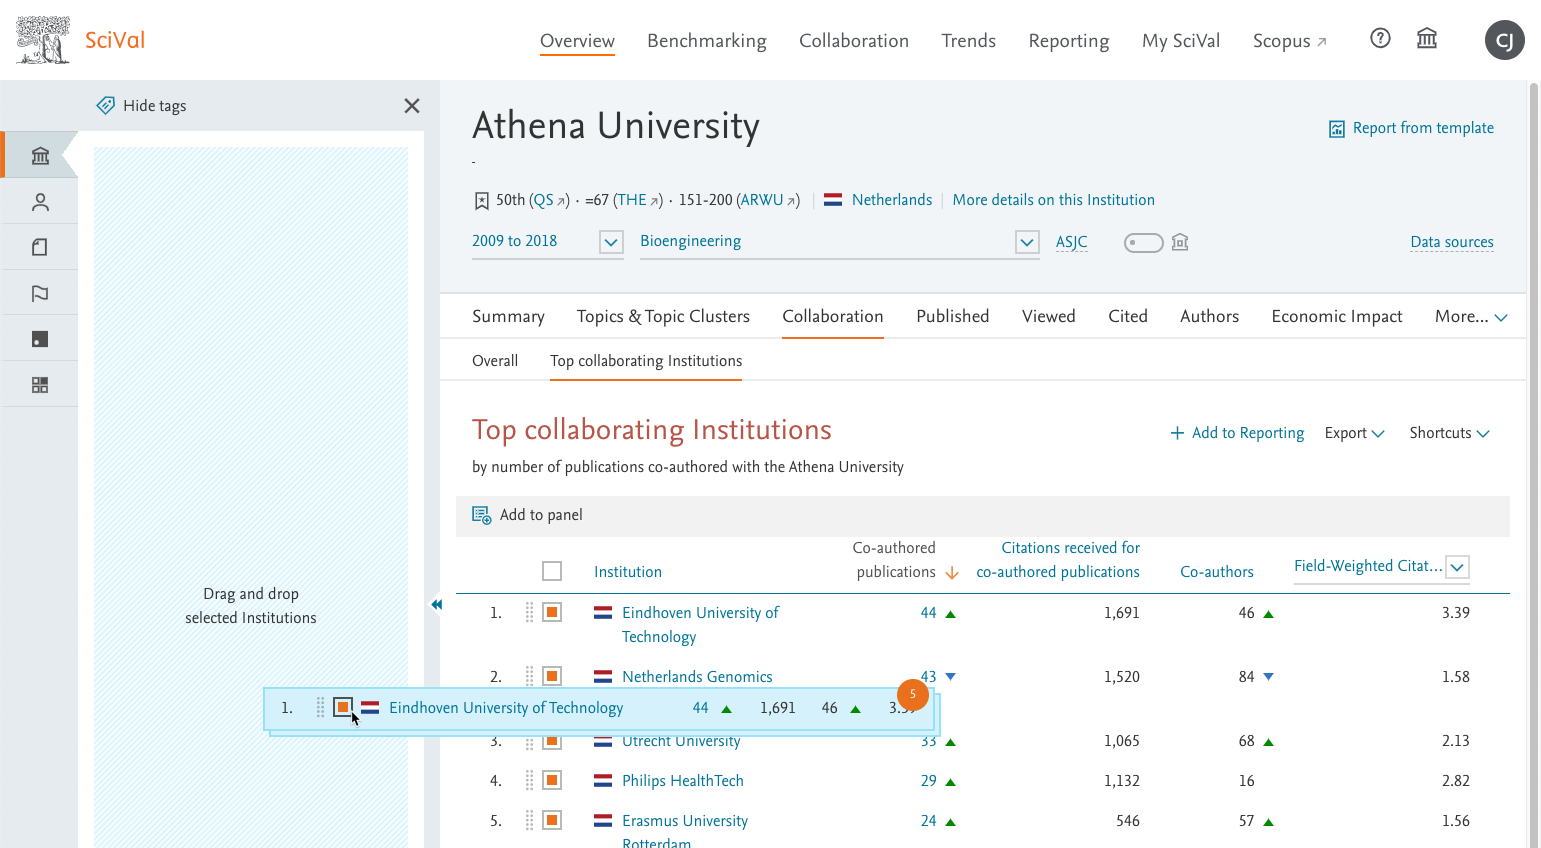
In Overview when looking at list of Institutions, for example when analysing a Country, you can now drag and drop up to 200 Institutions to the entity selection panel on the left side for further analysis.
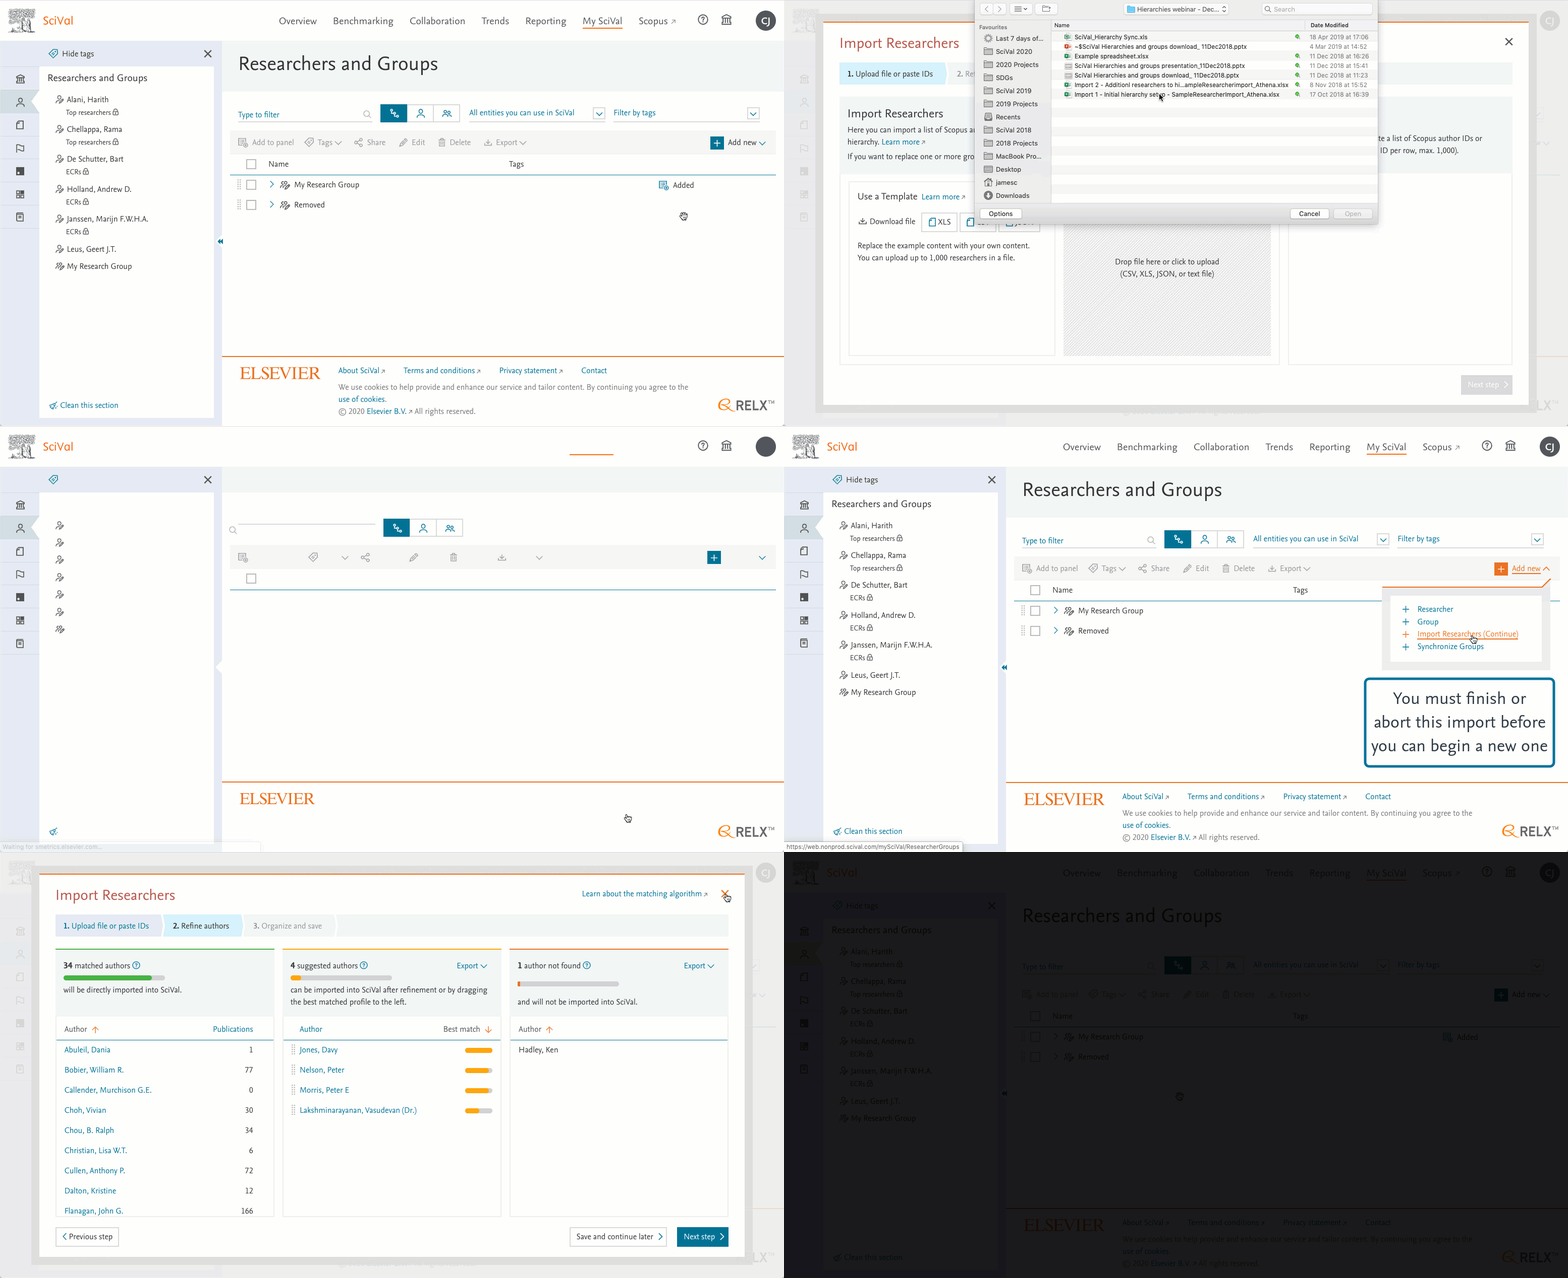
- Import large Researcher hierarchies over multiple sessions
During the import process, SciVal automatically saves any changes you make, so you can safely leave the process at any point and finish it at a later date! Please note that you must either finish or abort the current researcher import process before you can start a new one.
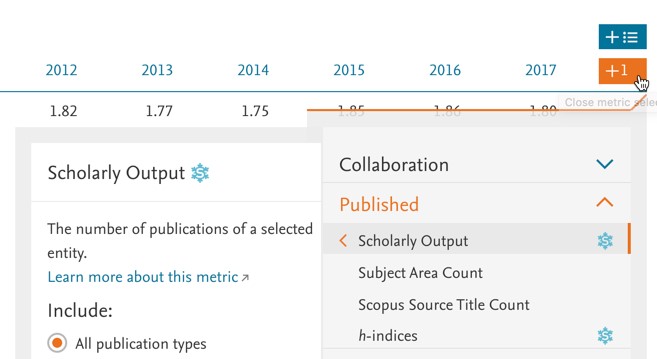
- Add individual metrics to the Benchmarking table
Click the +1 to add an individual metric to the Benchmarking table.
The April 21, 2020 release brings the ability to share report templates, a free SDG layer and a cumulative timeline motion chart.
- Share report templates with your colleagues
Share any template you've created with individual colleagues, so they can benefit from your preferred set of analyses. Click the share icon on the report template and input the email addresses of the people with which you’d like to share the template. SciVal admins can share their templates with the whole institution.
We’ve also simplified the layout when you create a report from a template to make it easier to see the different types of report templates. Over the coming releases we will further improve the visibility of the report templates in the Reporting section.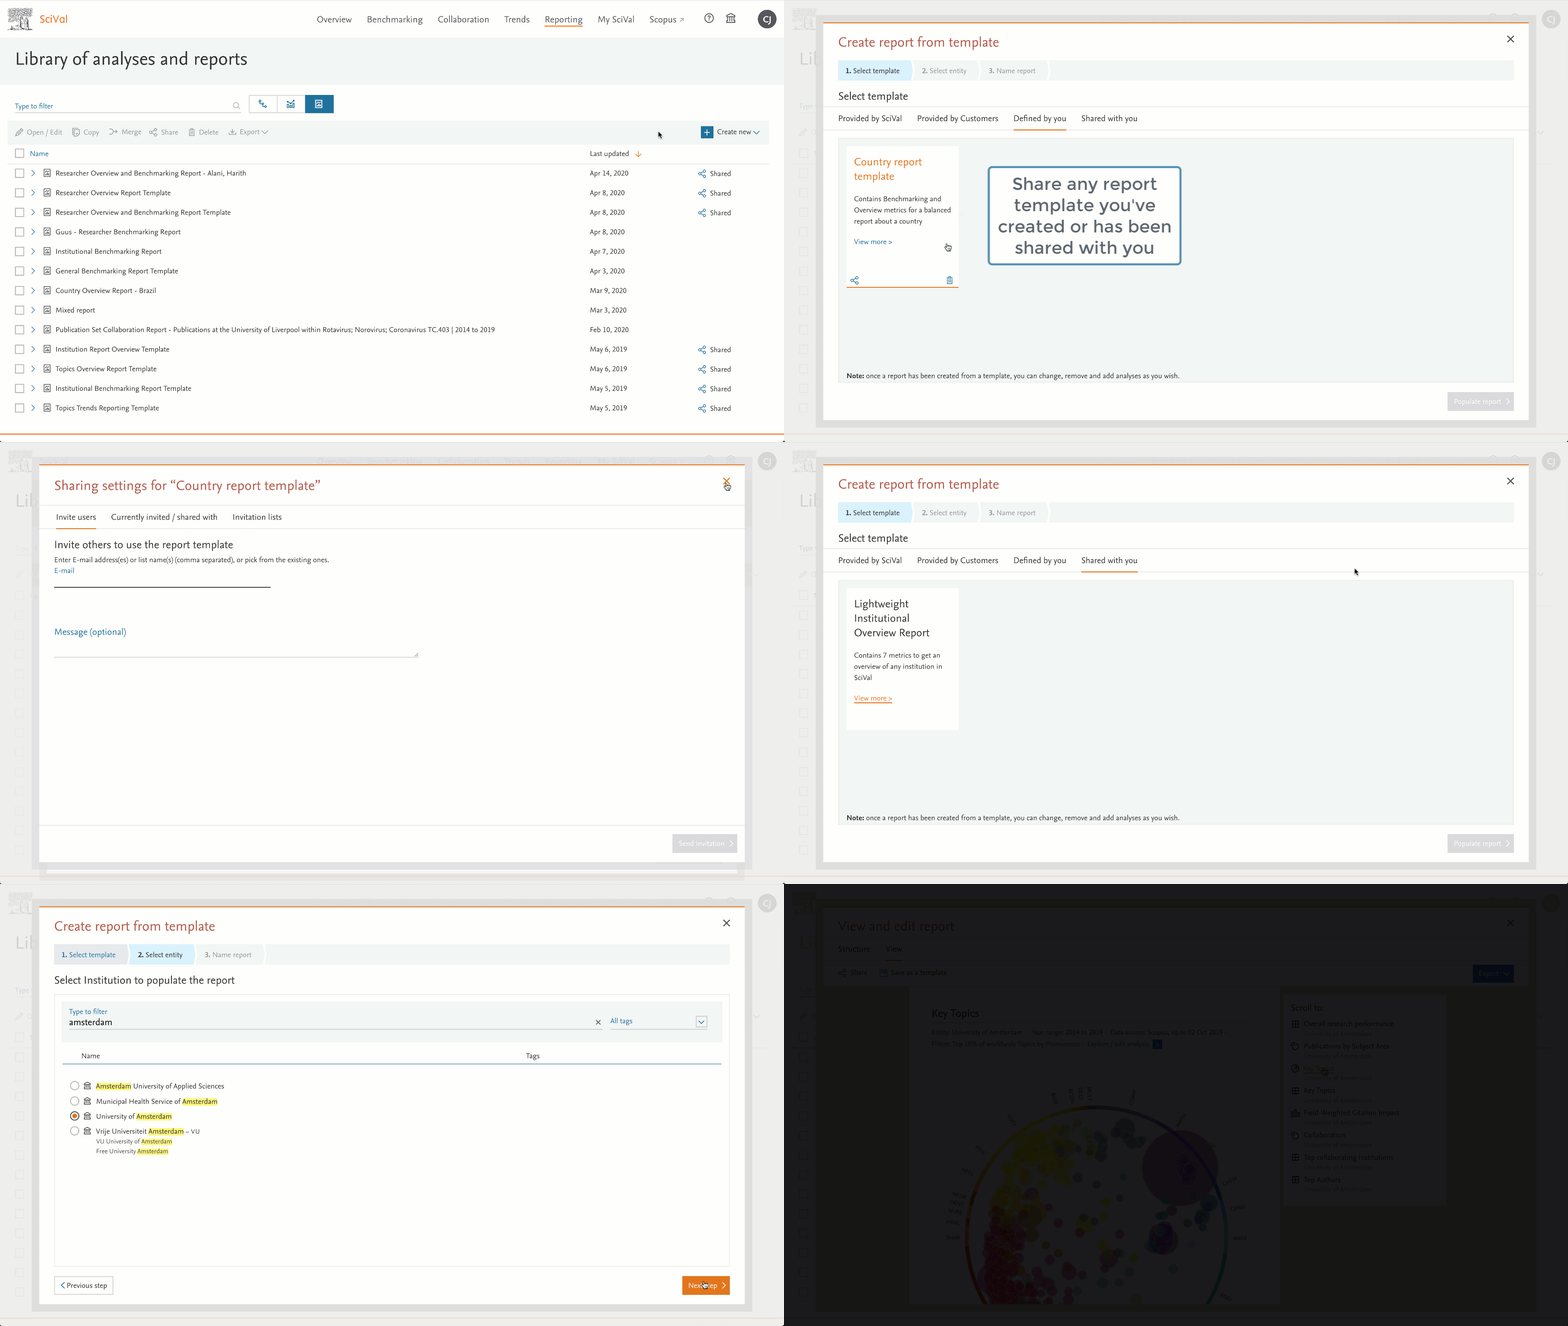
- SDG free layer and data update
We’ve created a free layer of SciVal for the UN Sustainable Development Goals that anyone can access via https://www.scival.com/sdgopens in new tab/window. Here you can see the keyphrase analysis and largest Topic Clusters, as well as the most active countries/regions and institutions for the 16 SDGs covered in SciVal.
We’ve also updated the data behind each SDG to contain publications up to March 2020 and match the data used in the new THE Impact Rankings.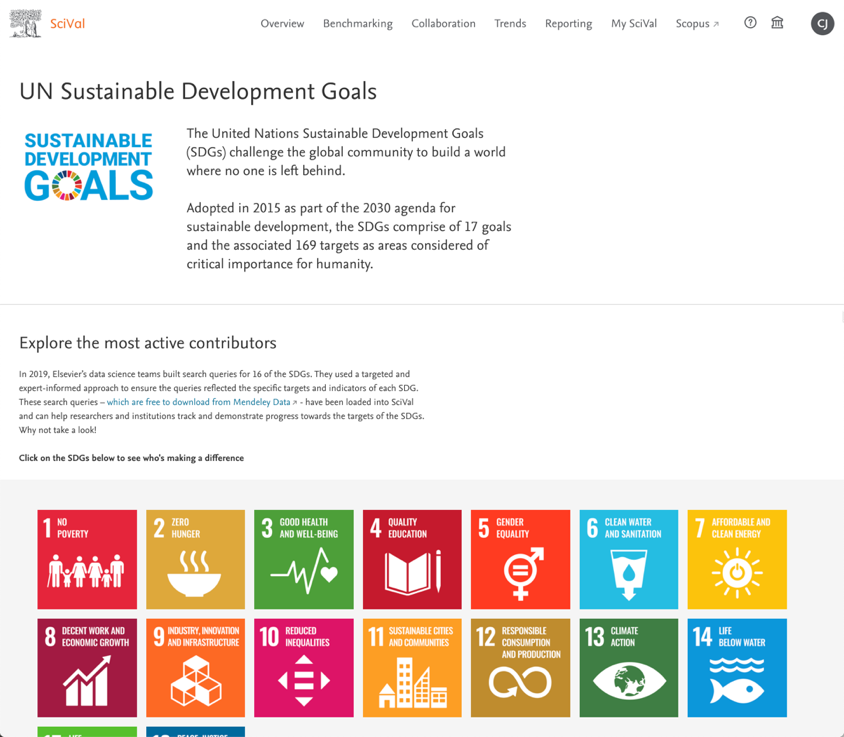
- Cumulative timeline motion chart in Benchmarking
See not only the yearly values, but also the cumulative development of metrics over time. Select 2 or 3 metrics and flick the switch in the Benchmarking chart view to see the cumulative development over time.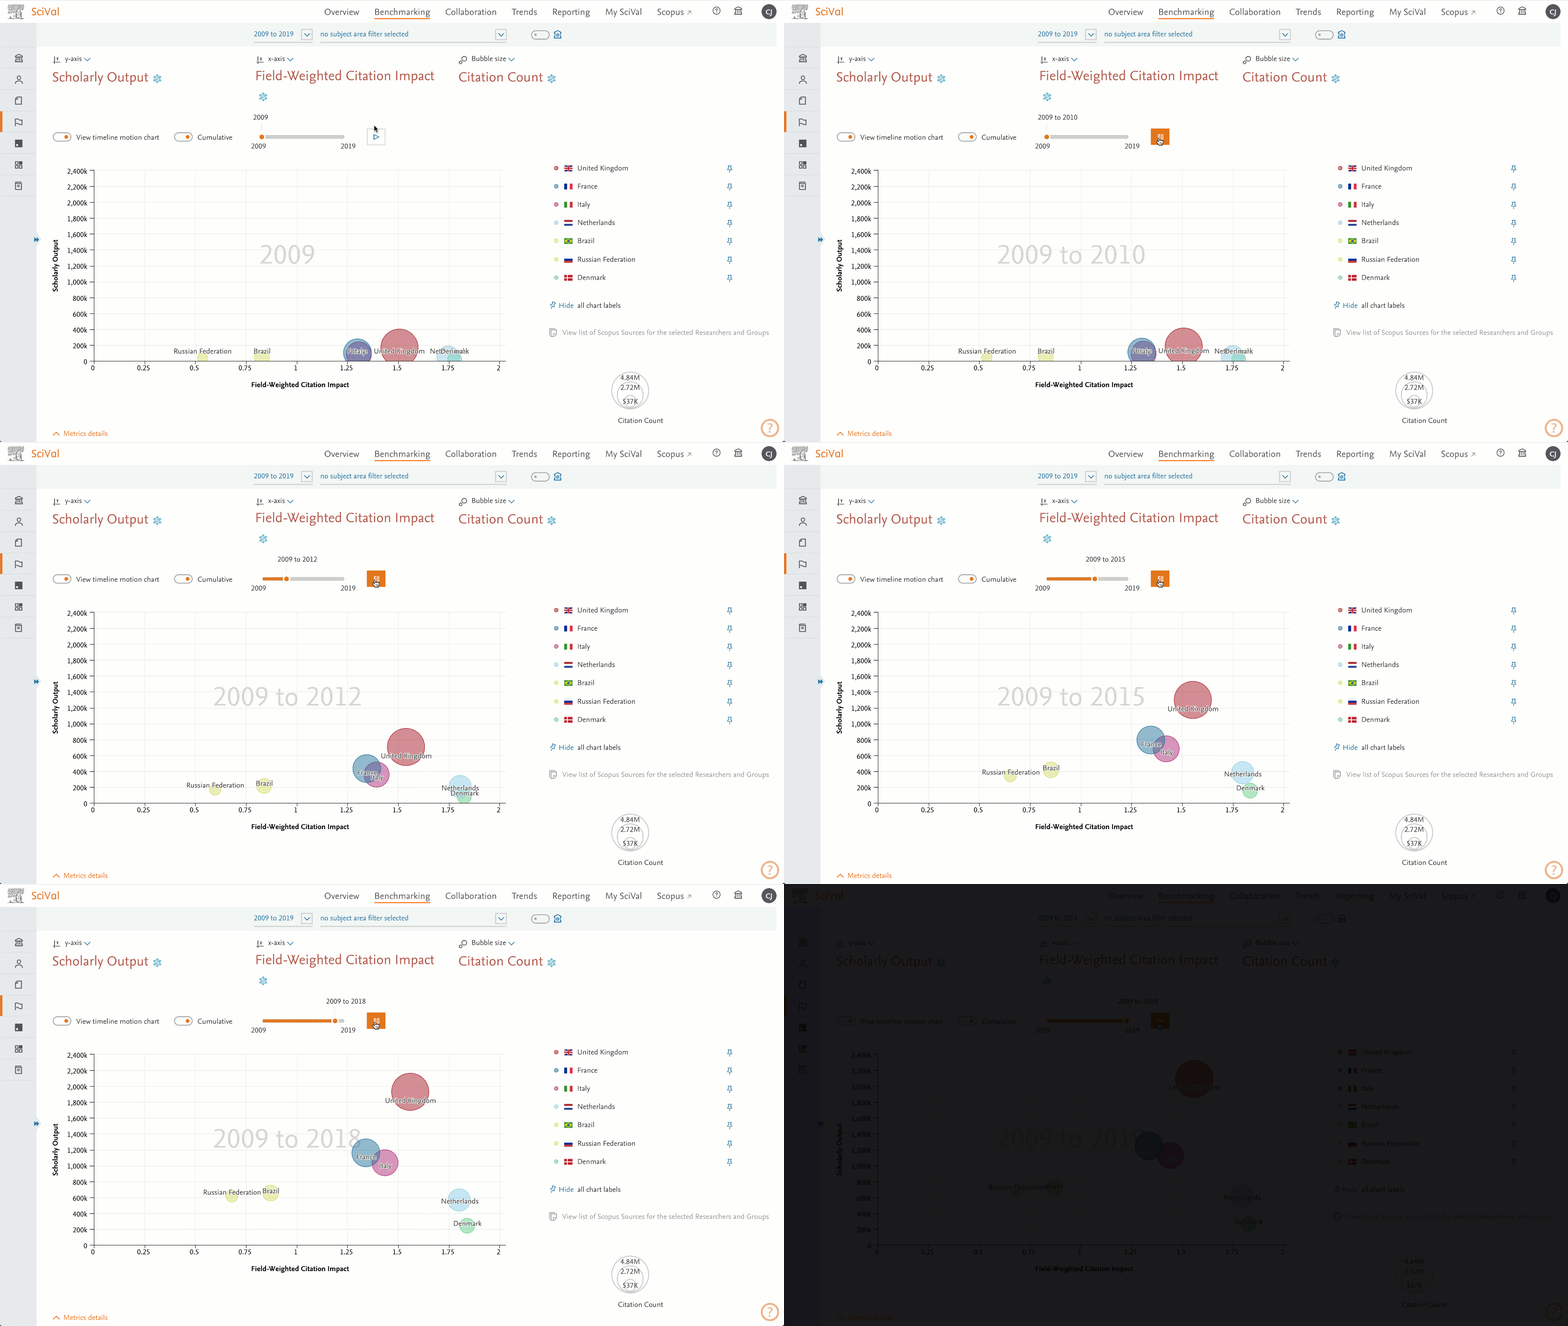
- See the collaboration breakdown for more entities
You can now see the citation impact of different types of collaboration for Countries, Research Areas, Topics and Topic Clusters in the Overview module.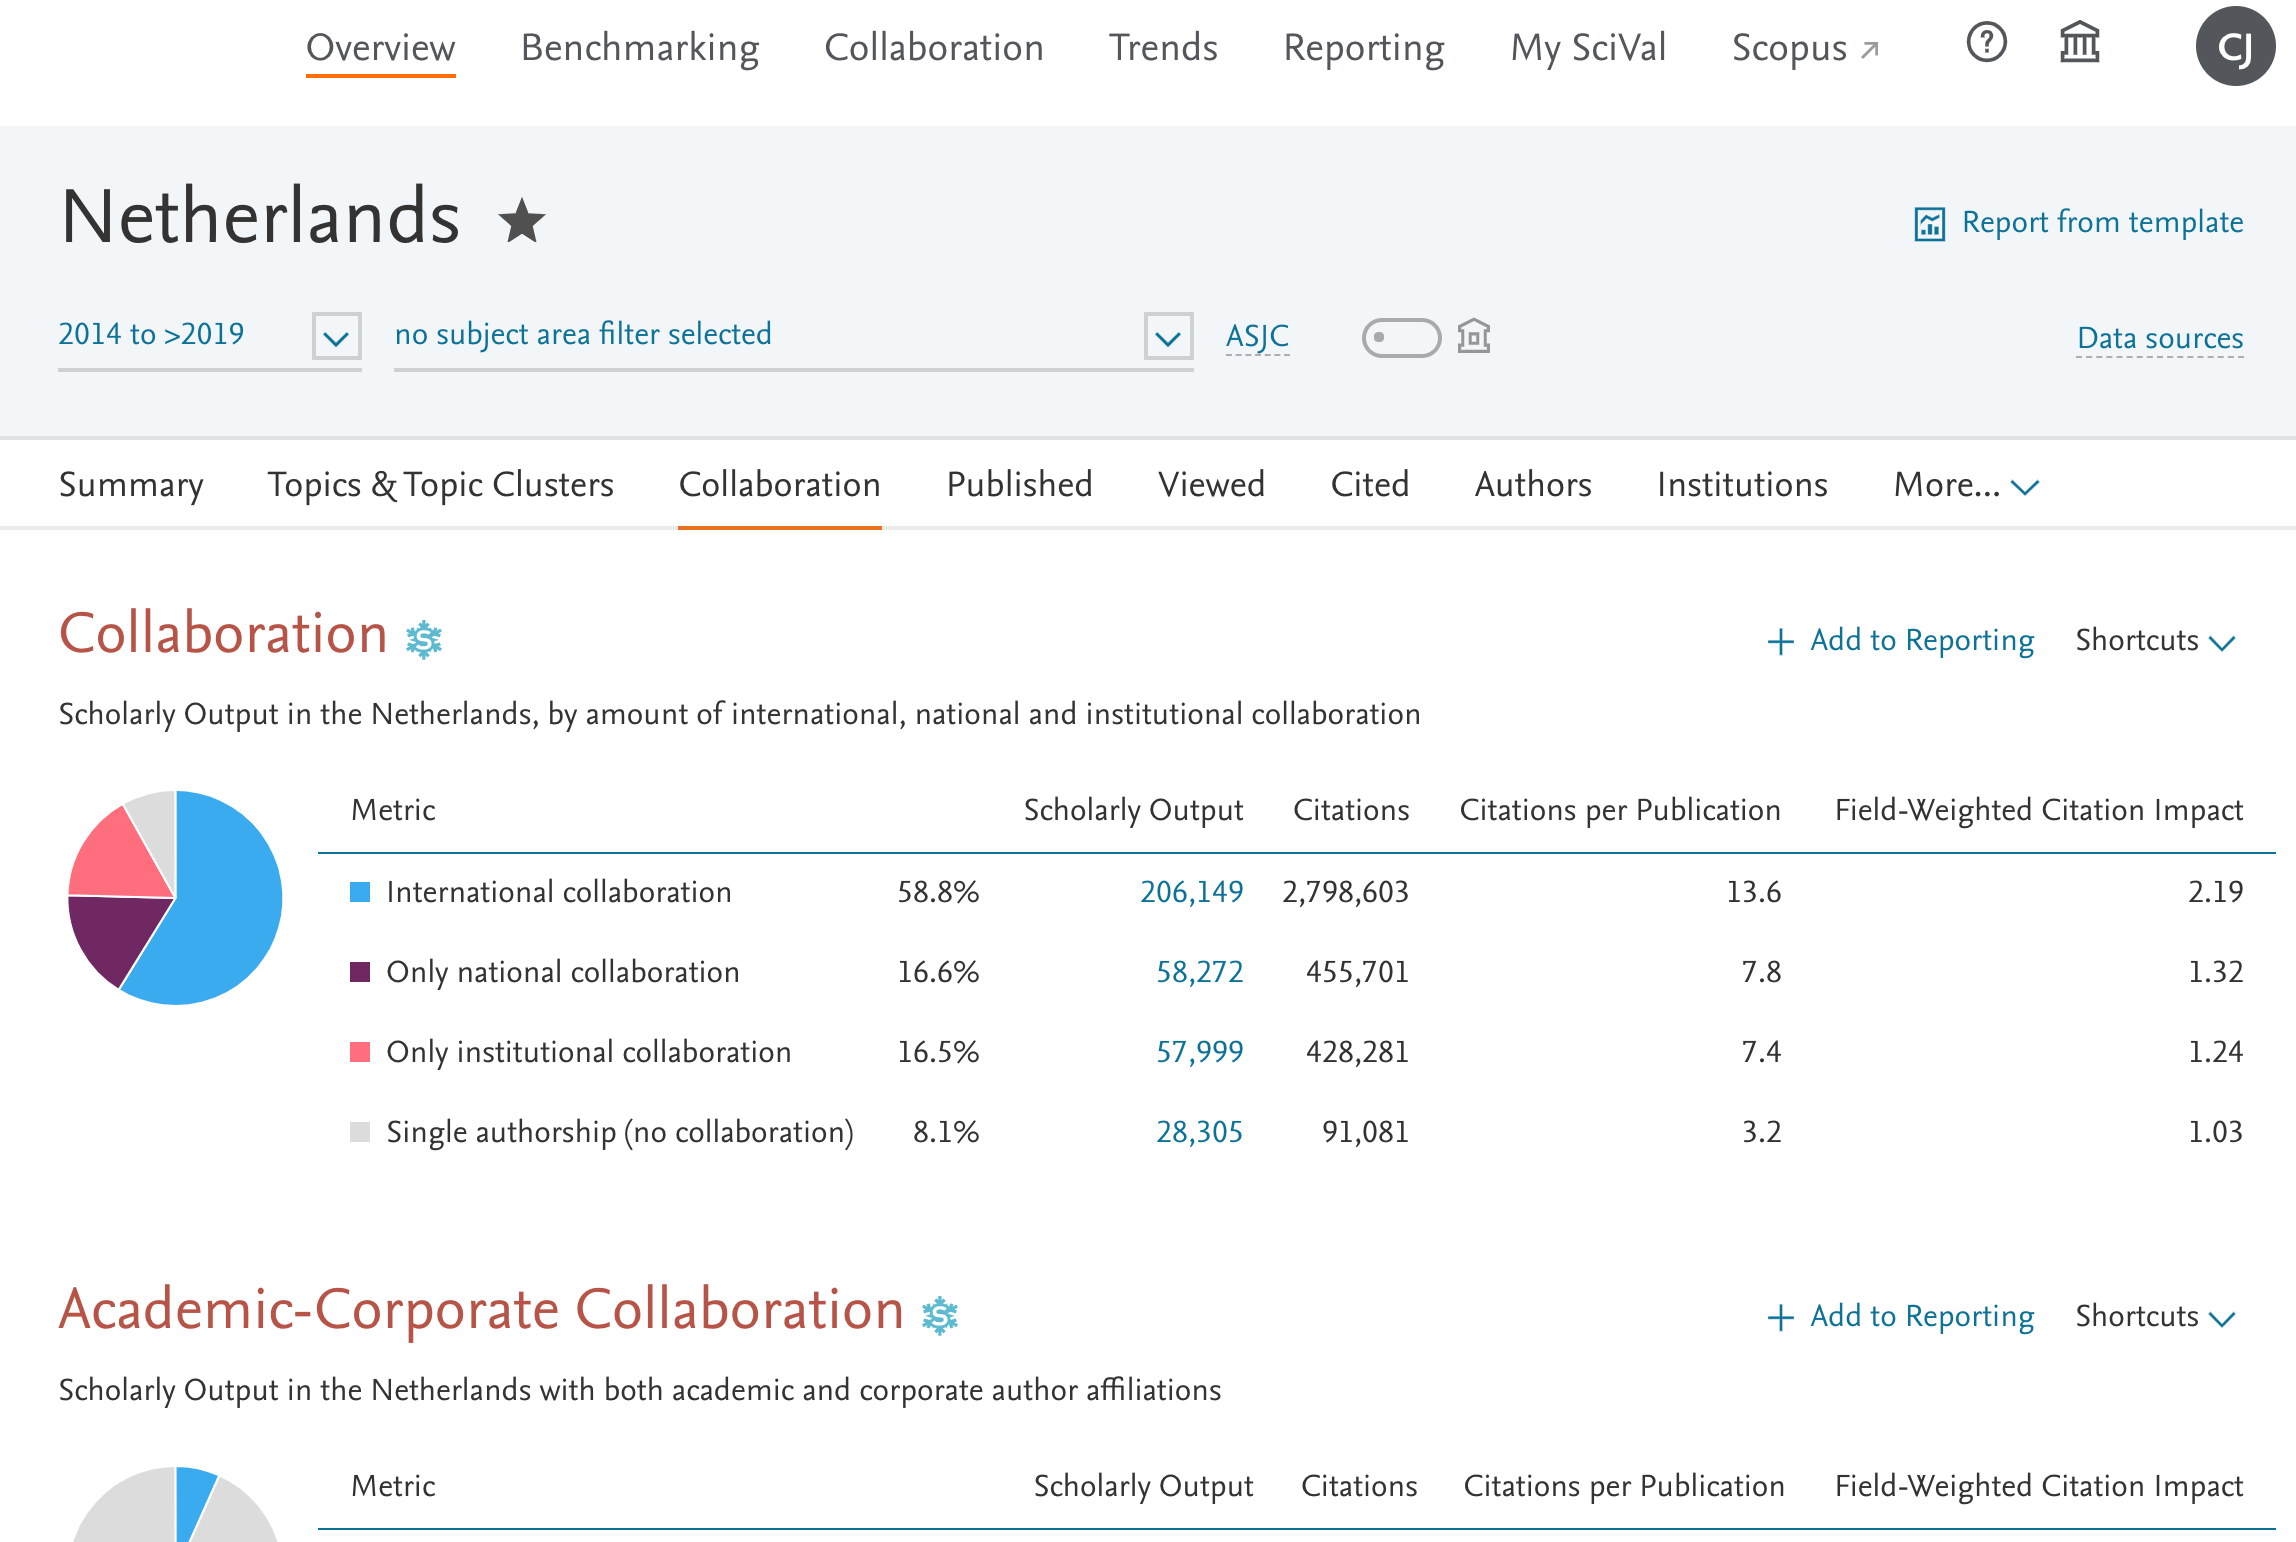
- Easily export multiple metrics broken down by year
Select up to 25 metrics for up to 100 mixed entities in the Benchmarking module and get a “power export” of each metric broken down by publication year. Previously this would have been up to 25 separate exports.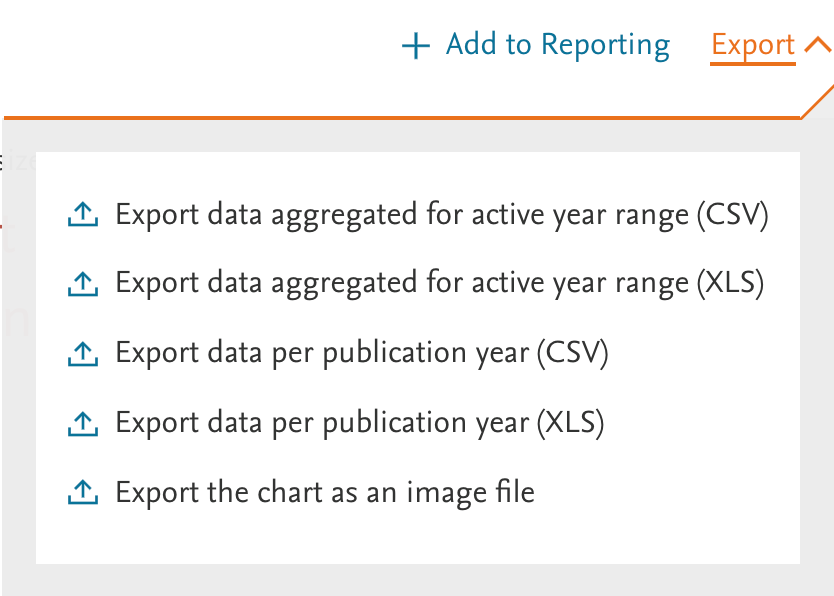
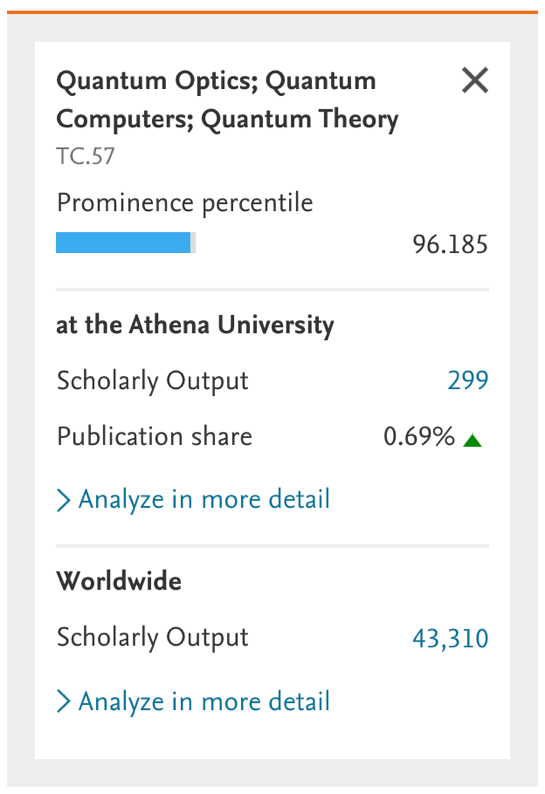
- We made the information on the Topics wheel easier to interpret by clearly splitting the metrics at the entity vs the world level.
- Additional metrics guidance for the Scopus Source metrics and link to Scopus
Metrics guidance has been added to the journal metrics section in Overview for the Scopus Sources, along with a link to the journal in Scopus, where you can learn more about the breakdown of the CiteScore metrics and articles within the journal.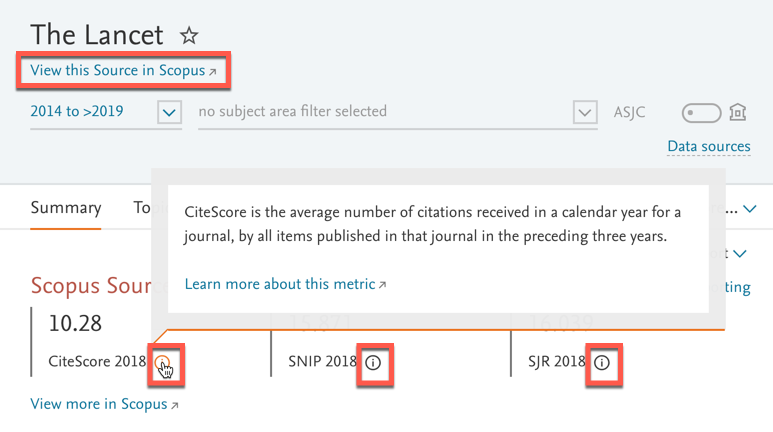
- When Researchers are removed from a hierarchy during a synchronization, they are now added to a folder called Removed to make them easier to locate in My SciVal.
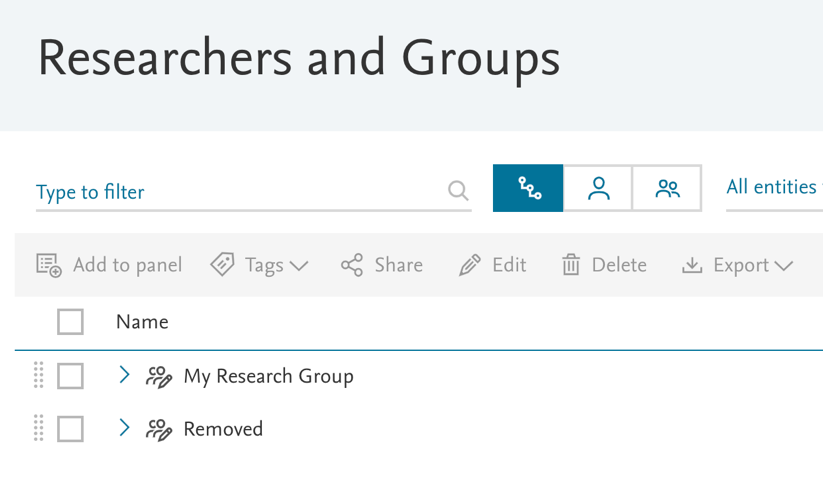
- When exporting Researchers from My SciVal, the export now includes any tags given to them. These tags can then be used during the import or synchronization processes.
The March 10, 2020 release brings Scopus Sources as an entity type, the ability to create your own report templates and timeline motion charts.
- Scopus Sources – A new entity type
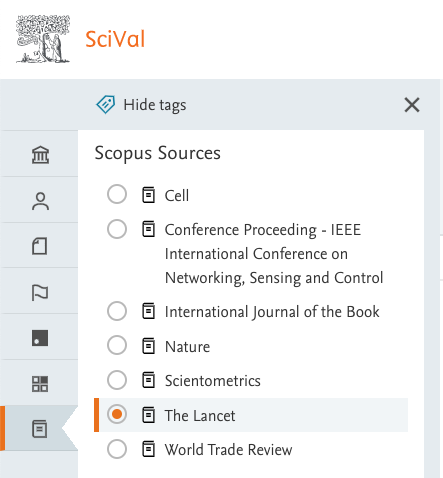
Easily analyse the impact of individual journals, books, conference proceedings and trade journals and develop effective publication strategies. To look at a source in SciVal, click on the journal icon in the left-hand panel and click “+ Add Scopus Source,” then search for the name of the source. Quick and easy!
- Create your own report templates
Speed up repetitive tasks – use a report template you’ve created from a report. Choose any report you’ve created with a single entity type in it (for example a report about a Researcher) and choose the “Save as report template” option. In the coming releases we’ll add sharing and more editing options..gif)
- Timeline motion chart to analyse progress over time
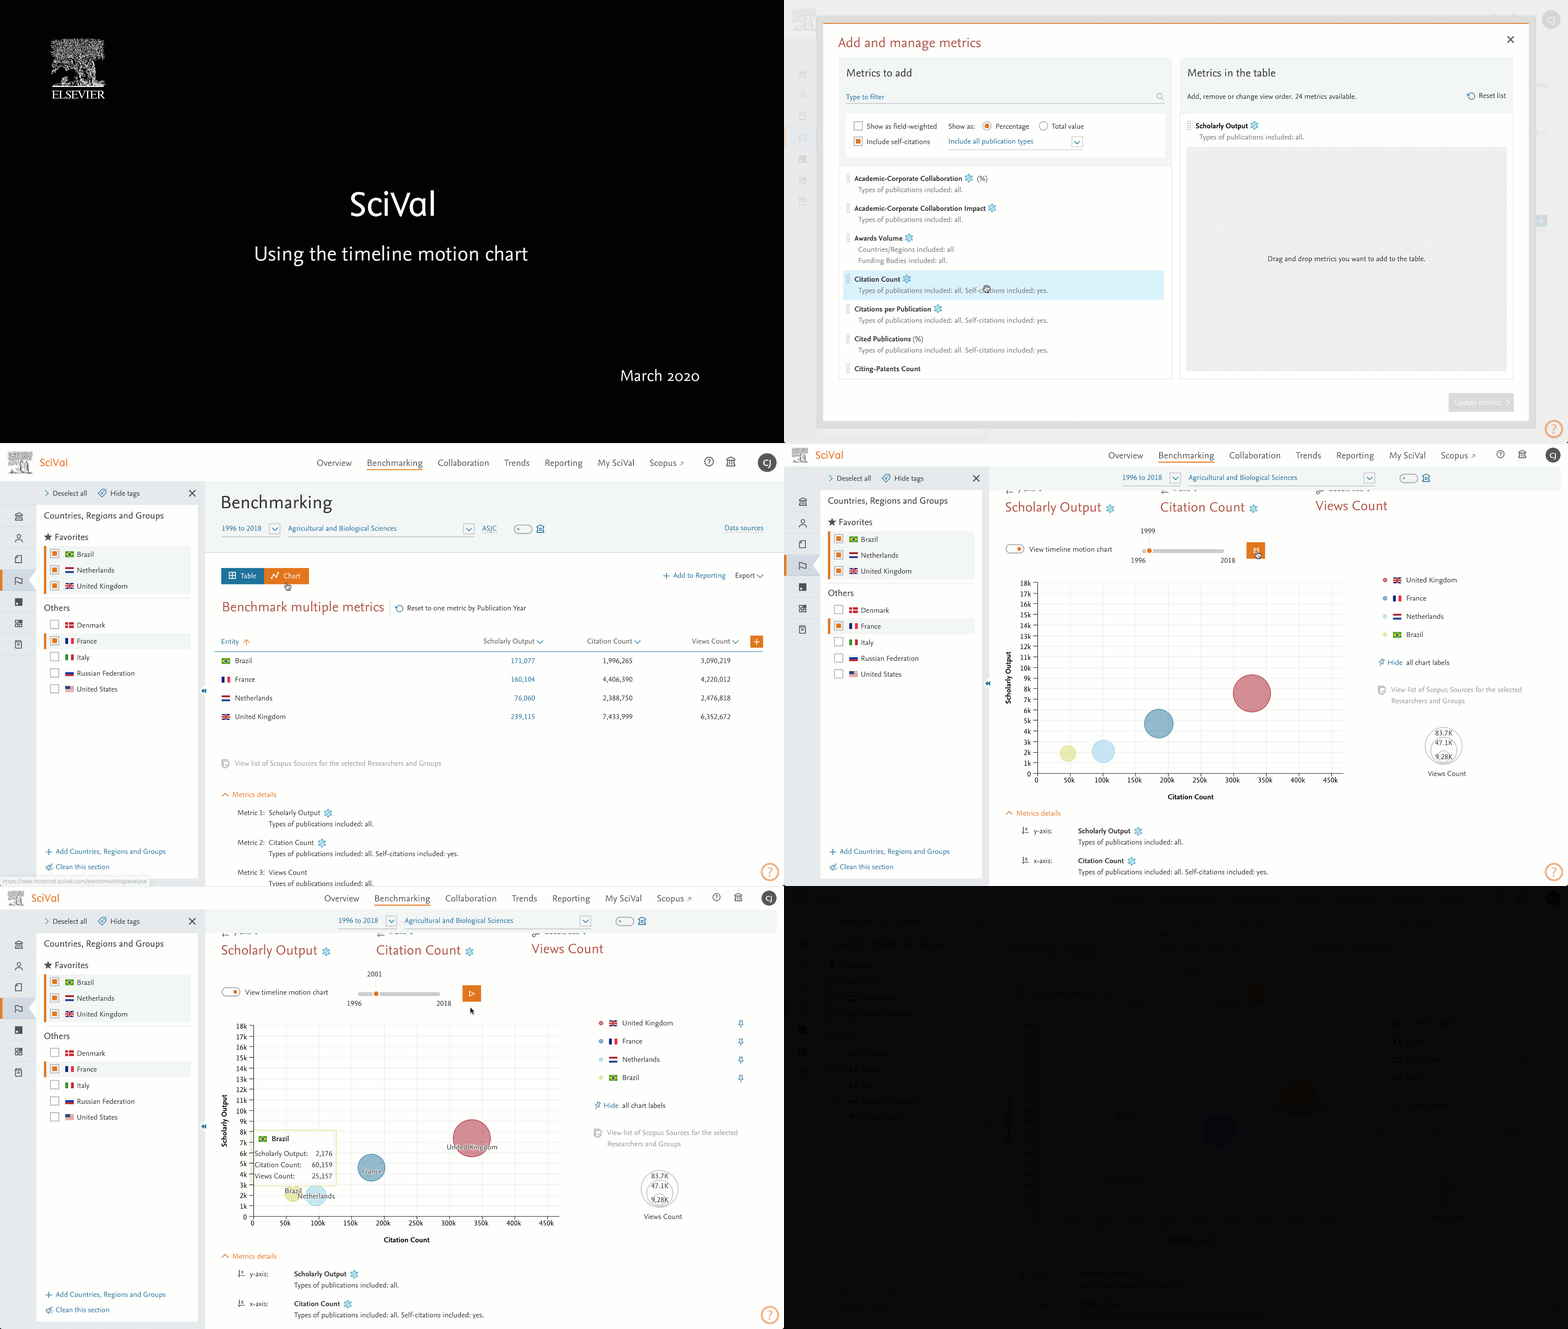
See the progress of entities over time in Benchmarking when you select 2 or 3 metrics. Once the metrics are selected, go to the chart view and select, “View timeline motion chart,” click play and watch the action!
- Benchmarking table updates
We’ve listened to your feedback and made a number of improvements to the Benchmark table. We’ve added a header, reduced the white space so you can fit more metrics on the page and made it easier to reset your table back to Scholarly Output only.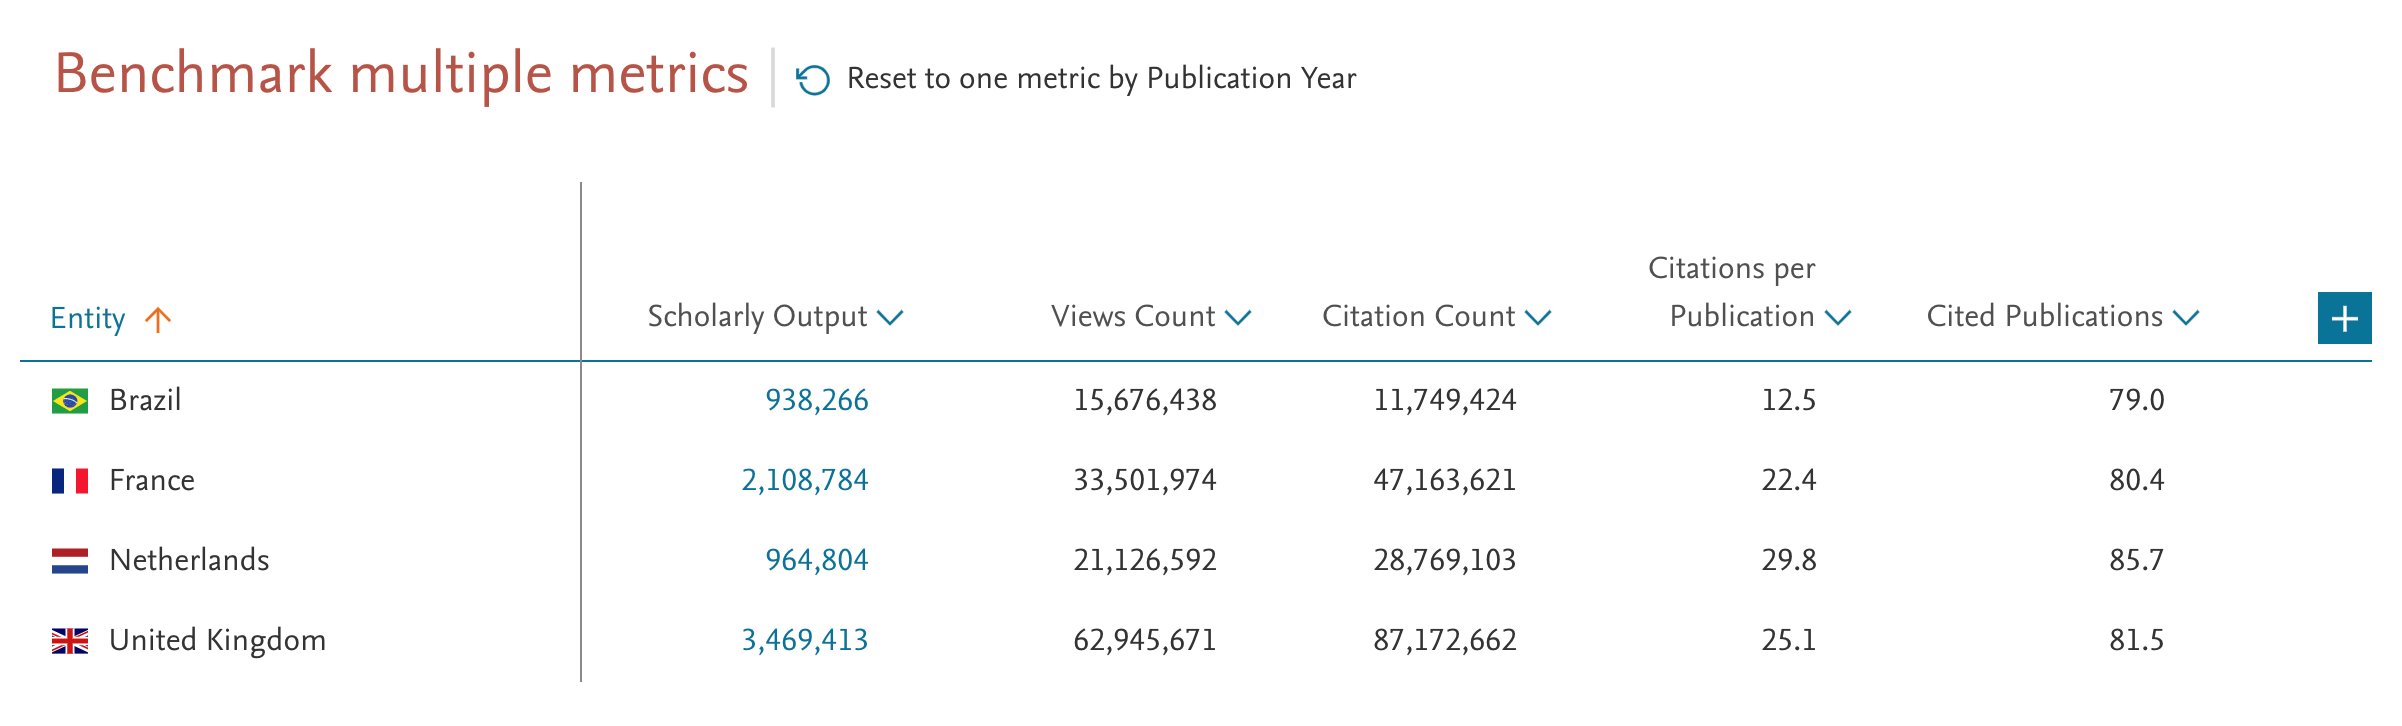
- Improved filtering using tags
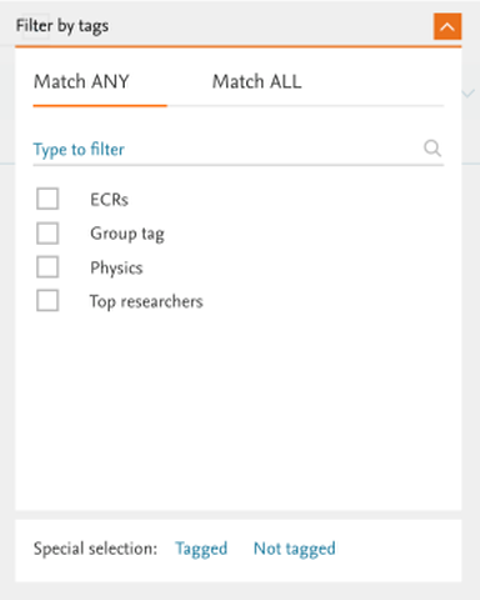
When in My SciVal the filter by tag option now displays all available tags for the entity type, making it easier for you to make the right selection.
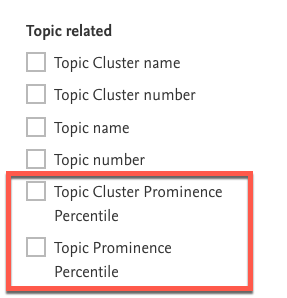
- Get the Topics Prominence percentile along with the Topic name and number when exporting publication information. Use this information to help identify the relative momentum of the selected publications.
The February 11, 2020 release brings a customer defined Reporting Template from the Université Paris-Saclay, the ability to highlight items on the map and wheel views and a new summary layout with metrics guidance.
- New customer defined Reporting Template by Université Paris-Saclay
The Université Paris-Saclay have shared a report template that they use to benchmark the collaboration that their institution has with peers, using subject specific Publication Sets.
To use this template you must first define an area of interest using SciVal or Scopus and then create Publication Sets from this area for each institution you want to compare in the report. This report template requires the Overview and Benchmarking modules and contains metrics guidance, along with directions on how to interpret the analyses.
- Highlight items of interest on the Topic wheel and Map visualisations
When using the Topic wheel or the map visualisations in Collaboration and Trends, you can now ‘pin’ tooltips that appears when you hover over the data points. This allows you to highlight key items of interest before adding them to a Report. To complement this functionality, we’ve reduced the space that the information tooltips take up, giving you more space to work with.

- New summary layout with metrics guidance
In the new layout we’ve placed a greater emphasis on the metric values, by moving them to the top. To help interpret the metrics, we’ve also added guidance to most metrics. The new layout is available in both the Overview and Trends modules.
- See which researchers have shared datasets
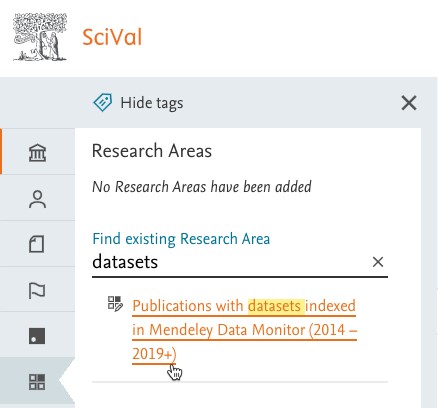
We’ve created a new Research Area called “Publications with datasets indexed in Mendeley Data Monitor (2014 – 2019+),” which uncovers the publications with datasets from the 1700+ repositories included in the Mendeley Data Monitor. You can use this to identify, for example, the Researchers / Institutions / Topics that are sharing their research data and the citation impact that research has had.
To find the Research Area, search for “datasets” in Research Areas either in the left-hand panel or in My SciVal. Learn more about Mendeley Data Monitor where you can link to the underlying datasets.
- Create a new Publication Set based on a Group of Researchers
When creating a Publication Set using researchers, you now have the ability to see your Group hierarchies and create a Publication Set from Groups of Researchers.
- There are 3 new Collaboration Report Templates available that can give information about a country, institution or researcher
They’re available in the Reporting section or in the report from template section in Overview. Give them a try!
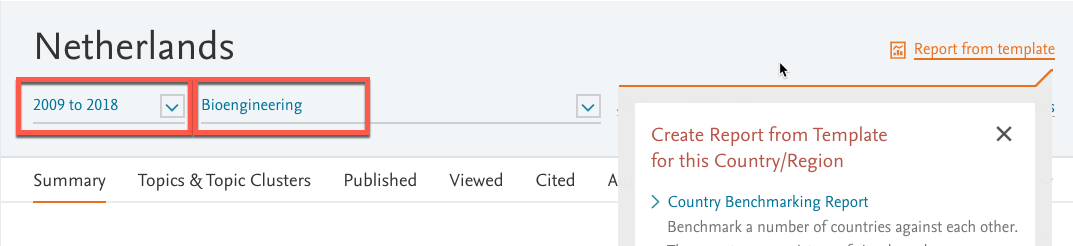
- Report from template uses the selected year range, subject area and home institution filter in the report
Choose the options you’d like to use in Overview or Trends and they’ll be applied to the report.
- Journal Quartiles now available to add to reports
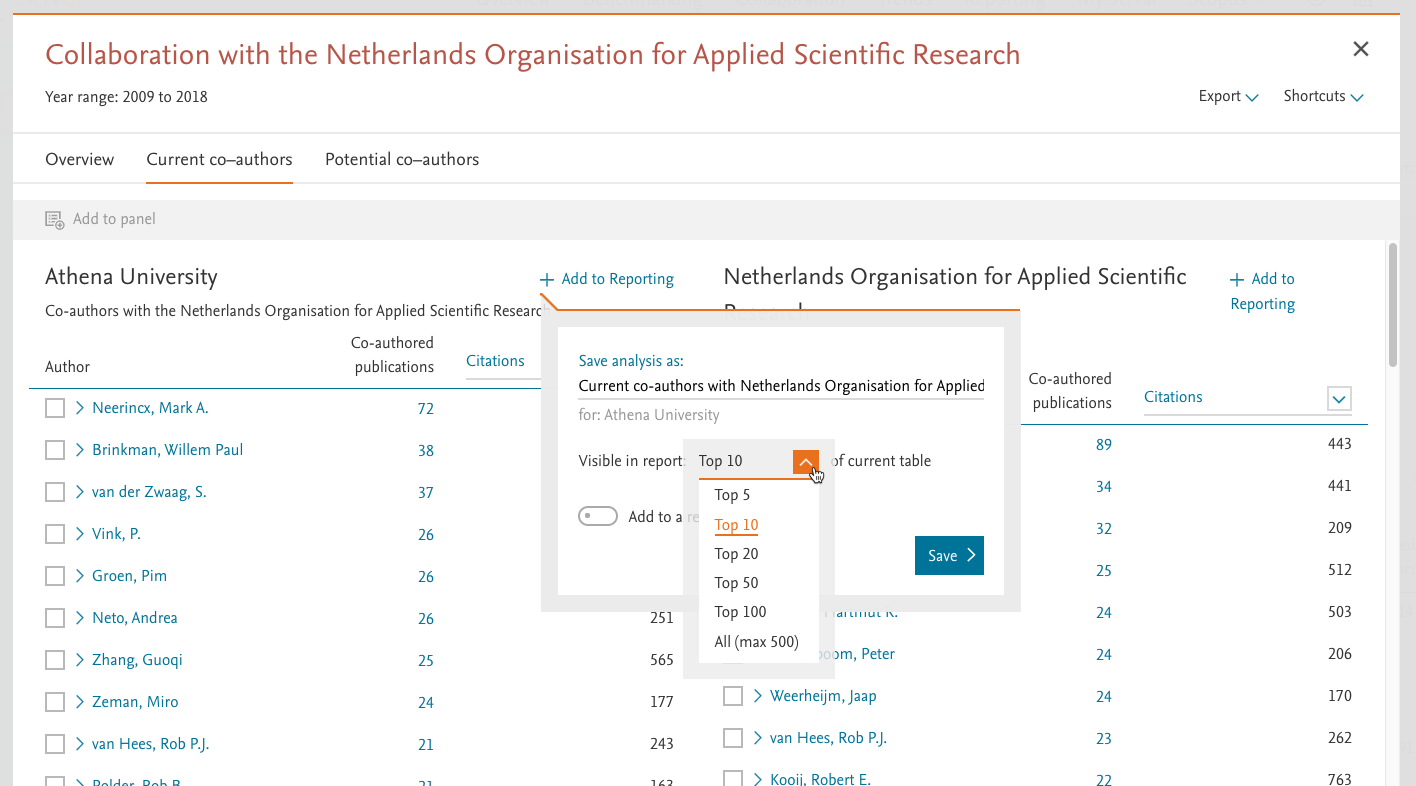
- You can now limit the number of authors when adding a list of potential or current co-authors from the Collaboration module to Reporting
- Drag and drop the top collaborating institutions from the Overview module to the left-hand panel so you can use them immediately.
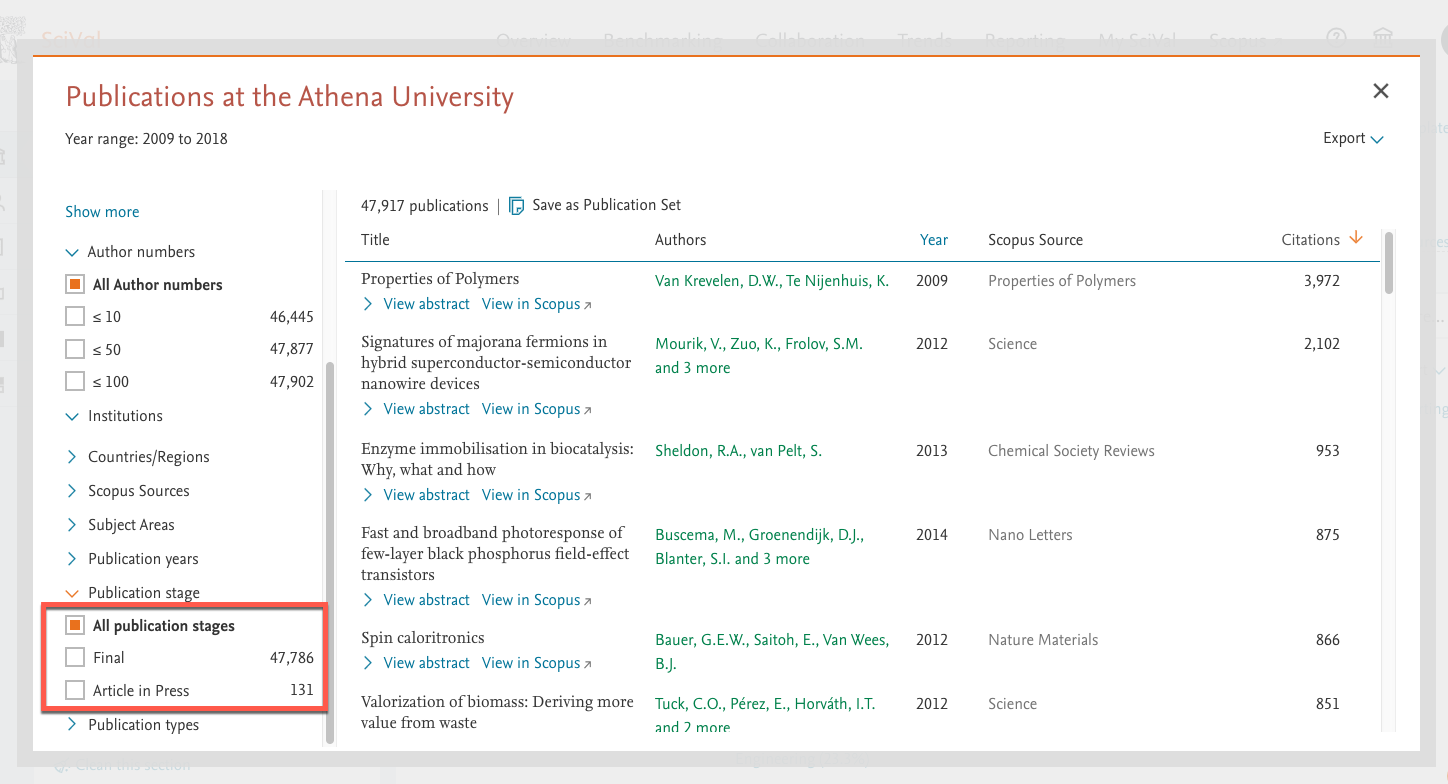
- Publication stage now visible
To align with Scopus, we introduced "Publication stage" in our publication links export window, from which you will be able to select either "Articles in Press" or “finalised documents”.
The January 14, 2020 release brings Topics for Research Areas and favorite entities
- Topics for Research Areas
You can now see the Topic contributions for any Research Area, both pre-defined and user defined. This means you can analyze the Topic output for all entities in the Overview module, including the UN SDGs.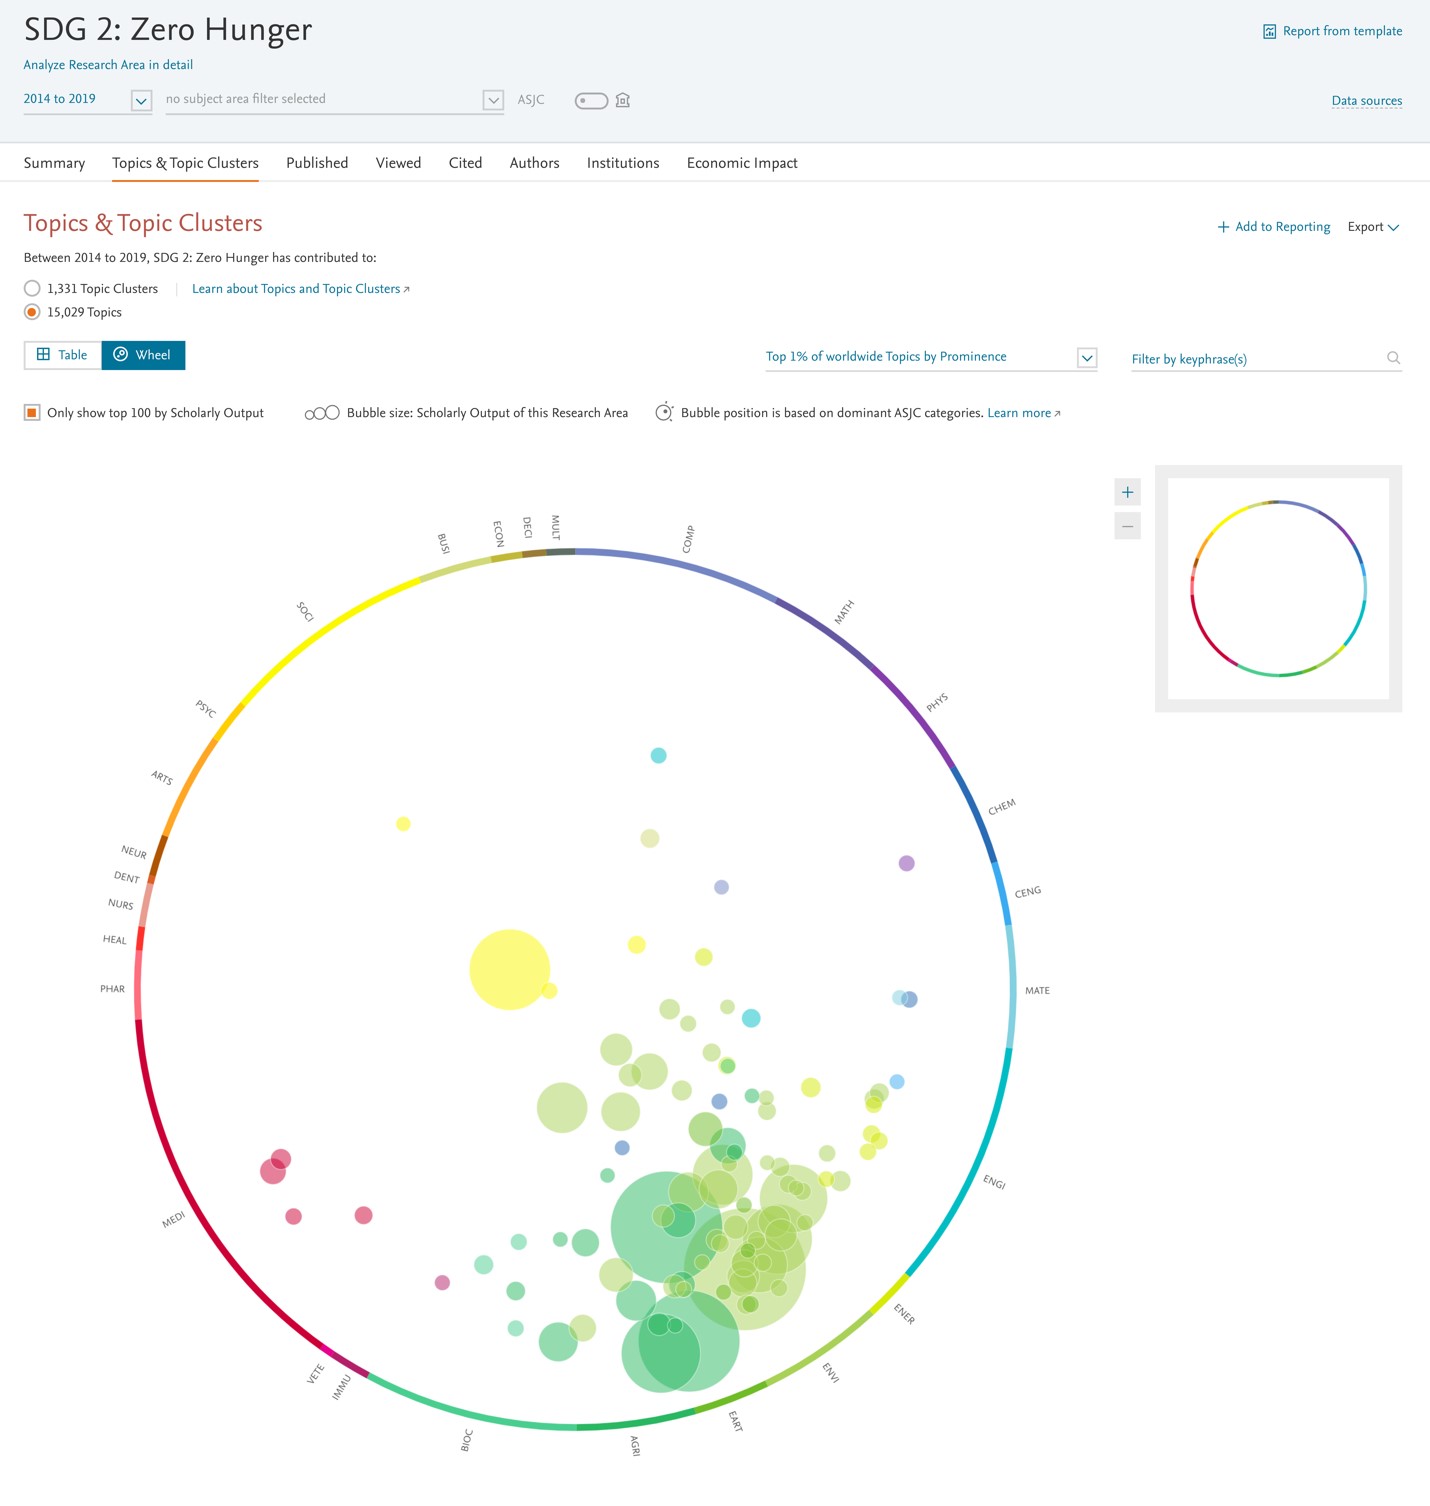
- Mark entities as favorites to have them readily available for analysis
Mark your most used entities as favorites in the entity panel so they are always readily available. We’ve also improved the entity selection in Benchmarking so that when selected, entities remain where they are and no longer move to the top of the list, making it easier to work with a long list of entities.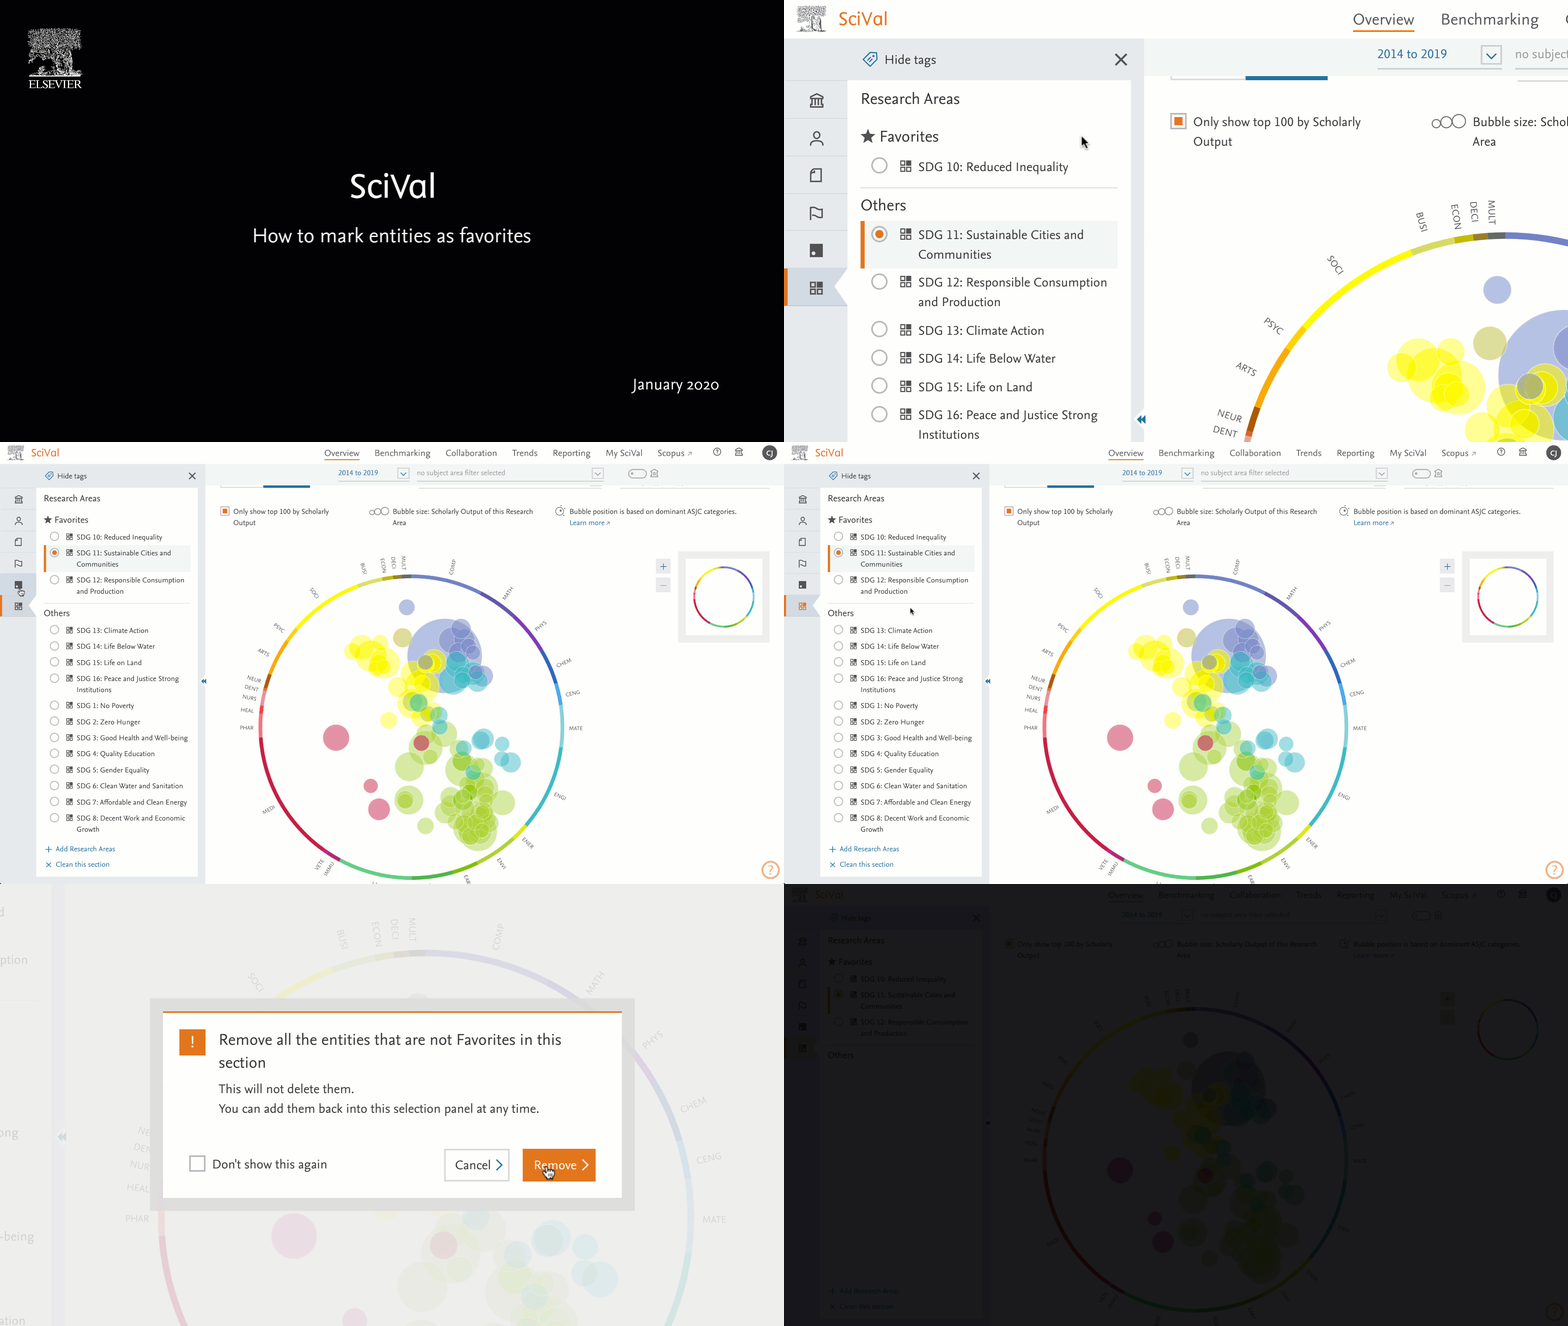
- Filter institutions by sector type in Overview and see the sector type in exports
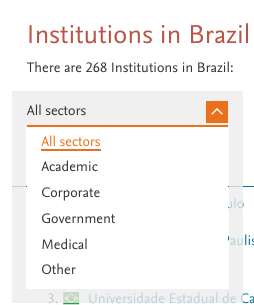
When looking at the institutions within a country in the Overview module, you can now filter by sector type. This information is also available as an additional column in any institution export file.
- Journal Quartiles metrics now have the publication type filter in Benchmarking
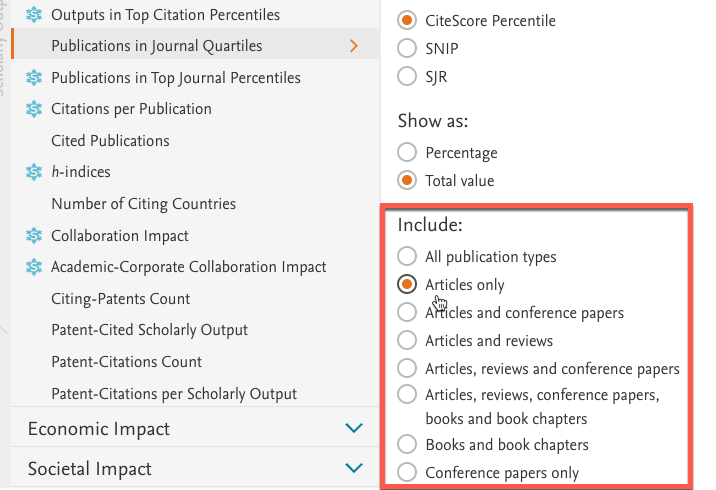
You can now filter the Publications in Journal Quartiles metric by publication type in Benchmarking. For example, use it to only include Articles in your analysis.
- Improved Benchmarking year range selector accessibility
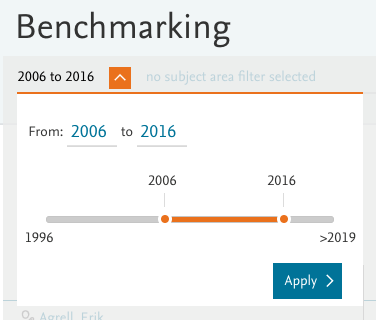
You can now type in a date range or use the keyboard arrows to move the year range slider. This not only improves accessibility, but makes it easier to select year ranges when using tablet devices.
- Improved metric headers in the Benchmarking table
We’ve reduced the font size for the metric names in the Benchmarking table header to make it easier to fit more on a screen or page. You can now also remove metrics from the chart, without it affecting the metrics you’ve chosen in the table.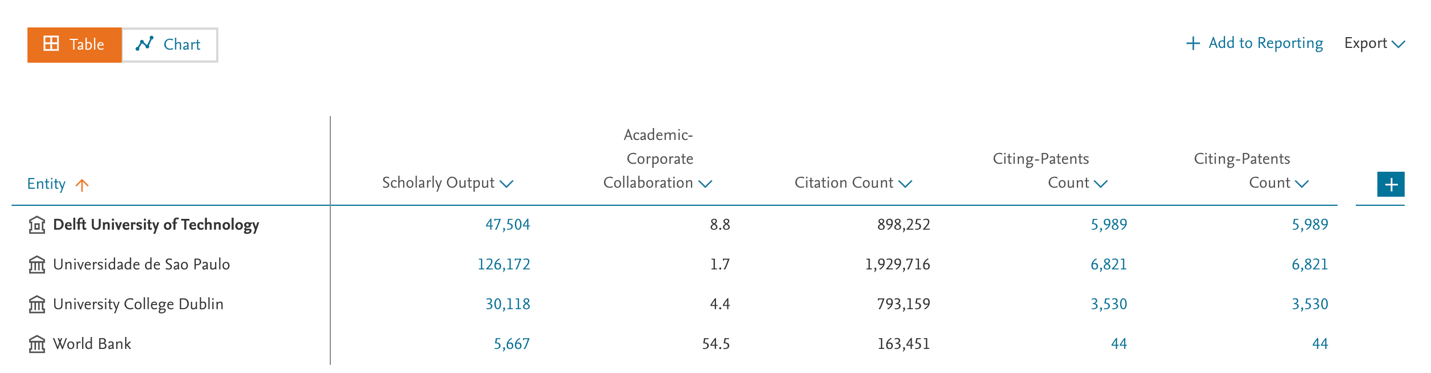
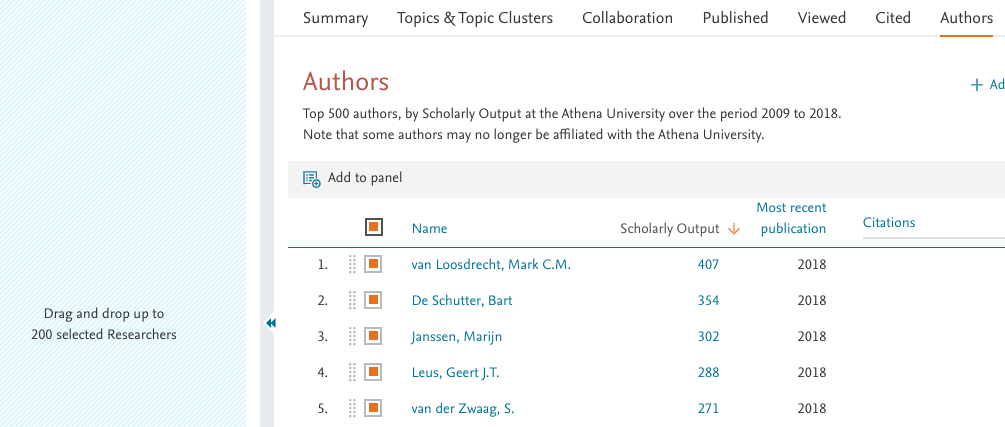
- Add 200 authors in one go to your left panel
There is now an option to select all authors and drag up to 200 to the entity panel on the left.
- Maps from the Trends module can now be added to Reporting
To further enhance your reports, you can now add maps from the Trends module to Reporting.
The November 19, 2019 release brings journal quartile analyses to SciVal
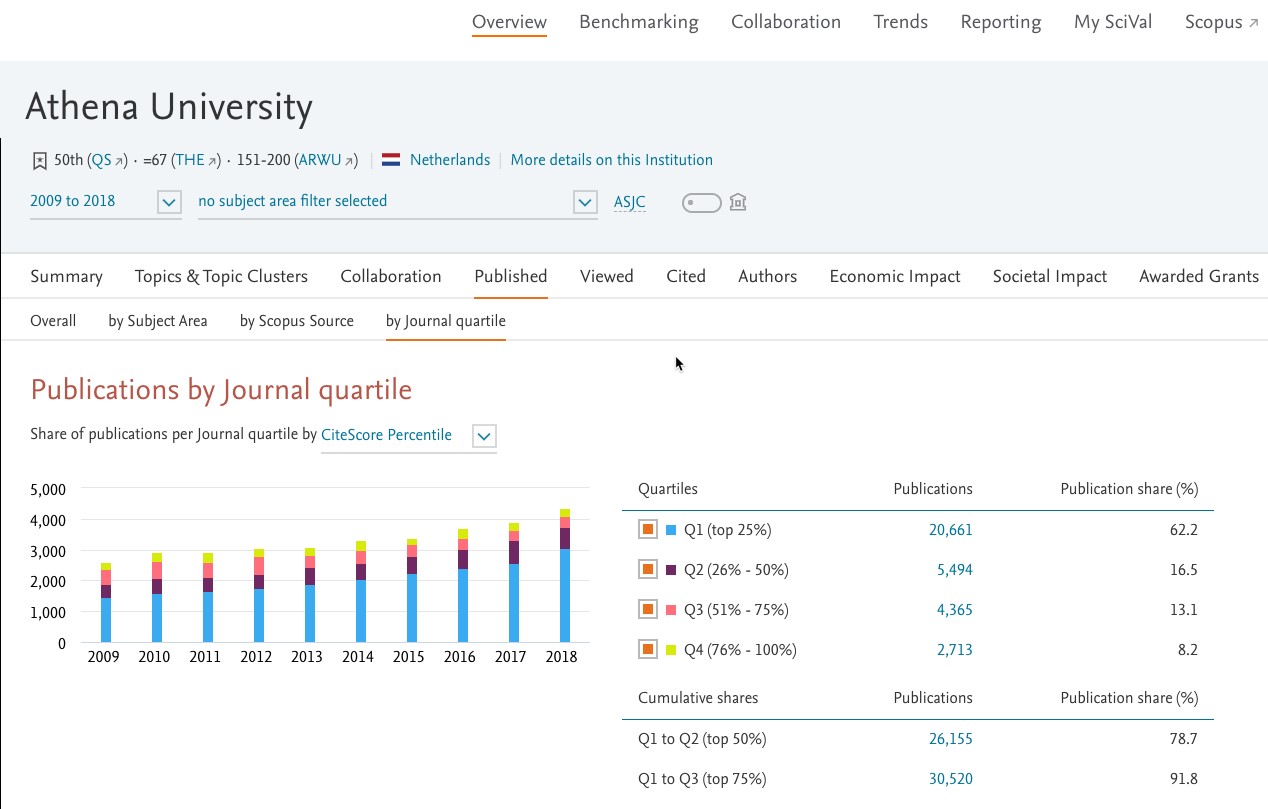
- Get an overview of journal citation impact with the journal quartile breakdown.
In the Overview and Benchmarking modules you can now see the journal CiteScore, SNIP and SJR quartile values for any entity. Create a Publication Set from the quartiles of interest to analyze them in more detail.
Please note that the total scholarly output may not be the same as the total publications in the journal quartiles tab. This is because not all publications belong to titles that have journal metrics.
- Customer endorsed Reporting Template.
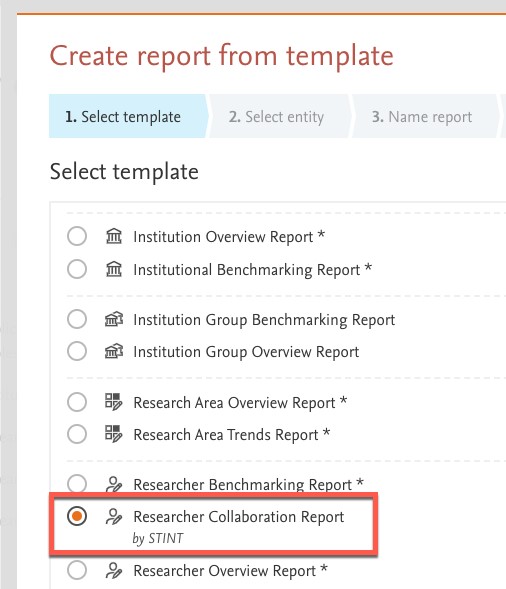
We have our first customer endorsed Reporting Template. This template, which can be found with the other templates, is used by the Swedish Foundation for International Cooperation in Research and Higher Education (STINT), when evaluating researcher collaboration.
- Additional Reporting Template updates.
- We've added metrics guidance to the top 10 used Reporting Templates. Include them in your next report to give your users more context about the metrics.
- You can now use multiple entity types in the benchmarking Report Templates, so for example, you can benchmark a researcher against a group of researchers.
- Modify an existing Publication Set
You can now easily add and remove documents to an existing Publication Set. If you’ve created a Publication Set using the Researcher(s) function, you can only add or remove publications from those Researcher(s). Publication Sets created using the import option can have any publications added and removed. If the Publication Set is larger than 5,000 documents, it can take up to 6 hours to recalculate.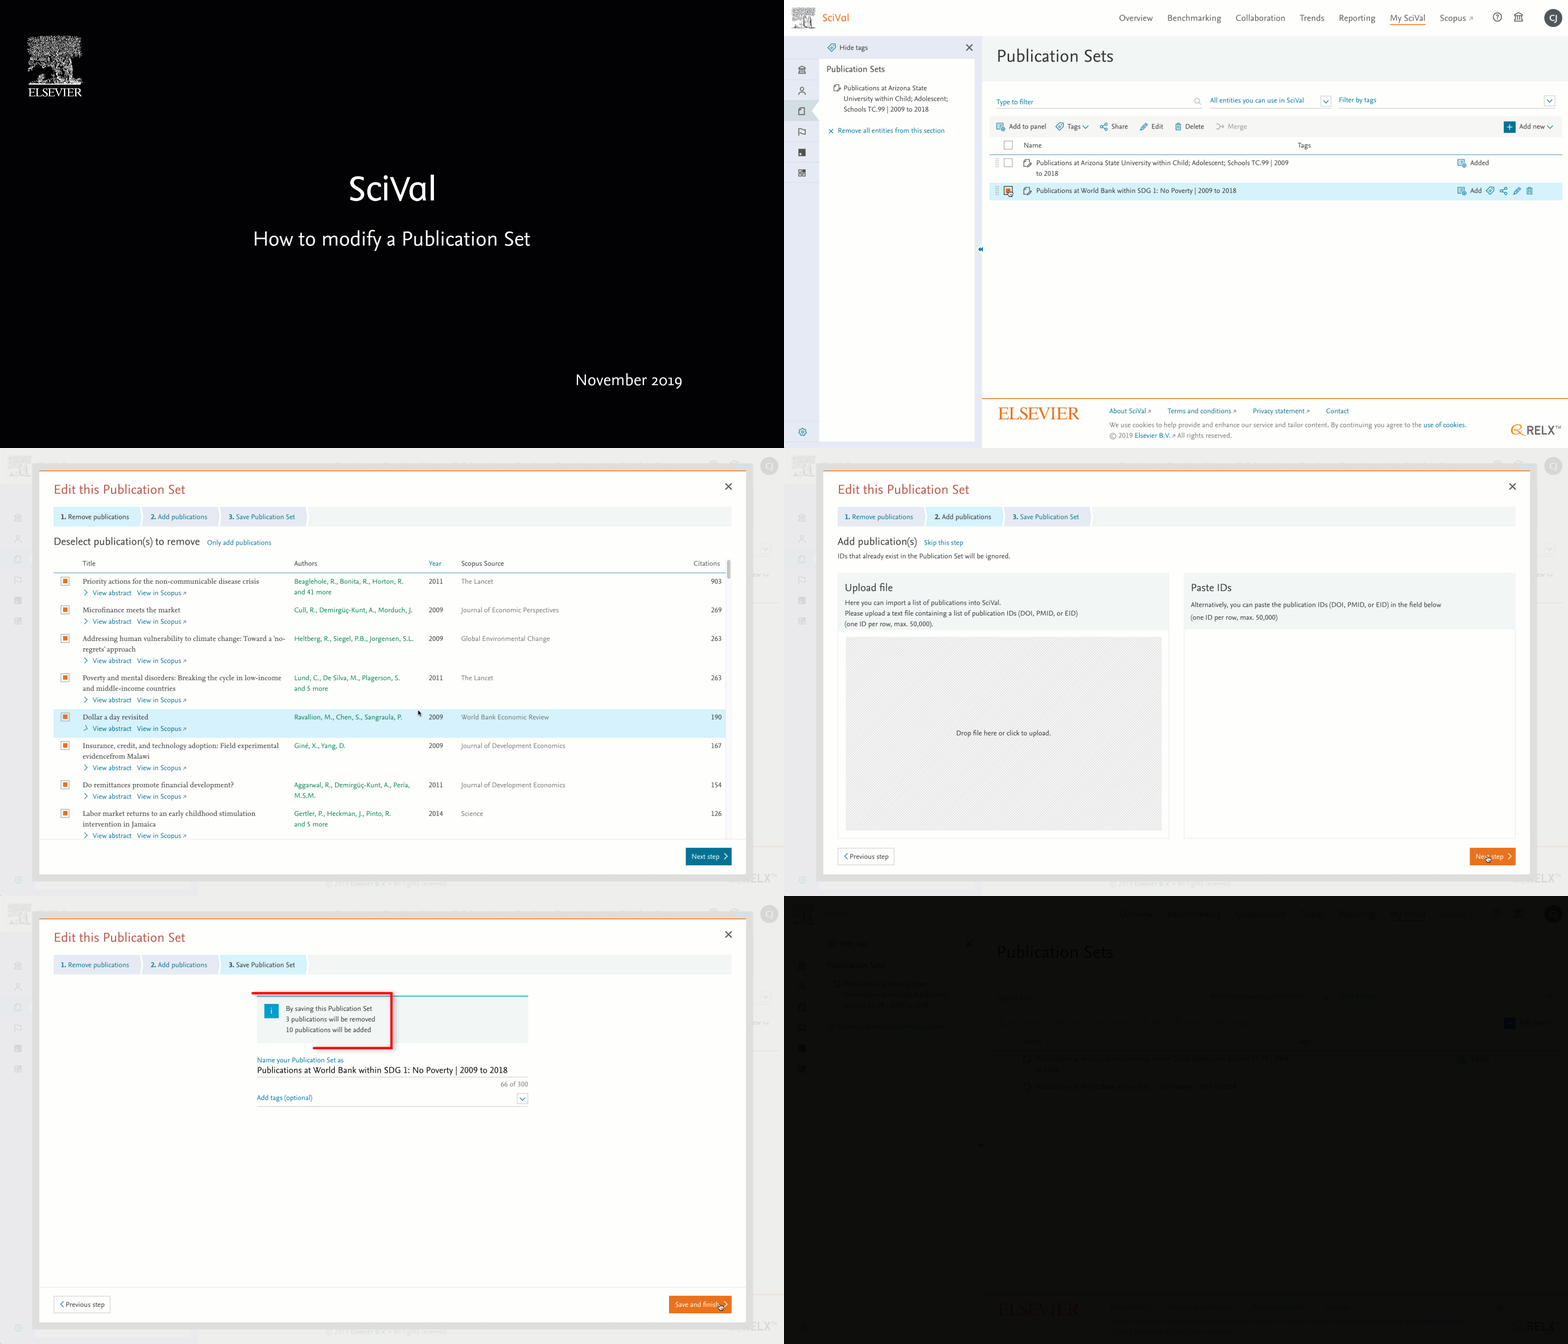
- Use tags to add extra information to researchers in a hierarchy.
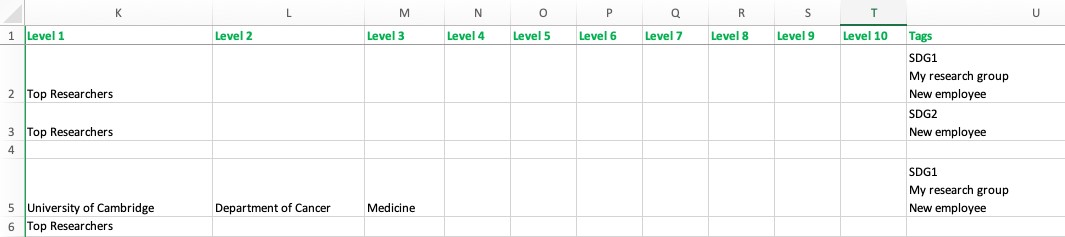
When uploading or syncing a hierarchy of researchers, you can now use the spreadsheet to quickly add tags to some or all of the researchers in one go. Tags can be used to identify the groups a researcher belongs to when viewing them in the left-hand selection panel, or to give additional information such as their status within the institution.
Note: Tags included as part of an import file will be added to any existing tags in the hierarchy. Tags in a synchronize file will replace any existing tags.
- Institution ID now part of export file.
When exporting institution information, the SciVal institution ID is now included in the export, along with the institution name, making it easier to look up against.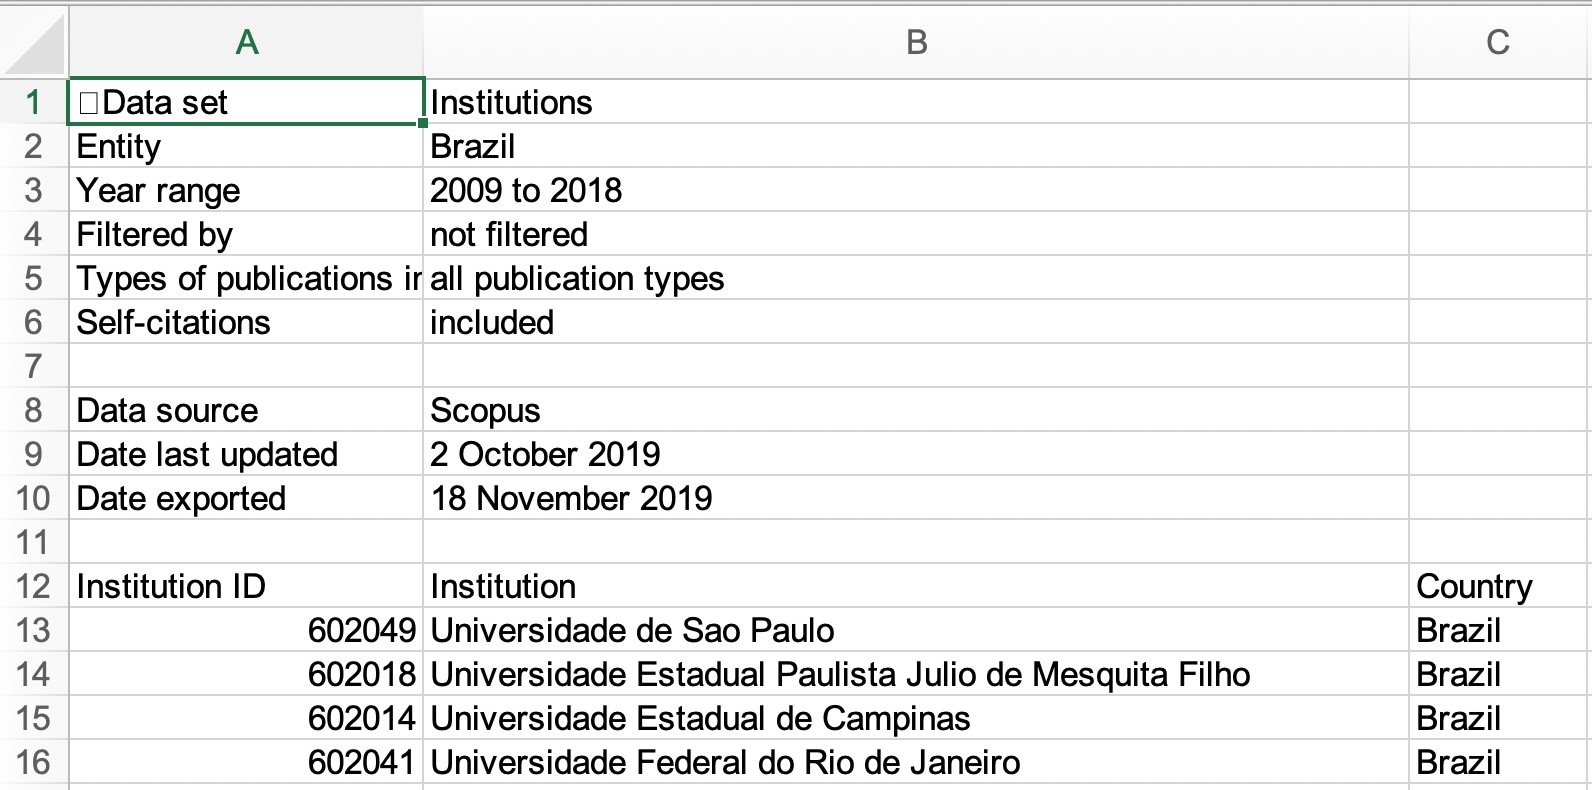
The October 22, 2019 release brings the SDG (Sustainable Development Goals) queries to SciVal:
- Pre-defined Research Areas for the UN SDGs help profile each field globally. Starting in 2017, the Analytical Services and Data Science teams have worked with the global community to specify search queries to represent each of the UN SDGs. In 2018 the initial versions were used to support our partnership with THE and their University Impact Rankings by SDGsopens in new tab/window. Following significant rounds of refinement using the SDG targets and indicators, updated search strings have been used to create pre-defined Research Areas in SciVal. Available by October 24th, these Research Areas can help you understand the work being conducted globally to support the Sustainable Development Goals.
The Scopus search queries, along with a word document explaining the search query rationale for each SDGopens in new tab/window, can be downloaded via Mendeley. We are also actively seeking feedback from the research community on how to further refine the searches and documents related to each SDG. There will be more information on this once the feedback mechanisms have been put in place.
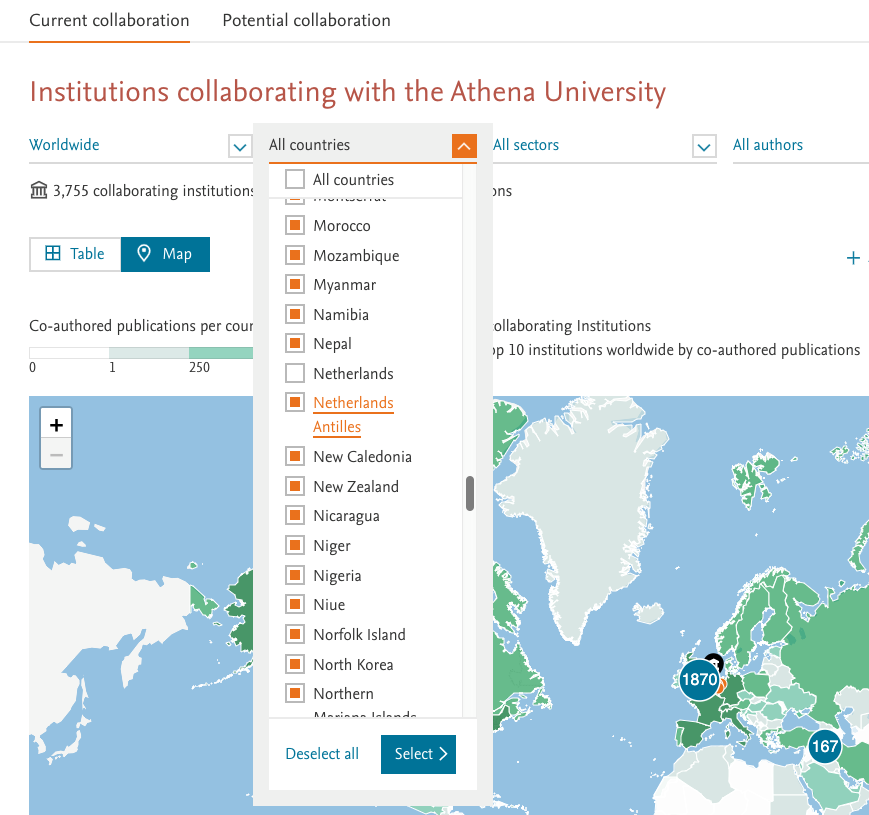
- Country refinement options in Collaboration Module. You can now refine the Collaboration Module analysis to focus on one or more key countries of interest. For example, you can exclude your home country from analyses or explore collaborative links with a selection of strategic countries of importance.
- Streamlined data processing reduces data delay with Scopus from four weeks to two. We have streamlined the ingestion of Scopus data, reducing the processing time for each weekly update from four weeks to two. This means the analyses in SciVal more closely aligned with the live Scopus data.
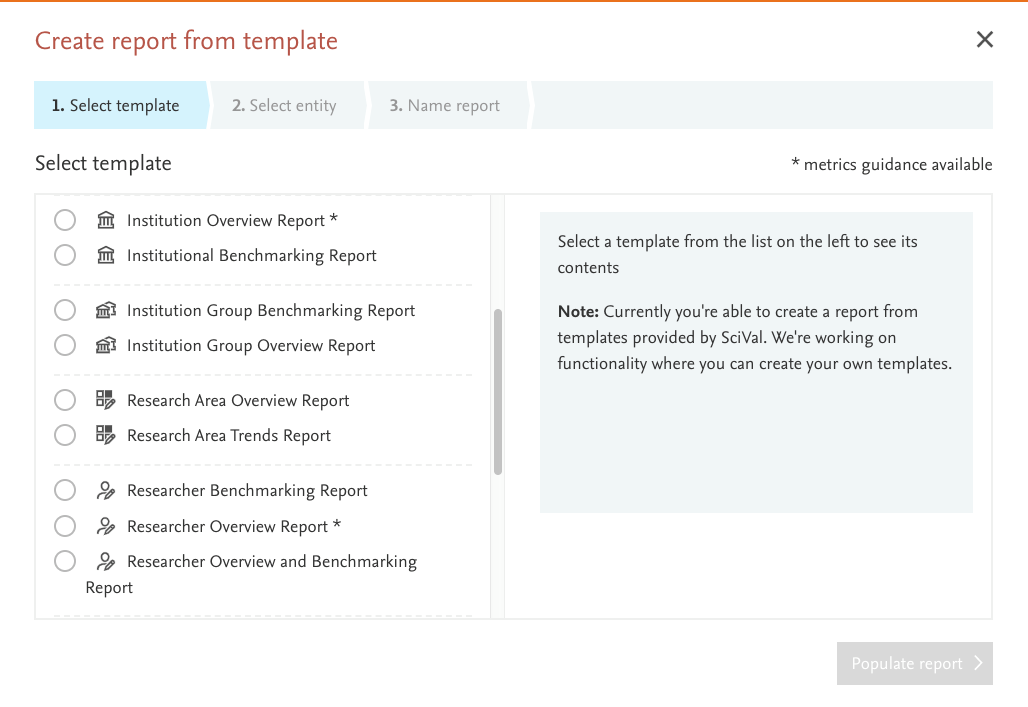
- Reporting Templates for all entities. We have updated the Reporting Templates so they are available for all entities. We have also organized them in recognizable groups, so they are easier to navigate and identify, as well as adding a ‘flag’ to identify templates where metrics guidance has been incorporated.
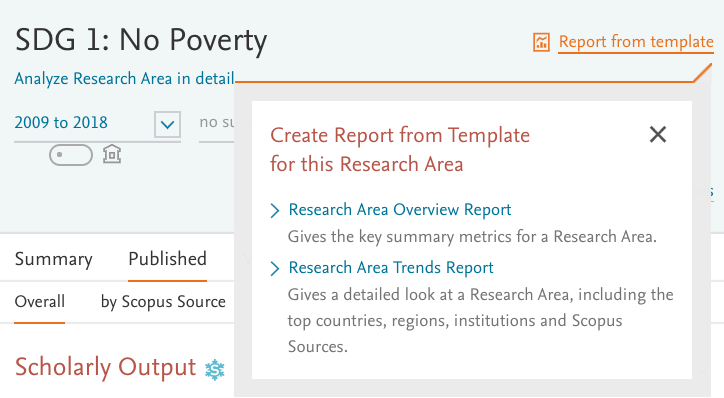
- Instant report from Template update. The instant report from Template link, which is available on the header of the Overview module summary page, is now available for all entities that have a Reporting Template.
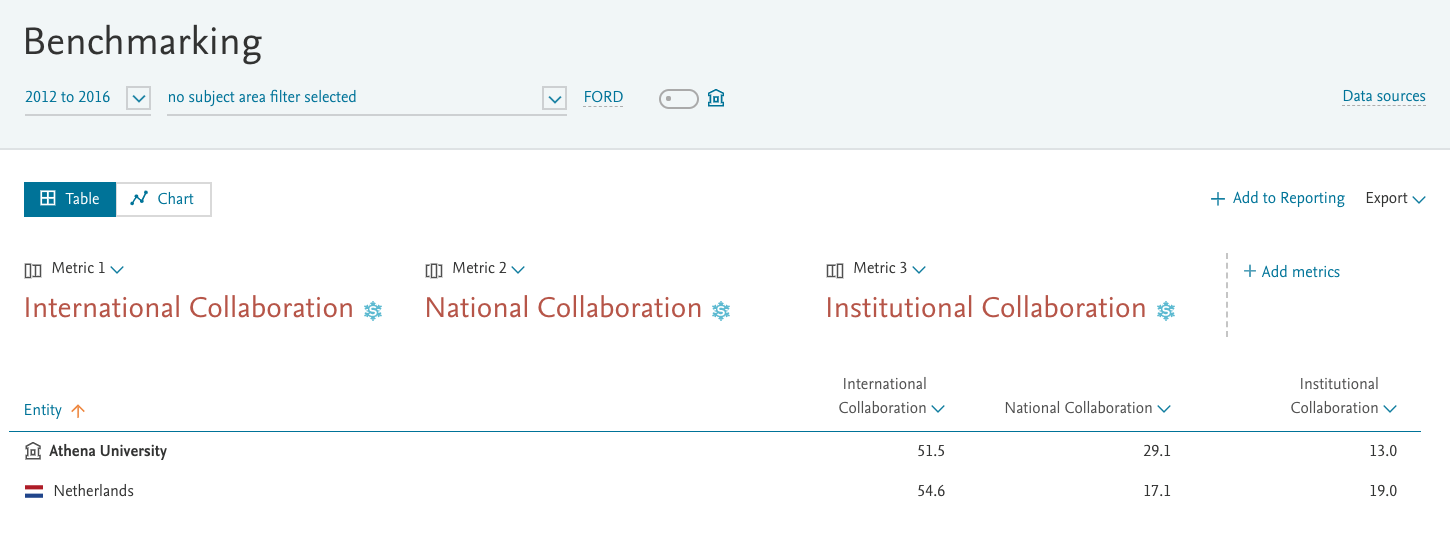
- FOR and FOS subject classification update. Both the FOR and FOS classifications have been updated to the most recent versions. The FOS classification has been updated to FORD which is the new OECD classification system. There were four areas within the previous FOS classification where we had little or no content (e.g. nanotechnology), but through a journal to category mapping, as opposed to ASJC to category mapping this, is no longer the case. Download the latest mappingopens in new tab/window.
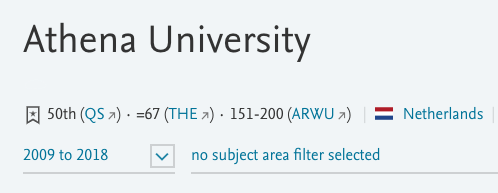
Note: The FOR mapping will be updated on SciVal roughly a week after the release. - Rankings update. We have updated the THE and Shanghai rankings on the top banner for each institution in Overview, to reflect the 2019 rankings.
- Improved metrics labelling in Benchmarking. We have improved the labelling of selected metrics in the Benchmarking module, to reflect the choice options in the Chart or Table views. For example, when you select a Collaboration metric and choose international, the label will now state clearly International Collaboration (previously it just said Collaboration).
- Tagging improved workflow. It is now be possible to check a selection box when tagging entities to specify whether the top level only is tagged and not the ‘children’.
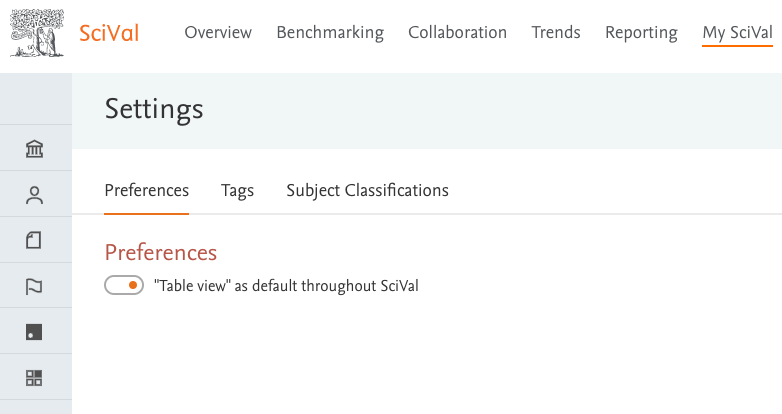
- Set table as default view. Within the settings of My SciVal, you now have a preferences tab where you can choose to have the default view throughout SciVal as the Table rather than Chart or Map. Moving forward we will build on this to add further preferences options.
The September 10, 2019 release brings new visualization options to SciVal.
- New visualization options in the Overview module. Starting with the Overview module, you will now be able to choose the visualization that works best for you. Choose from a tree map, donut, or the existing pie and bar charts. The new options are available in the Summary as well as the by Subject Area section within the Published tab of the Overview module.

- Chart labels for all entities in Benchmarking module. Emphasize the key entities of interest by adding labels to them on the Benchmarking chart. Labels displayed on the Chart are also transferred to any Reports generated. Click either on the entities on the chart or the labels to the right, to display the labels.

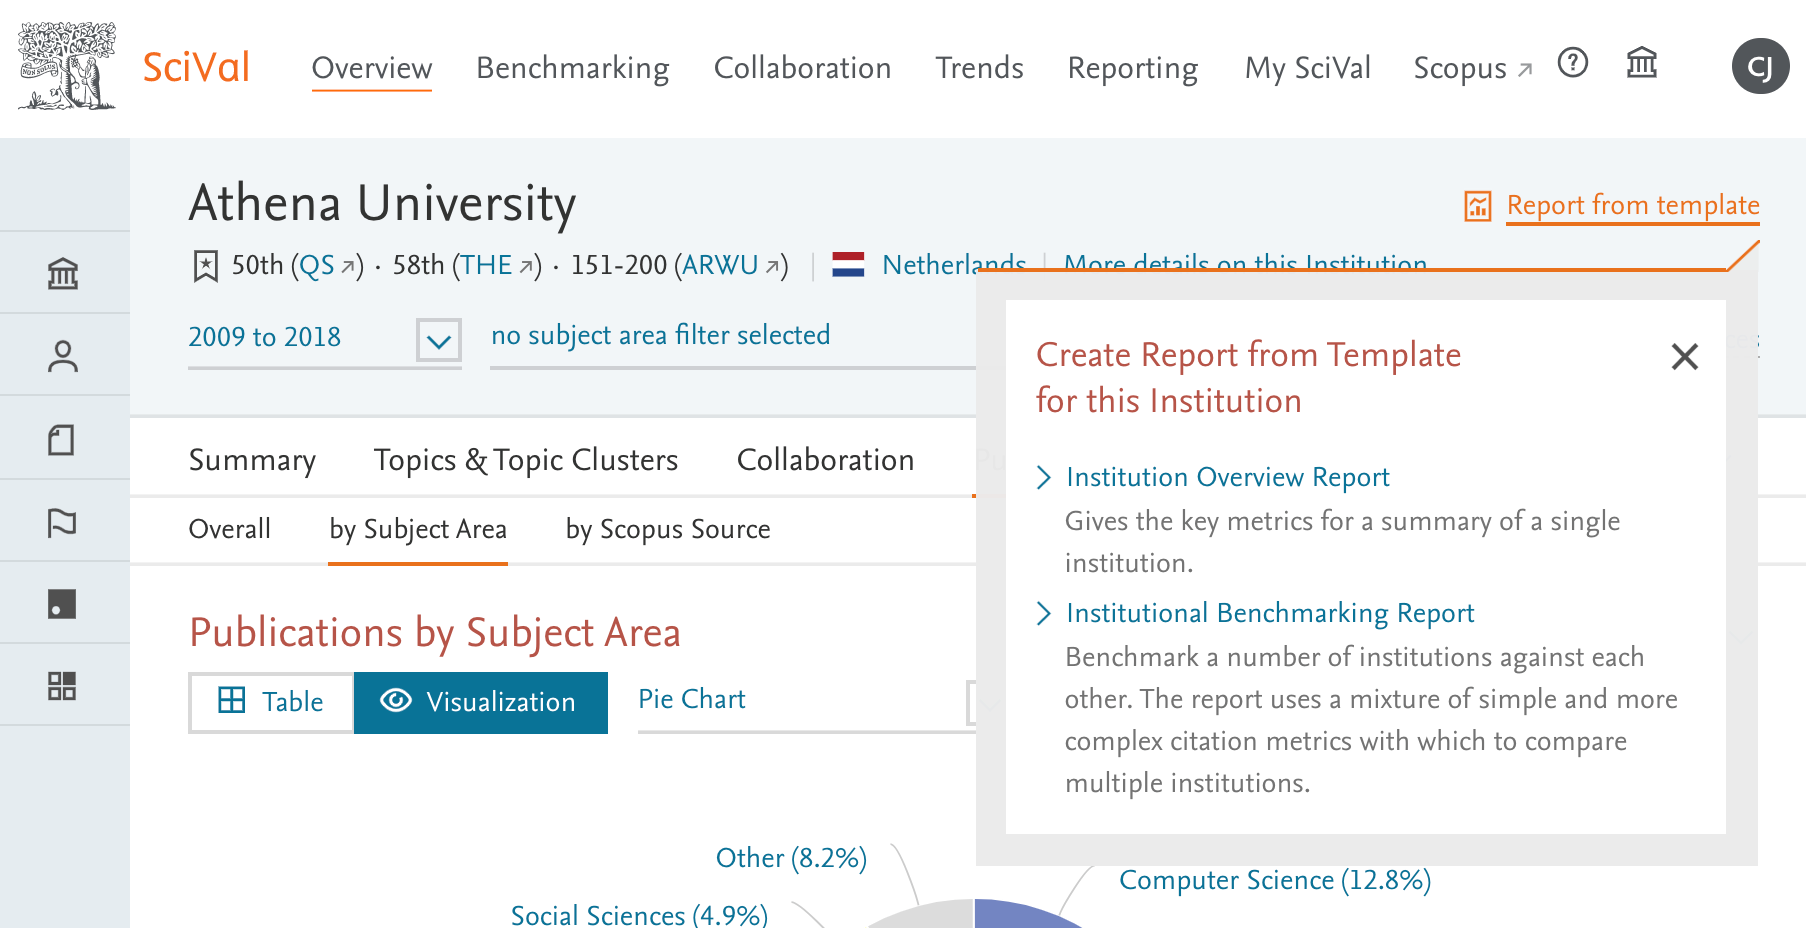
- Institution Reporting Template update. Get an instant Overview, or Benchmarking report of key metrics for the institution you're looking at in Overview. You can now create an institution report directly from the institution’s header in the Overview module. The chosen institution at will be pre-selected allowing you to produce an Overview or Benchmarking report within a few clicks.
- QS ranking update. Since our last update, we have received the details for 2 categories that have been missing in SciVal. “Mining Engineering” and “Social Policy & Administration” have been added and we’ve adjusted the names of 4 other areas to match the QS site more closely. Learn moreopens in new tab/window.
The August 13, 2019 release brings Topics for Publication Sets and additional Reporting templates.
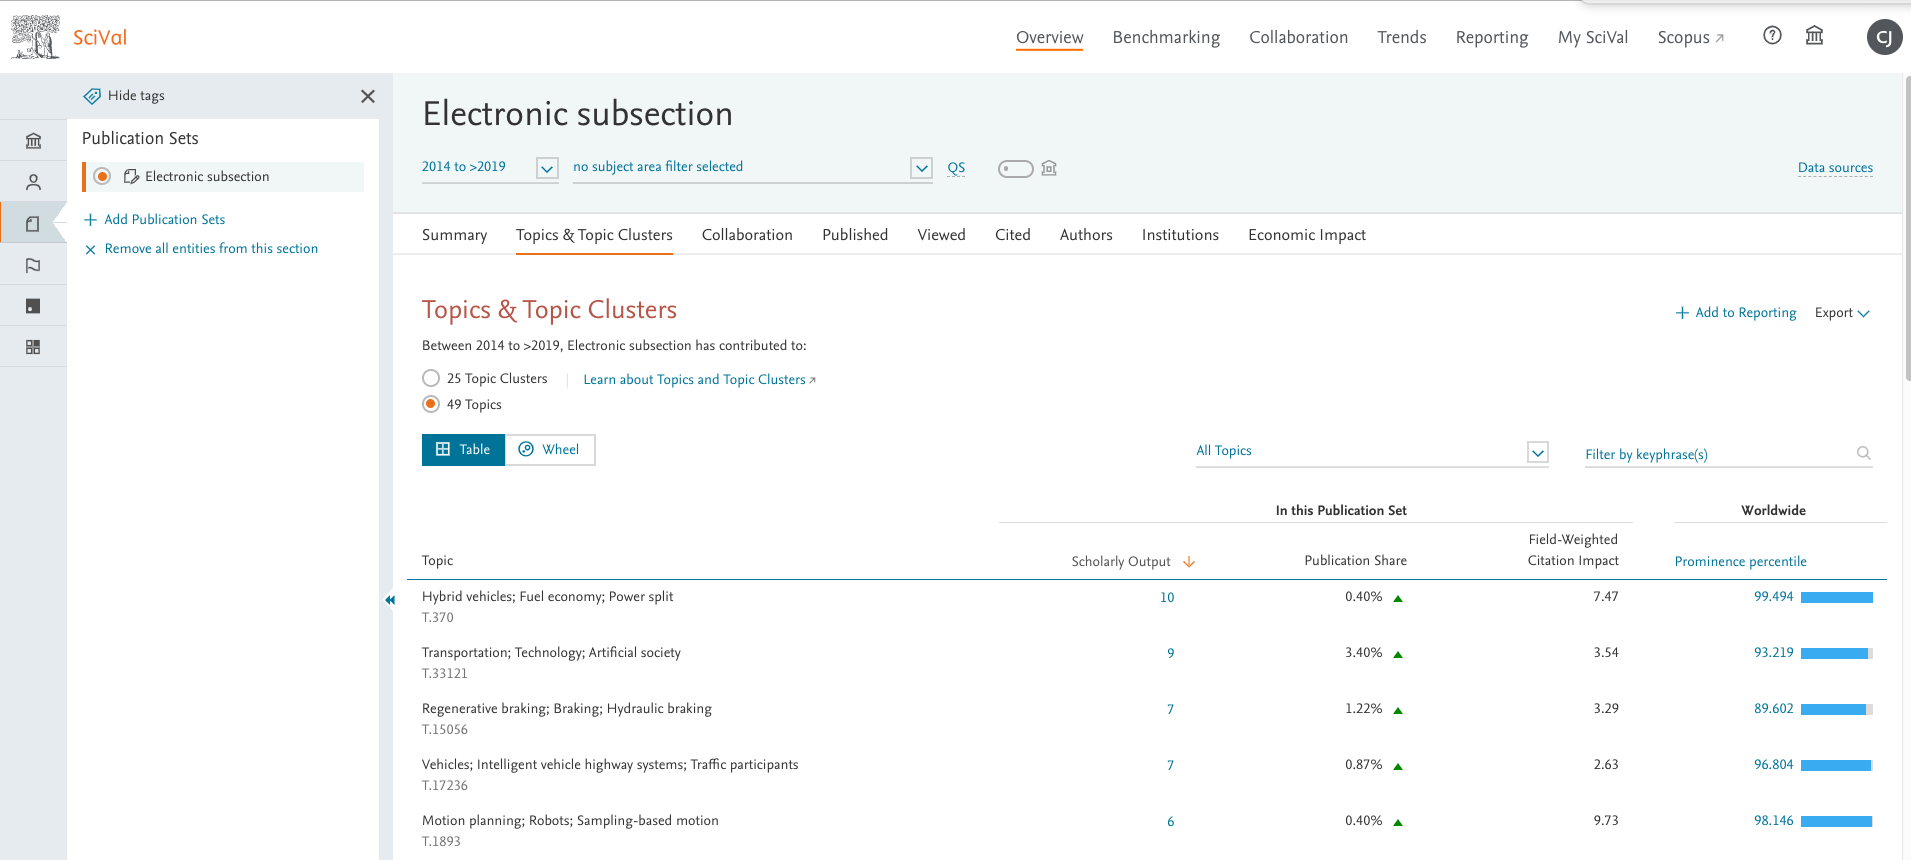
- Topics for Publication Sets. When looking at any Publication Set in the Overview module, you can now see the Topics to which they have contributed, along with their impact.
- Additional Reporting templates. In the Zeeman release we launched the first iteration of Reporting Templates. These allowed you to quickly gain a balanced research metrics overview of an institution, researcher and Topic via 7 Reporting templates. In this release we’ve expanded the templates to include Groups of Researchers, Research Areas, Publication Sets and Countries. Learn more about Reporting templates.opens in new tab/window
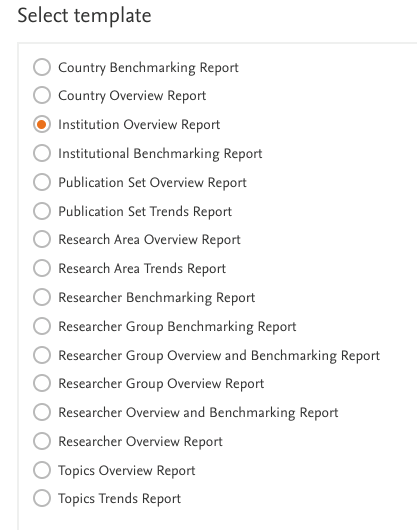
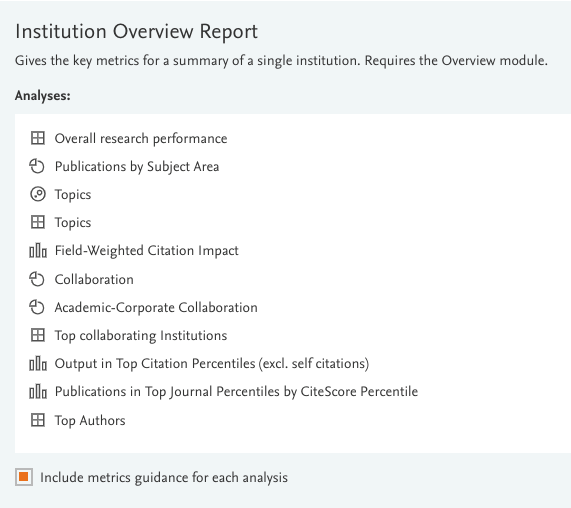
- Metrics guidance in Reporting templates. In the Institutional and Researcher Overview Reporting templates, we have now included optional metrics guidance. Once selected, each analysis in the final Report contains core information about the metrics used, along with some tips on their use.
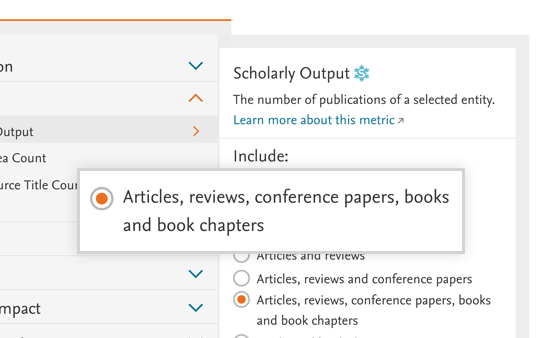
- New publication types analysis option. In Benchmarking, you can now calculate metrics based on 'Articles, Reviews, Conference Papers, Books and Book Chapters', further expanding the ability to assess research activities effectively.
- Reporting enhancements. Save analyses from the Published section (by Scopus Sources, by Subject Area) in Overview to Reporting.
The June 18, 2019 release brings a new 10 year range, along with the yearly rollover.
- Yearly rollover. Each year around this time, the Scopus content for the previous year (i.e. 2018) is around >95% complete. This is the point we consider it a “complete year” and we then roll our pre-defined time ranges in the Overview, Collaboration and Trends modules, forward by one year. The new ranges are used to recalculate the Prominence Percentiles for all Topics and to rename the Topics using the most relevant keyphrases. We also update SciVal to include the latest CiteScore, SNIP and SJR values. Learn more about the yearly rollover.opens in new tab/window
- New 10 year range. We’ve heard from you that a larger year range is required in the Overview, Collaboration and Trends modules, so you can see data trends over a longer period of time. We’ve now added a 10 year range to these modules to give you the flexibility you need.
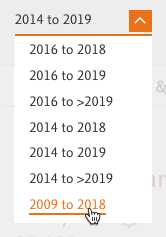
- Quick Publication Set creation. You can now create an instant Publication Set of up to 100k documents from any publication links window in SciVal. This allows you to use filters to quickly dissect entities into a set of key publications for further analysis, without the need to export and import a list of documents.

- Additional funding bodies. Content from 7 new funding bodies helps to broaden the awarded grants analyses in SciVal. Data from the European Union (H2020 & FP7), Canada (NSERC, CIHR, SSHRC & CFI) and Japan (JSPS), adds +430k new awarded grants worth over $120bn, with more coming in future releases.
- Updated map in Trends. The map in the Trends module has been updated to make it easier to read. The circles now contain one metric, which makes them easier to display and cleaner to navigate.
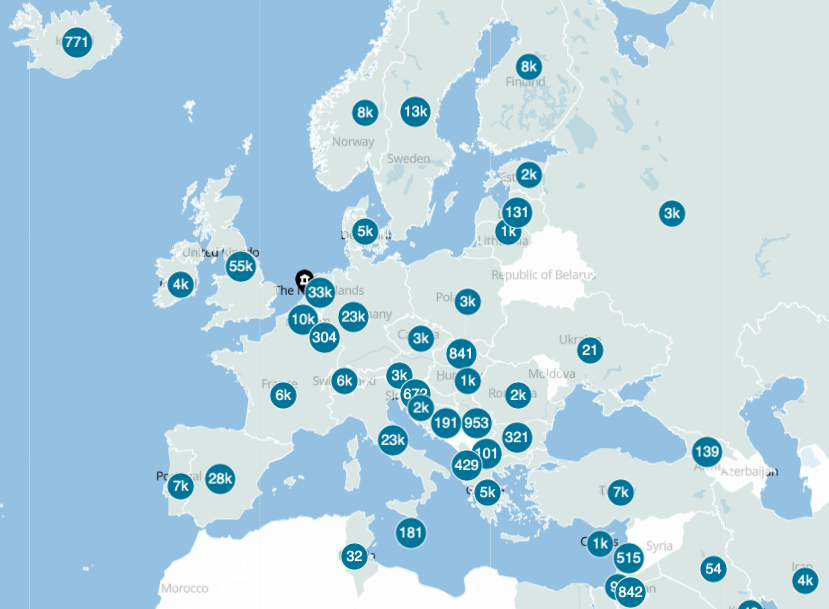
- Reporting enhancements. It’s now possible to add the maps from the Collaboration module to Reporting. This will enhance your reports by giving a quick visualization of the entity’s co-authorship, to complement the table view.
- Updated QS mapping. We have worked with the QS team and improved the accuracy of the QS subject classification mapping, which has replaced the old mapping.
The May 21, 2019 release brings a selection of predefined templates to Reporting
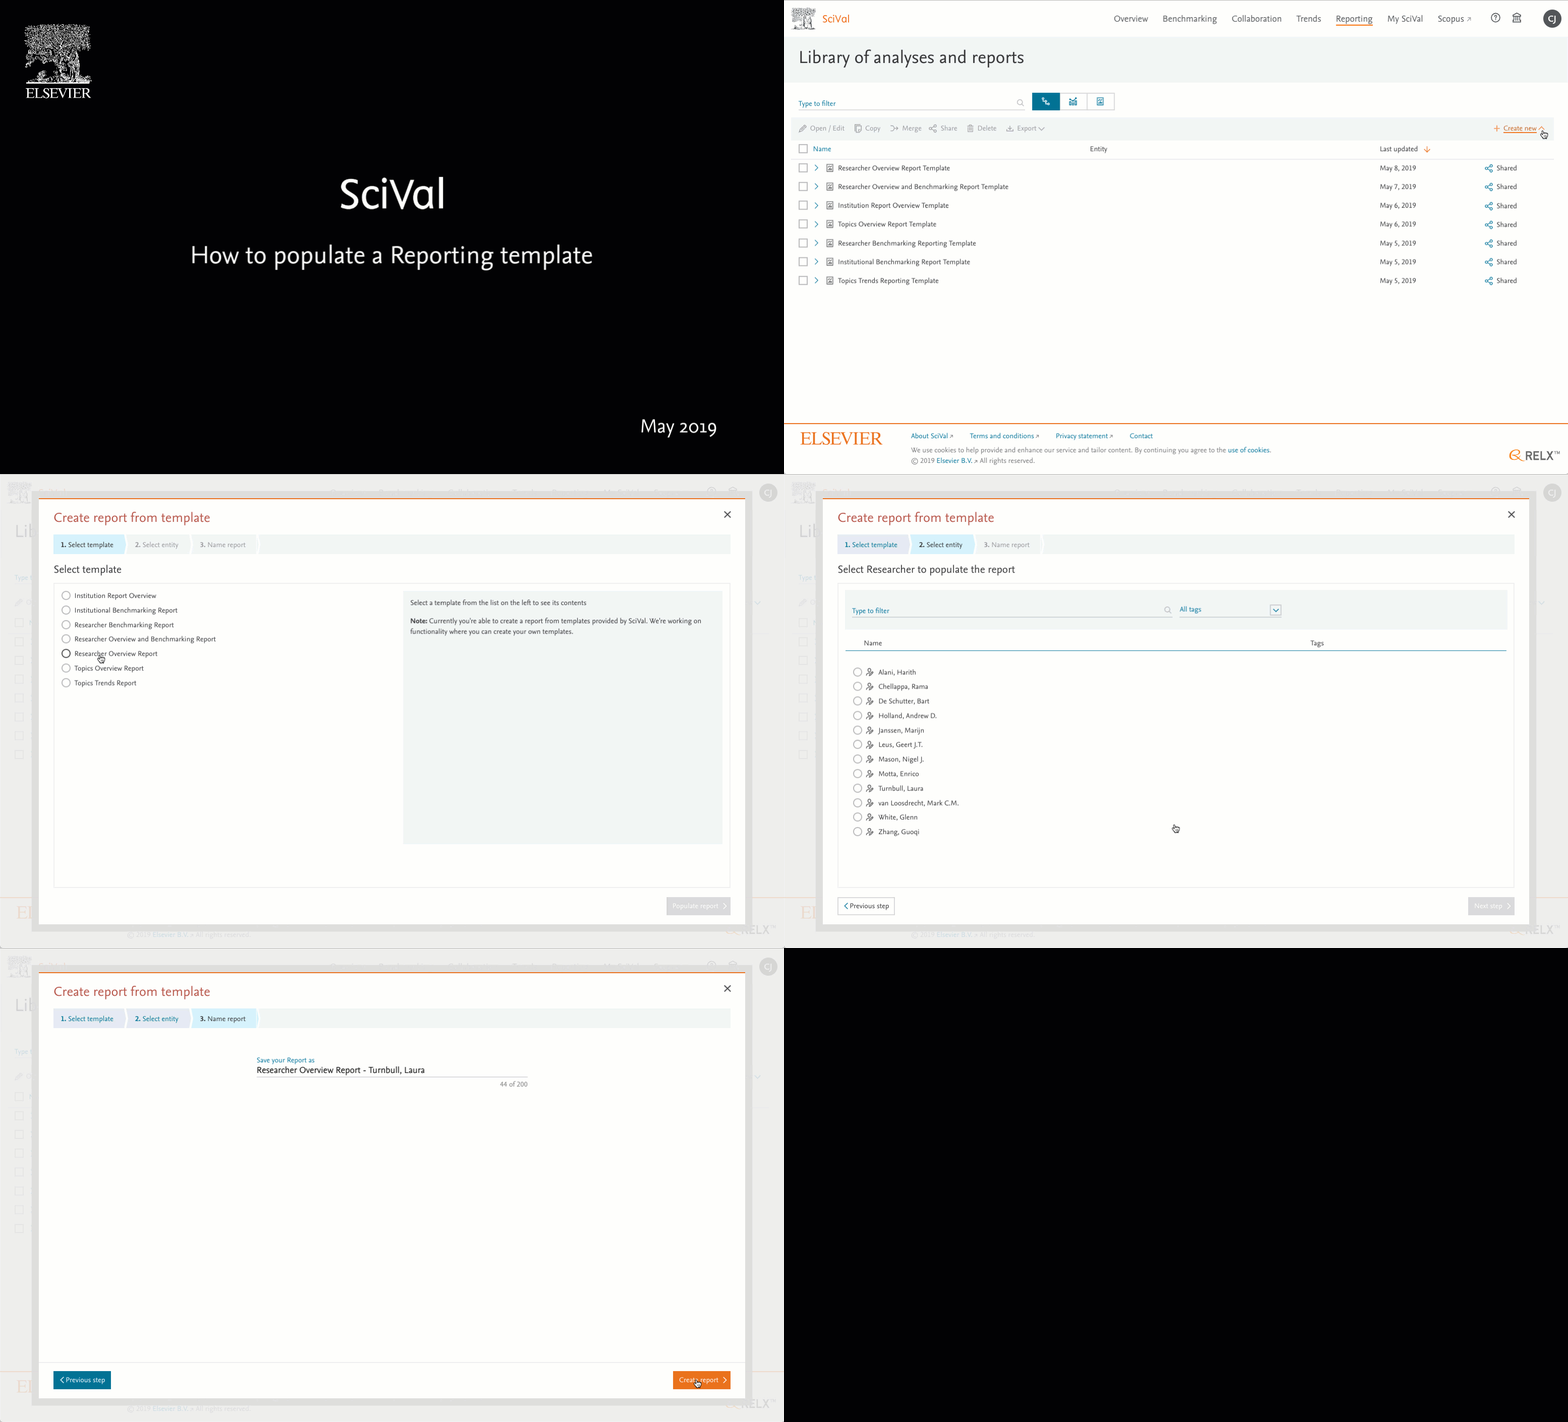
- Reporting Templates. Gain a balanced research metrics overview of an institution, researcher and Topic from one of seven predefined Reporting templates. Each template provides an easy way to get a mix of simple and sophisticated metrics for each entity and allows the user to link directly to the analyses in SciVal. There will be more! In the coming releases, we will develop additional templates, expand the entities that can be used and allow users to create and share their own templates. Learn more about reports and report templates.opens in new tab/window
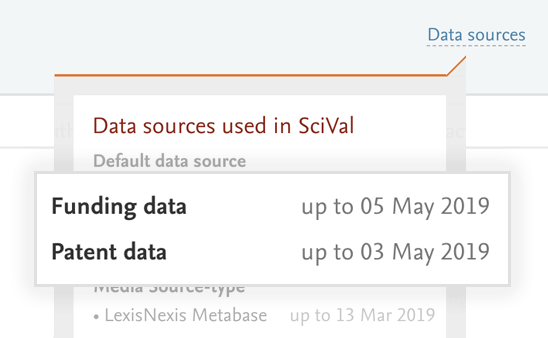
- New patent and funding data. Patent and funding data streams have been refreshed and will be updated more frequently (weekly for funding and monthly for patents), allowing us to provide more current metrics around economic impact and awarded grants.
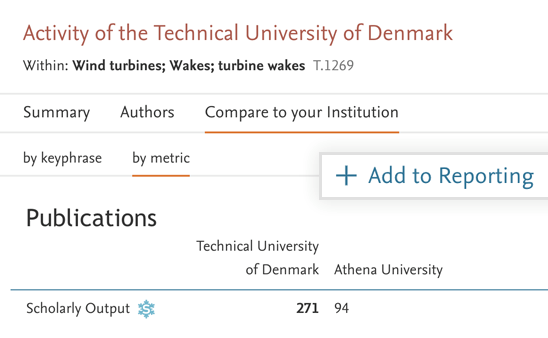
- More Reporting enhancements. New reporting options in the Trends module. On the Institution tab within Trends, you can now add the comparison between any institution and your own institution to Reporting.
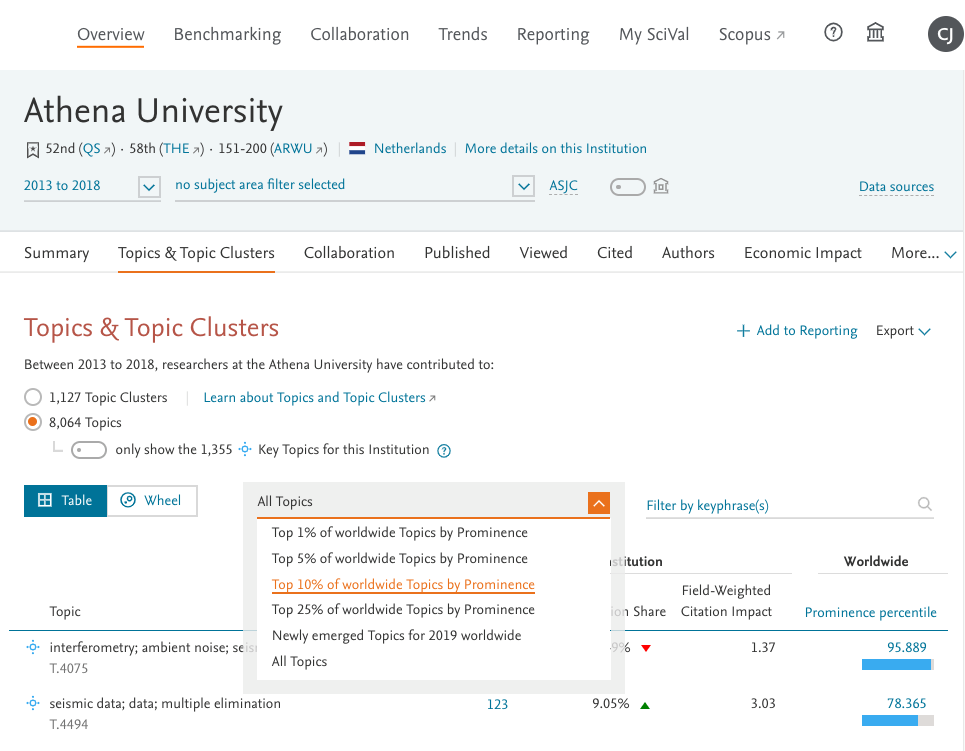
- Topics Prominence Percentile filter. The Prominence Percentile filter is now available for the table view. This gives greater flexibility for users to export only the percentile values in which they are interested, instead of all values.
The April 23, 2019 release brings an improved Topic search:
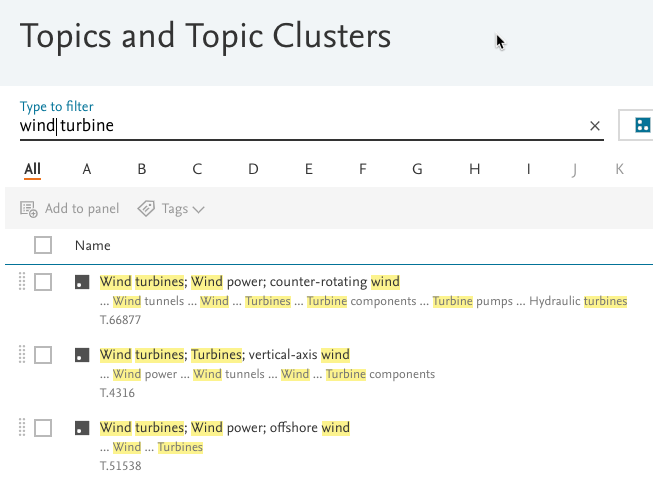
- Improved Topic search. To help increase the visibility of the Topics and Topic Clusters, you can now search over the current names, plus the top 15 keyphrases. Tip: A search for wind turbine finds the words together and separately and any variations i.e. wind/winds/windy. A search with speech marks finds an exact match, i.e. “wind turbine” will only find wind turbine as one keyphrase and nothing else.
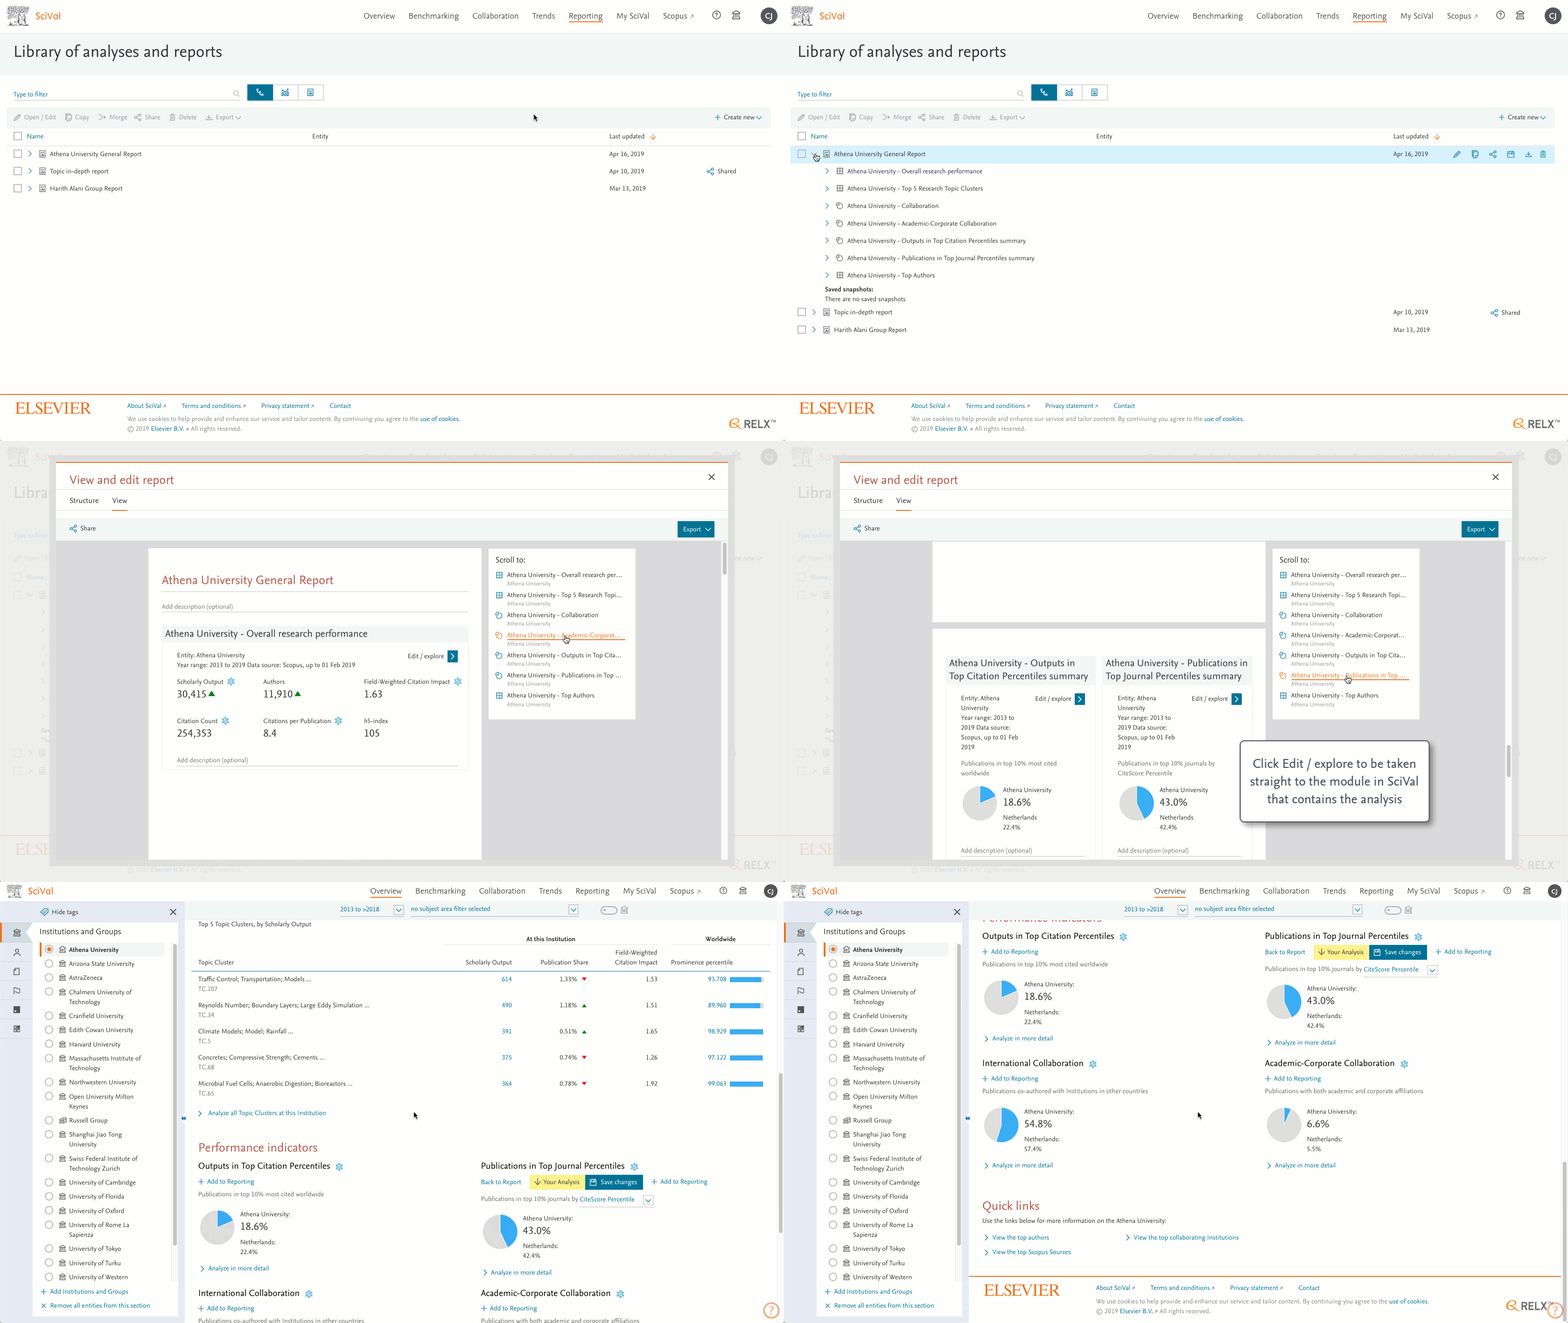
- Reporting enhancements: We've made a number of enhancements within Reporting to help researchers navigate to relevant analyses. A scrollable content page when previewing a report, along with direct links from an analysis in a report to the correct module in SciVal will all help researchers find the analyses in SciVal faster.
Additional enhancements:- You can now also add analyses about an individual country, author or Scopus source from the Trends module to Reporting.
- You can limit the number of authors added to a PDF report to top 5, 10, 20, 50, 100 or 500 (the Excel version will always contain the top 500)
- Publication Sets - Import up to 50k documents. To help when creating large Publication Sets, we've increased the limit when importing document IDs to define one from 20k to 50k. Note: The maximum size of a Publication Set is still 100k and the limit from Scopus is still 20k.
- Improved publication links export. You can now select the ASJC codes, along with the related names as a separate field when exporting publication lists.
The March 26, 2019 release brings with it 37 new Topics. Have you contributed to them?
- Newly emerged Topics for 2019: New Topics represent areas of research that have seen a significant growth acceleration in recently published articles and have attracted recent funding. These new Topics are derived from existing parent Topics and are formed by new citation relationships that have occurred in the past year.
In 2019 we identified and added 37 new Topics to SciVal. Find out if you've contributed to them.opens in new tab/window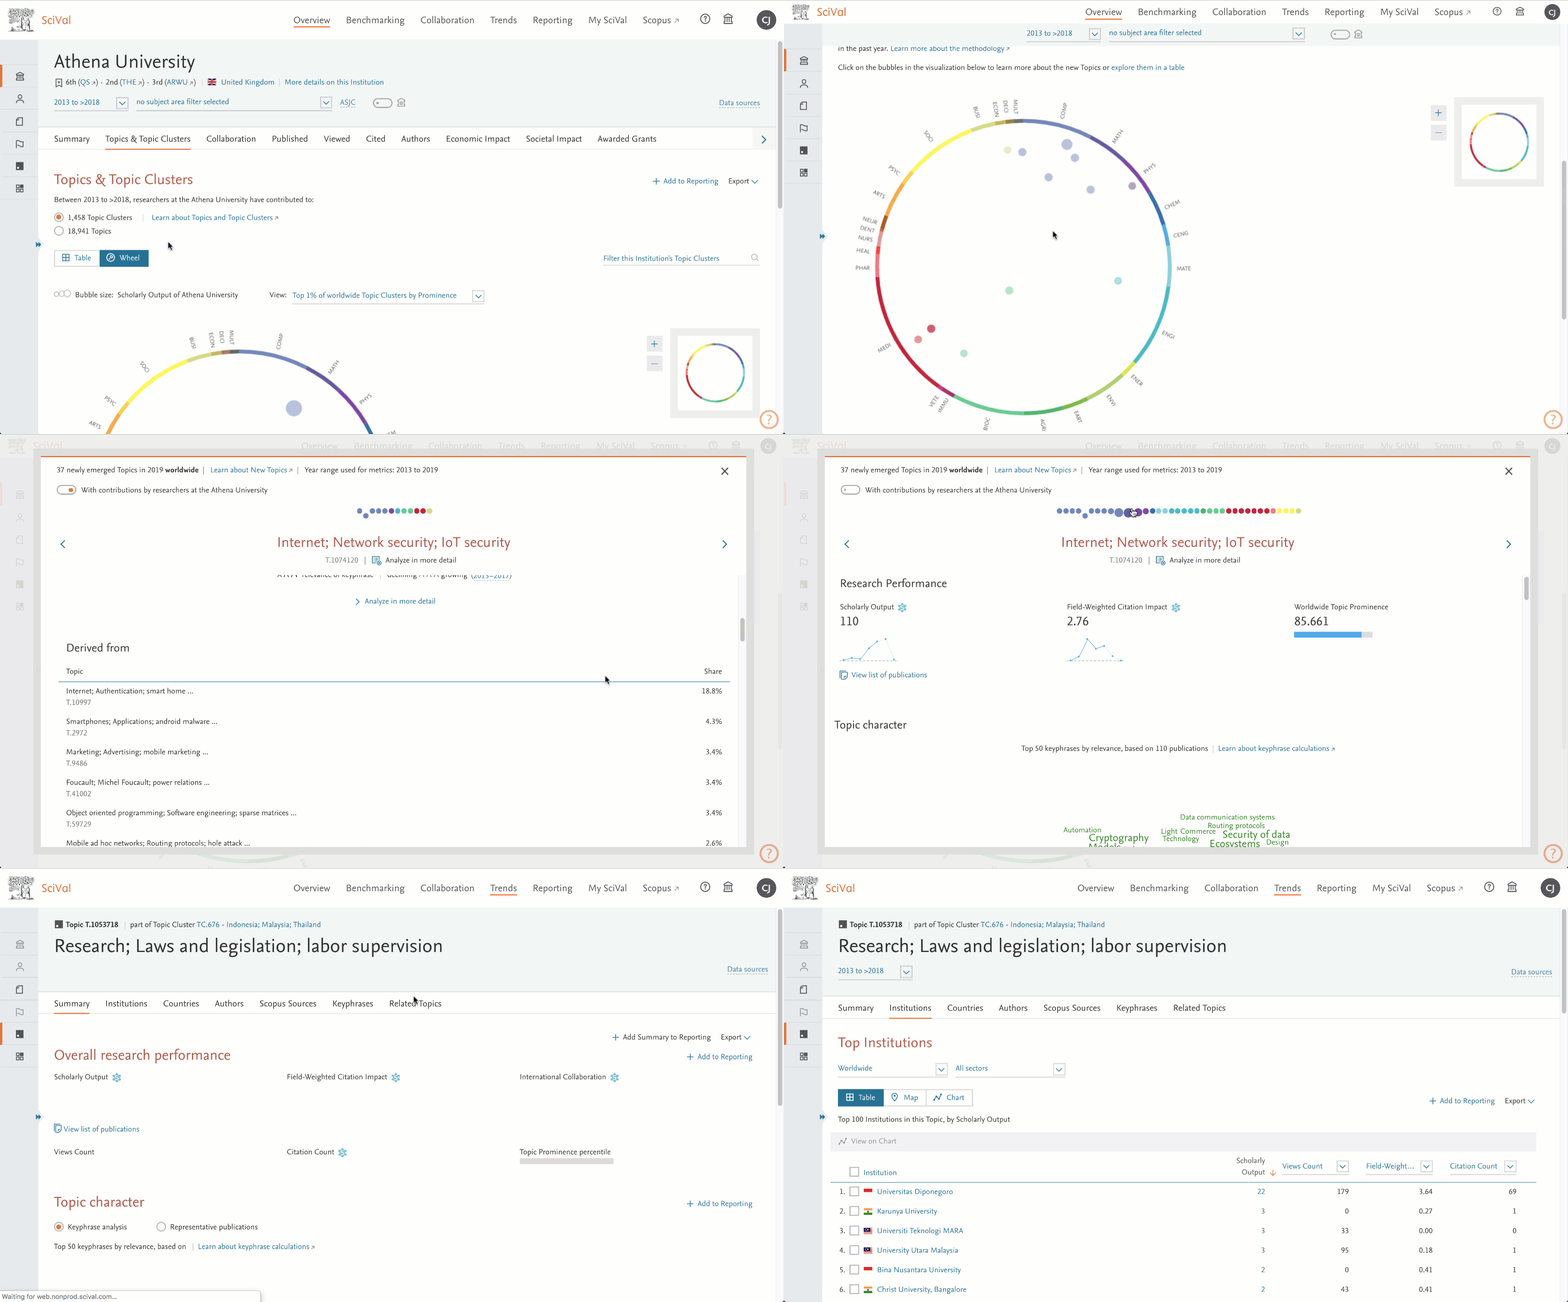
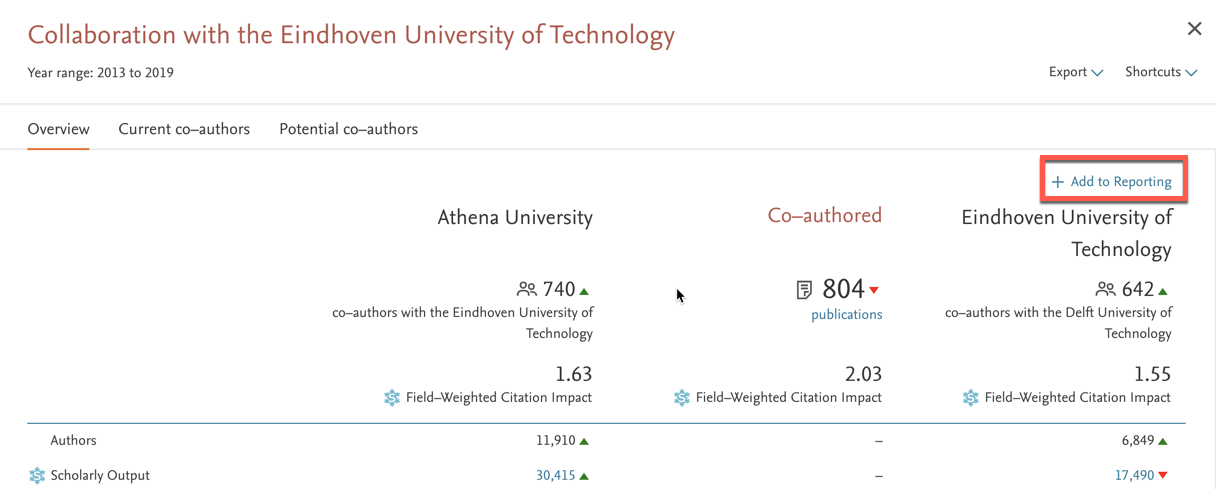
- Reporting enhancements: Broaden your reports with analyses about institutions from both the Collaboration and Trends. Simply click on an institutional name and the '+ Add to Reporting' option is available in the window.
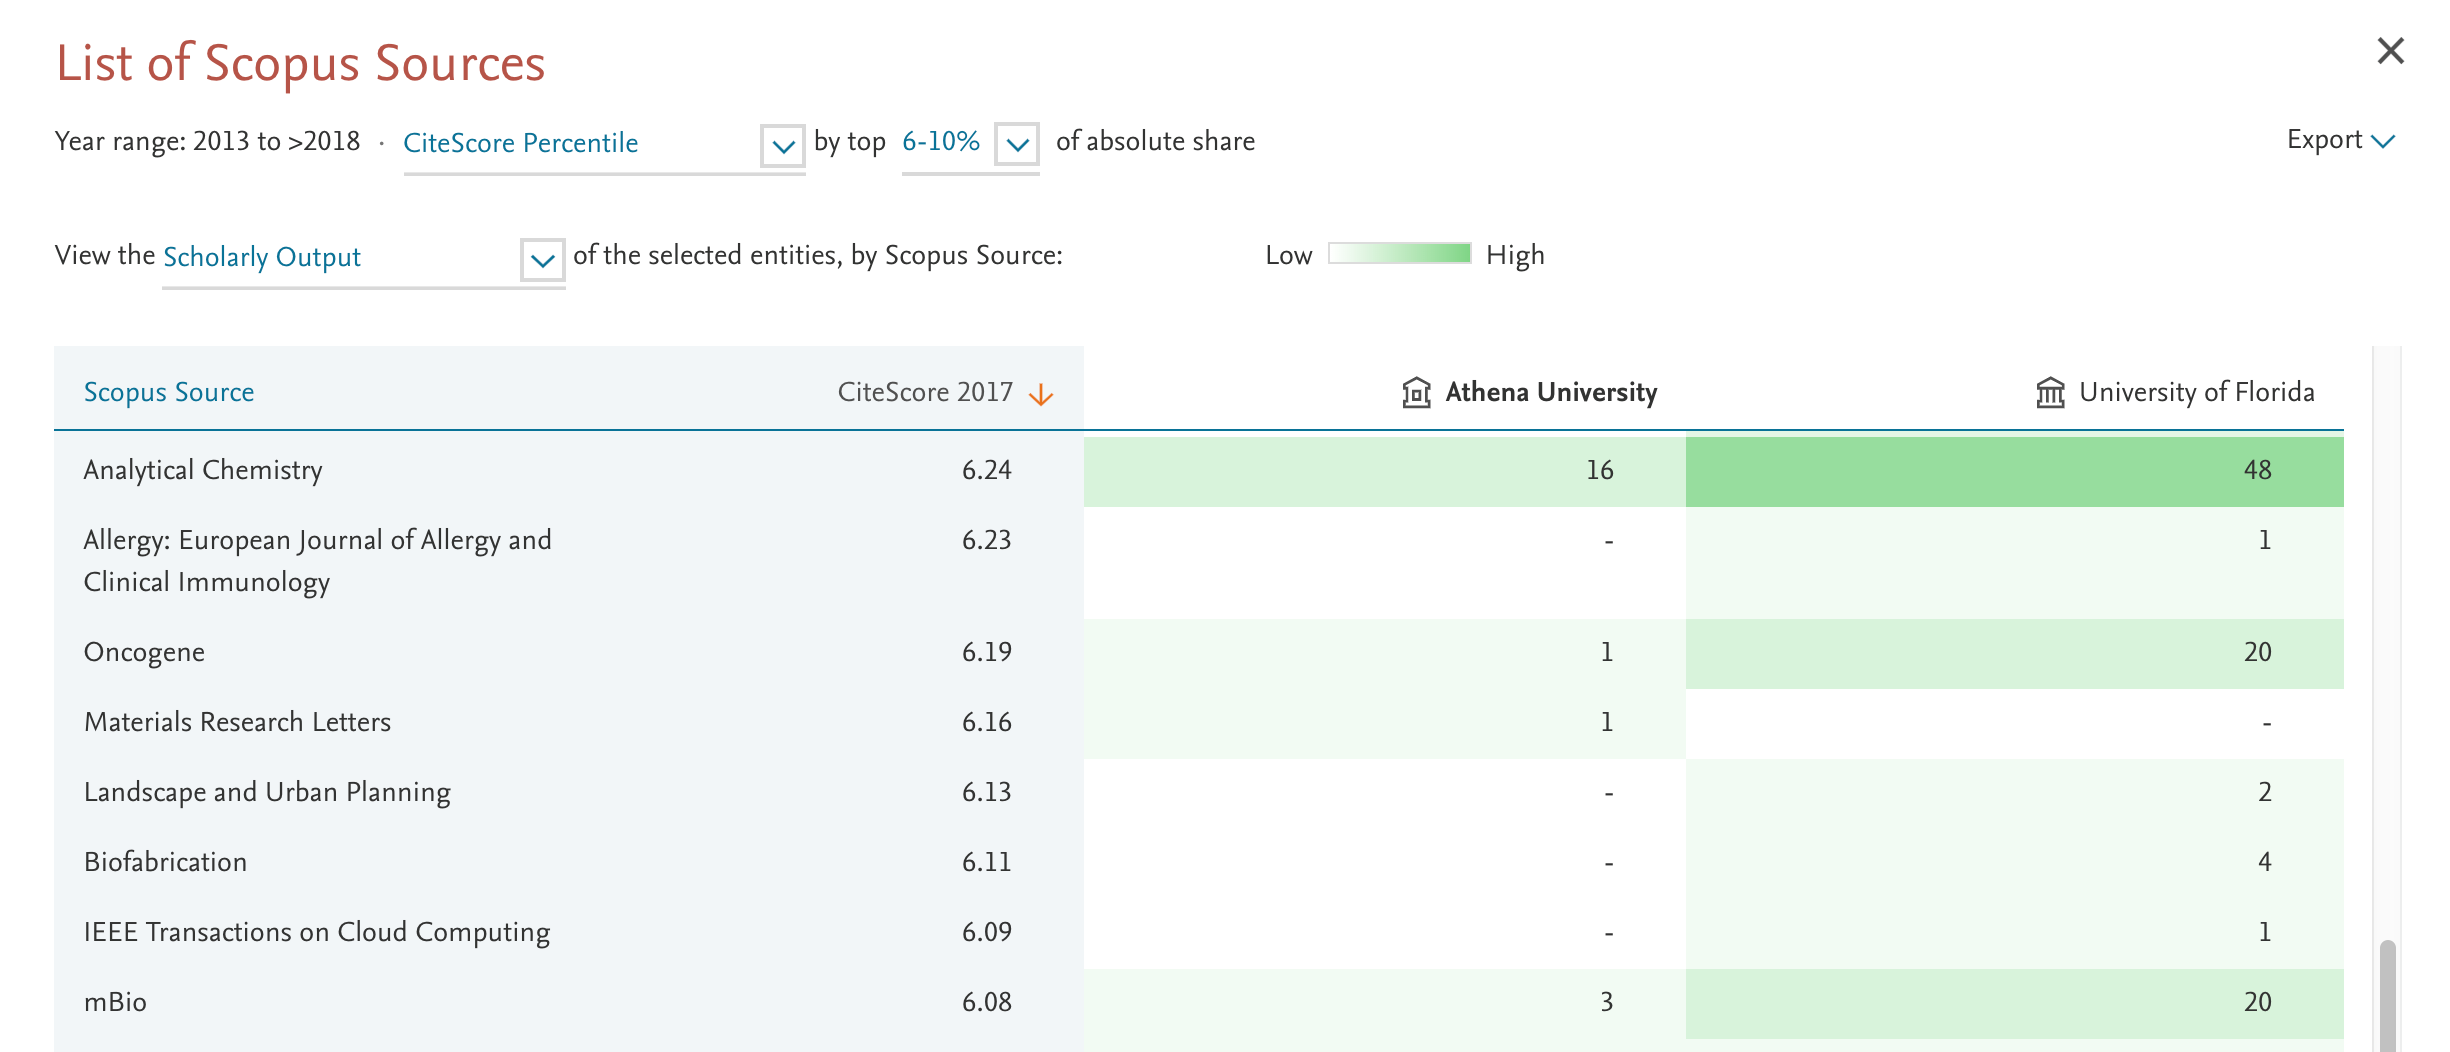
- Heat maps for Scopus sources: Identify outstanding journal performance and compare that performance against a peer institution using heat maps in the Scopus Sources modal. Find it in: Overview – Published – by Scopus Source - View the list of Scopus Sources.
The February 26, 2019 release brings with it a host of Topic related benefits:
- More Topic Prominence updates:
- Export the Topics heat map. When analyzing the Topics of a group of institutions, you can now export the heat map for the top 500 Topics for deeper analysis in Excel.
- New API available! Retrieve all the Topics published by country via the SciVal API.
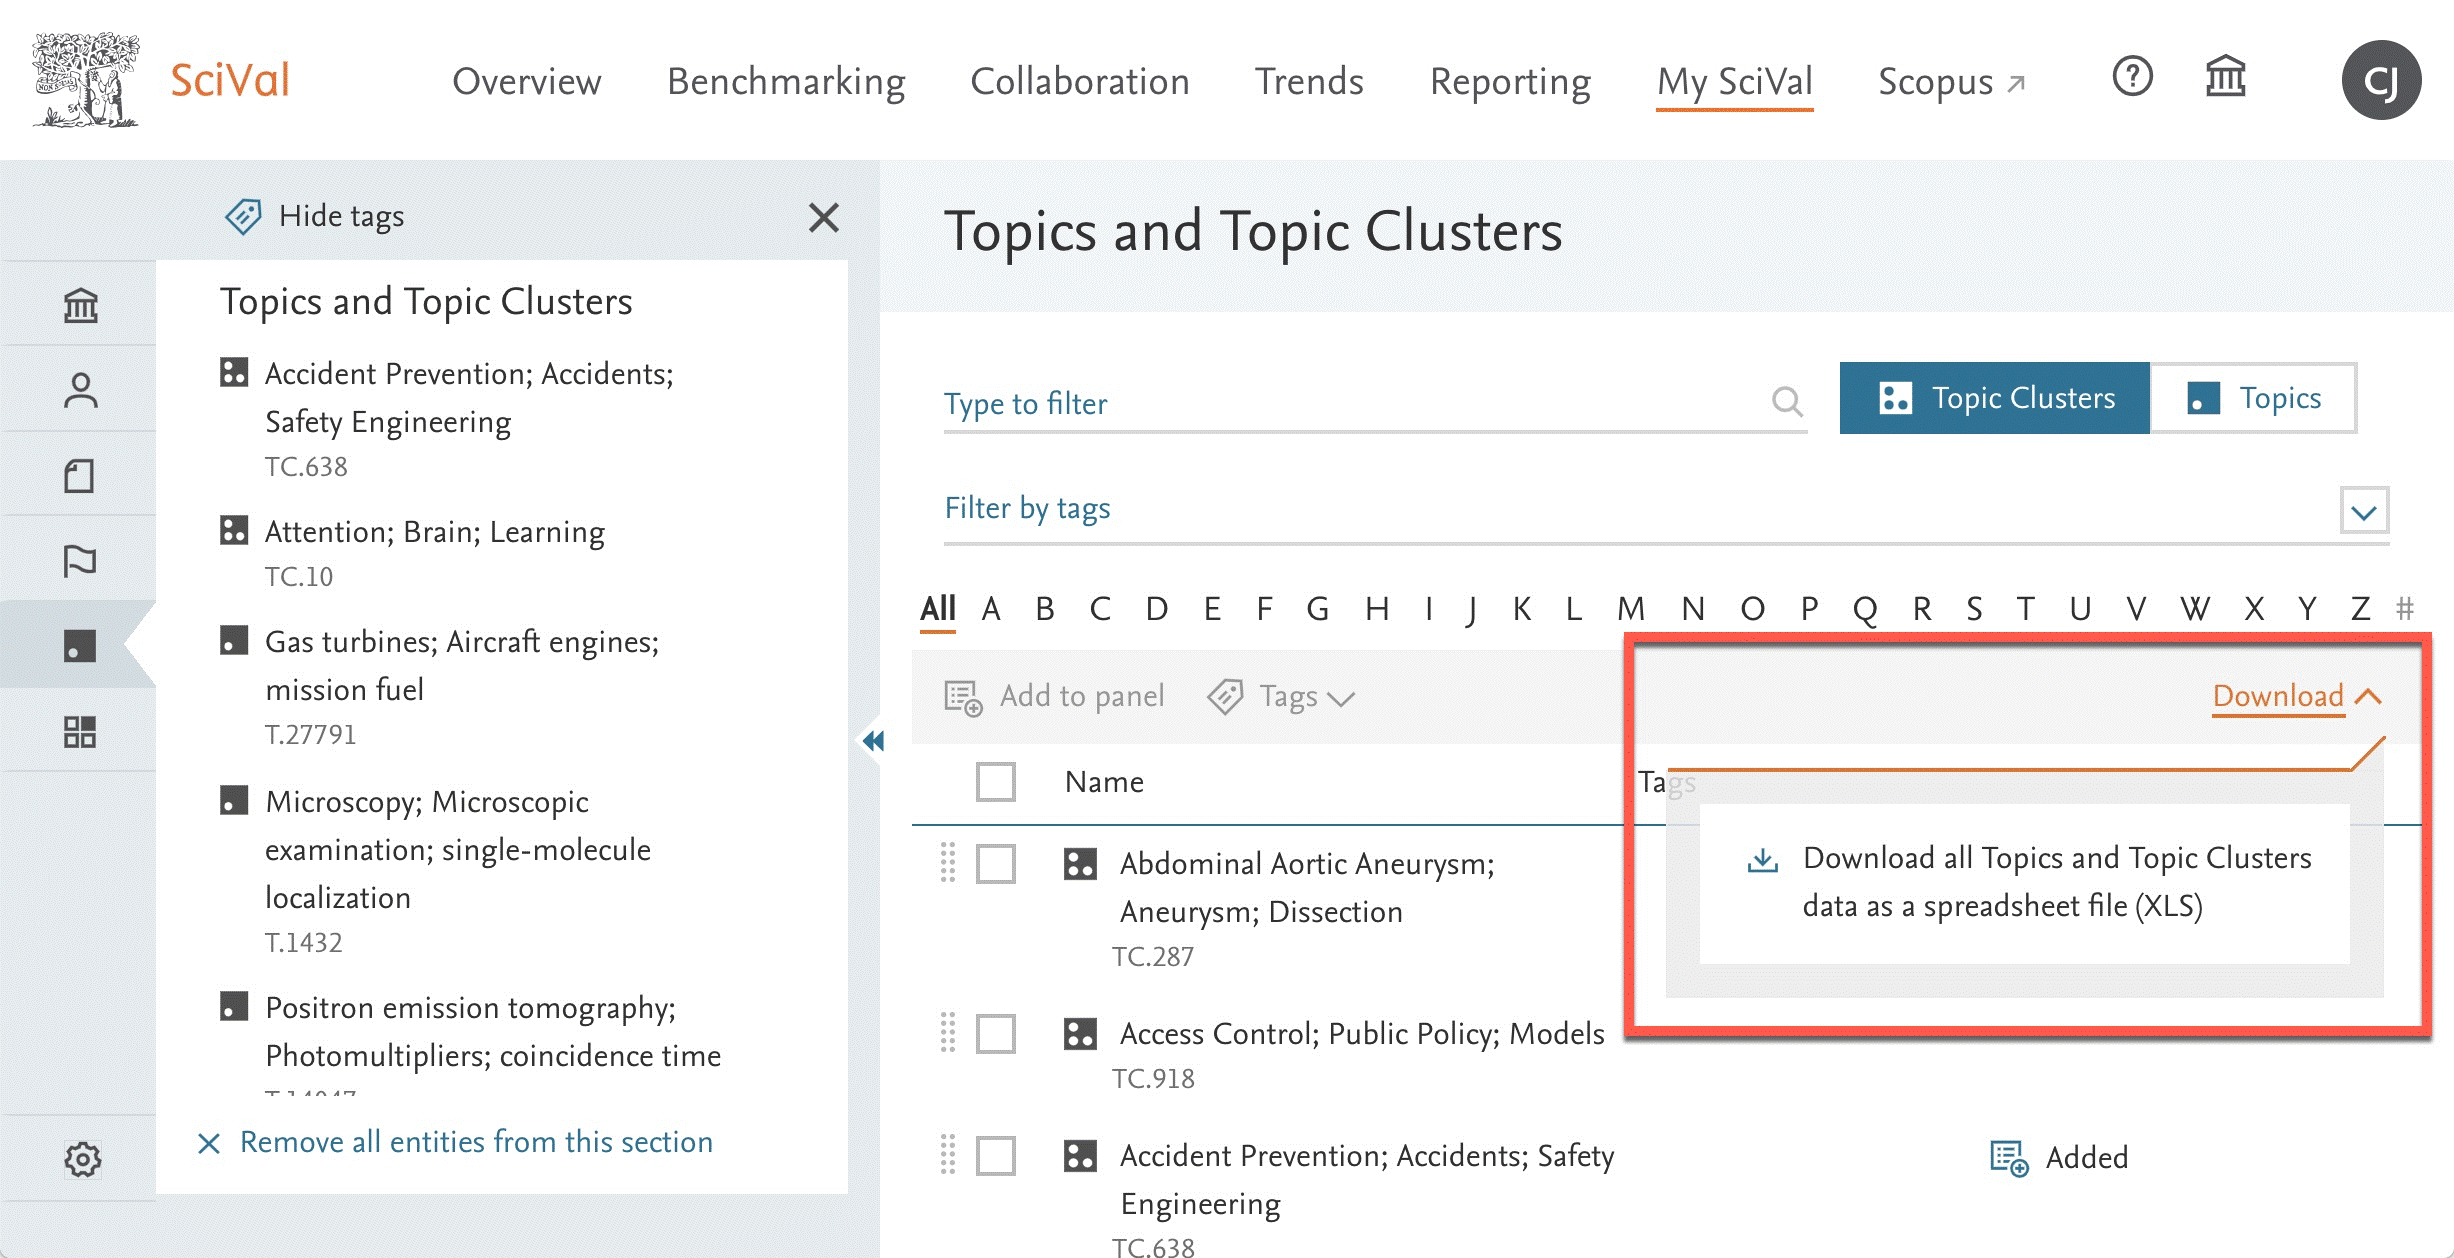
- View all Topics and Topic Clusters. Get a full overview of all Topics and their related Topic Clusters, along with the keyphrases and prominence percentile values from My SciVal. Learn more about Topics and Topic Clusters.opens in new tab/window
- Updated QS subject areas. We have updated our QS subject area filter in SciVal with a new file provided by QS.opens in new tab/window
- New entity navigation panel. The left-hand entity selection panel has been redesigned, giving you more space to display your entities.

The January 28, 2019 release aggregates Topics together to form broader level Topic Clusters:
- Introducing Topic Clusters! The 96,000 Topics are very niche and whilst they are easy to understand for the subject experts, that is more difficult for subject generalists. To help aid discovery and understanding of the Topics, we have taken the Topics and aggregated them to around 1,500 Topic Clusters. These Topic Clusters allow you to start with a more generic area of research, uncover the top researcher and institutions and then drill down into the Topics that make up the Topic Cluster. Learn more about Topic Clusters.opens in new tab/window
2020 Release Highlights video
Get a highlight of the most notable release items in SciVal for 2020 in a 15 minute videoopens in new tab/window
 Current Release Notes
Release Notes 2023
Release Notes 2021-2022
Release Notes 2017-2018
Did we answer your question?
Related answers
Recently viewed answers
Functionality disabled due to your cookie preferences