
View by category
In Compare, assess your strengths and areas for improvement by analyzing custom selections of entities, metrics and subject areas, which enable confident comparison and benchmarking.
- The ‘Benchmark all metrics’ tab in the Compare section provides advanced capabilities to perform flexible and in-depth analyses across a diverse set of entities, metrics and subject areas
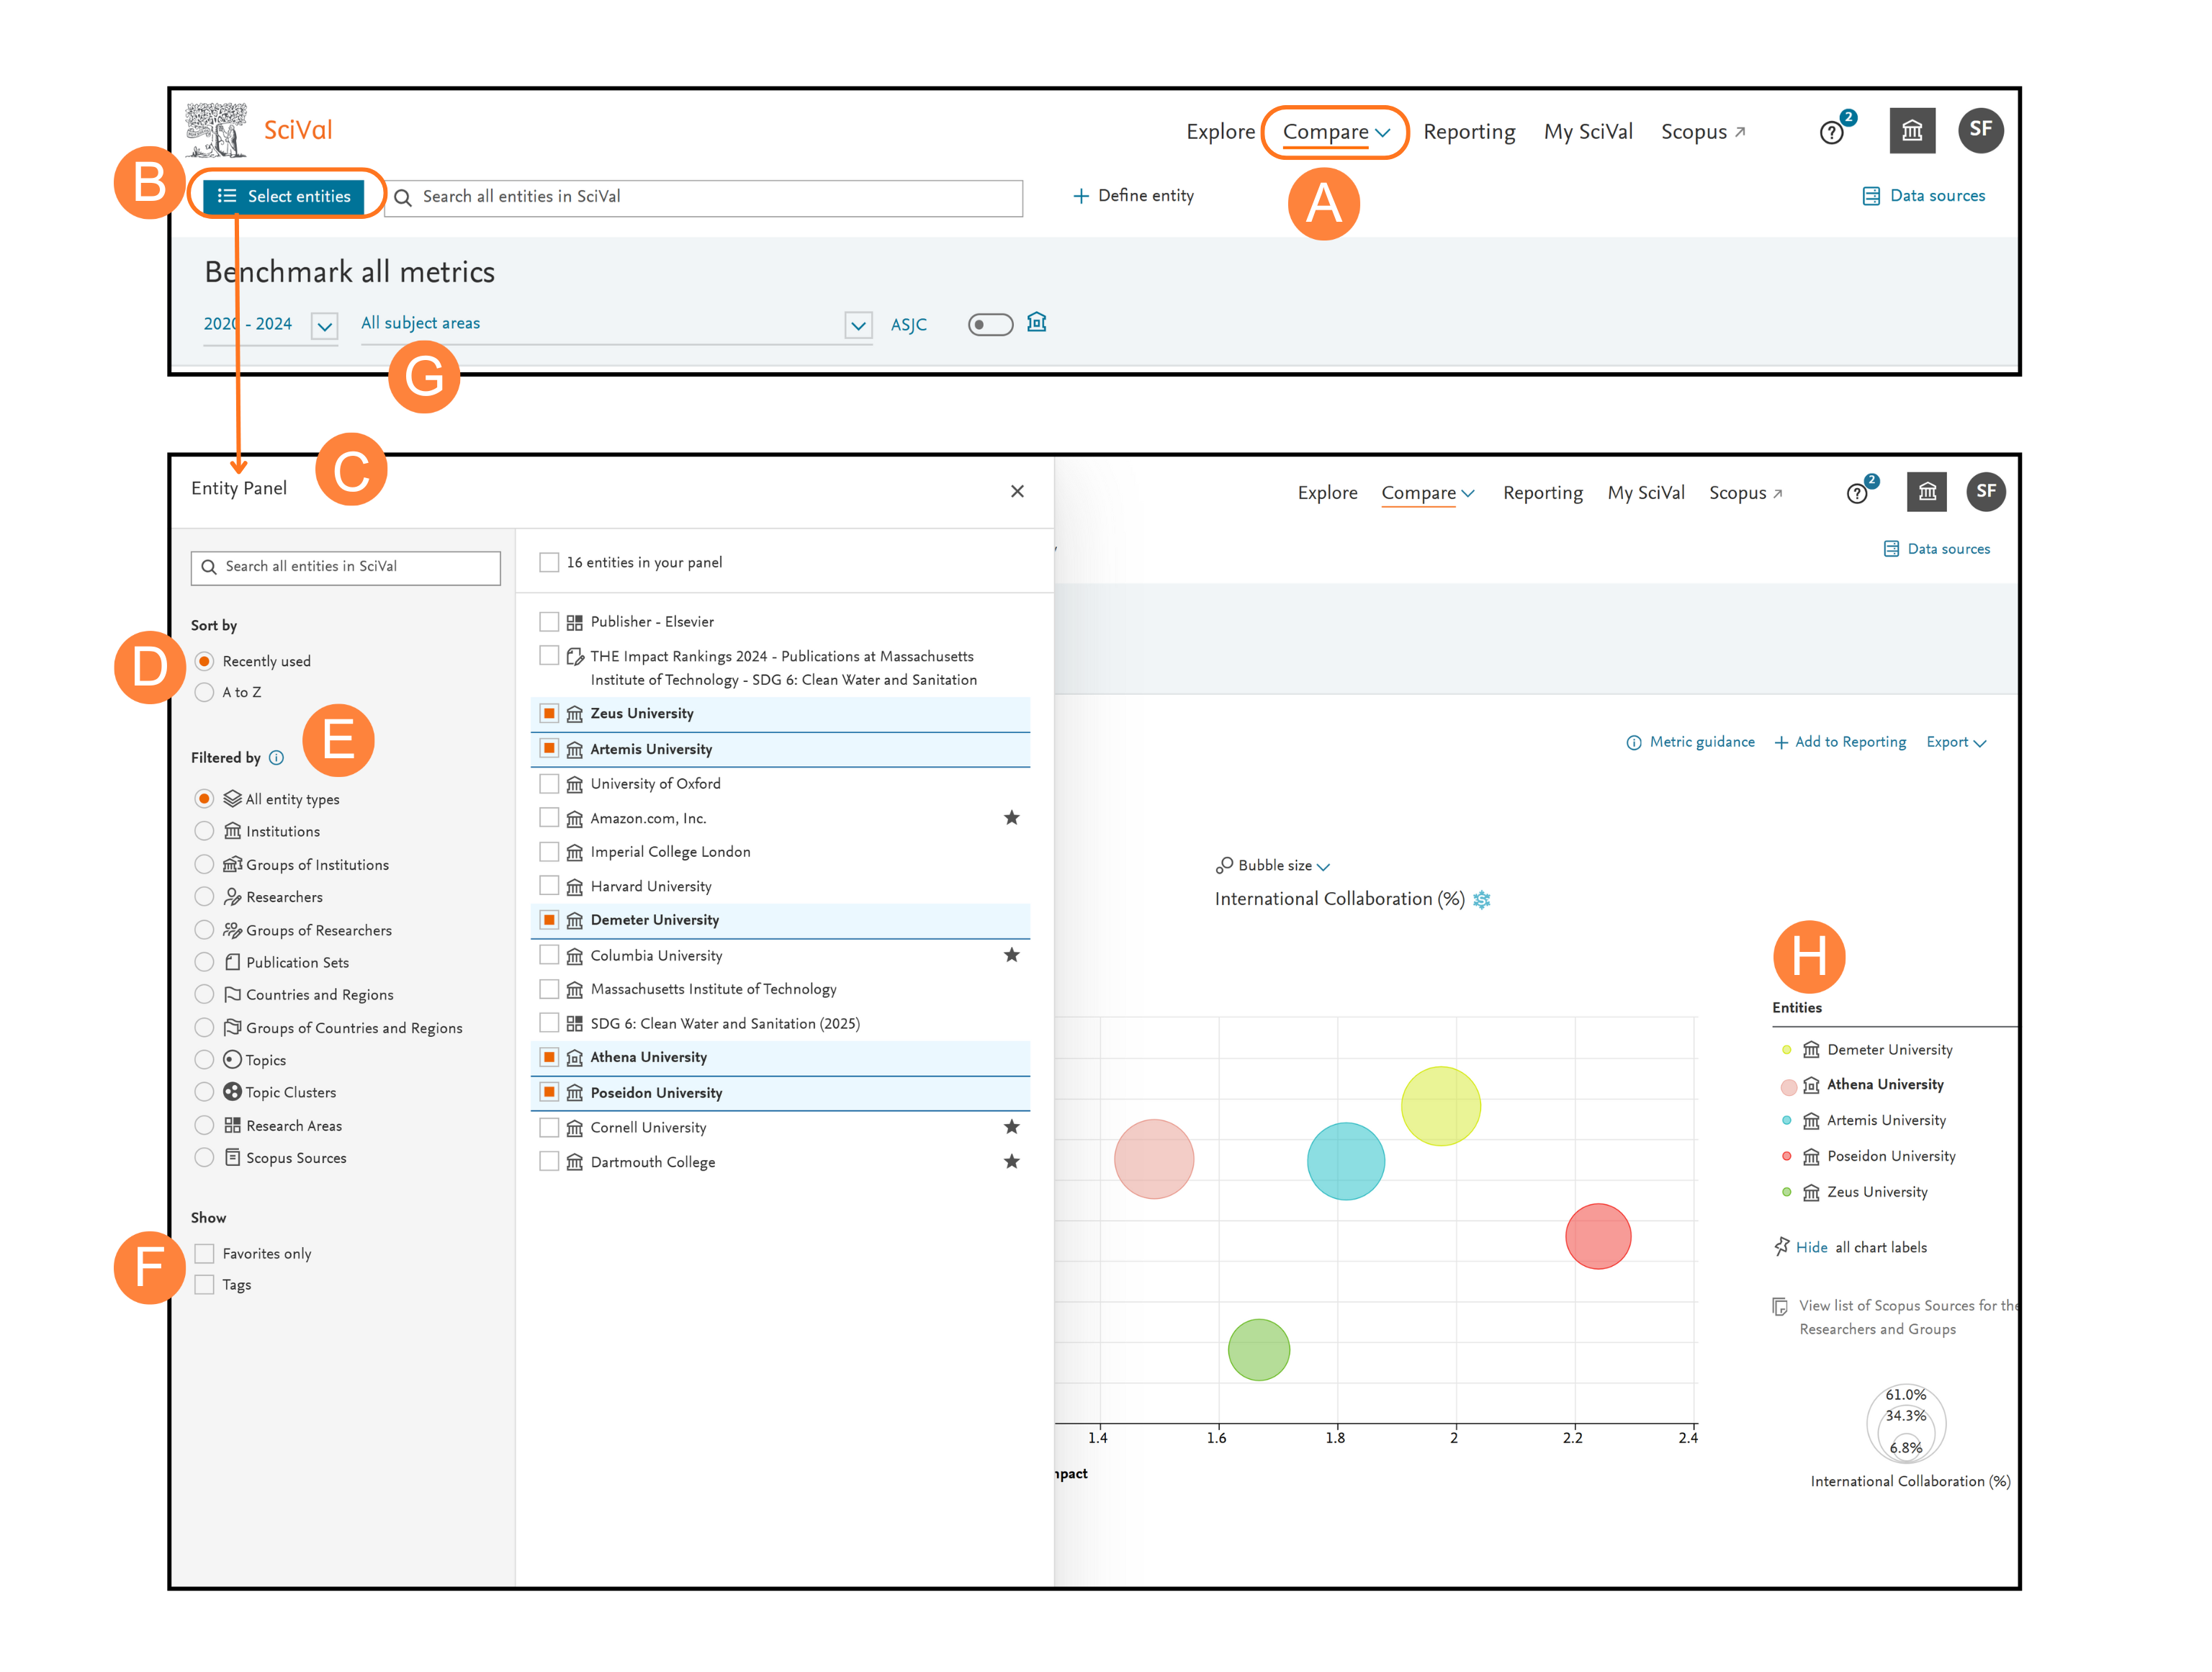
- Located in the top left corner, you can access the entity panel by clicking “Select entities” on any page in Explore or Compare
- Using the entity selection panel, select any desired combination of entities you wish to analyze and benchmark. You can add up to 100 mixed entities and 200 researchers at one time to Benchmark (All metrics) in Compare. The Search field can also be used to retrieve entities based on entity name or tags. This searches across all entities available in SciVal, even if they are not yet in your entity panel
- Add Institutions or Countries/Regions by searching or enter the Advanced Search to view a list of pre-defined institutions and Countries to select from
- Add Researchers, Publication Sets, Research Areas and Groups by creating your own (see page 15 and onwards)
- Entities in your panel can be sorted by ‘Recently used’ placing them in chronological order or by ‘A to Z’ for alphabetical sorting
- You can sort by ‘All entity types’ or filter on a specific type
- You can filter to show tags you have added or entities marked as ‘Favorite’
- Select year range from 1996 to the current year
- The right-hand side of the panel returns your entities based on the selections made on the left-hand side
Select from a country, region or the ‘World’ to contextualize your relative performance, or create bespoke research areas to benchmark against a research topic.
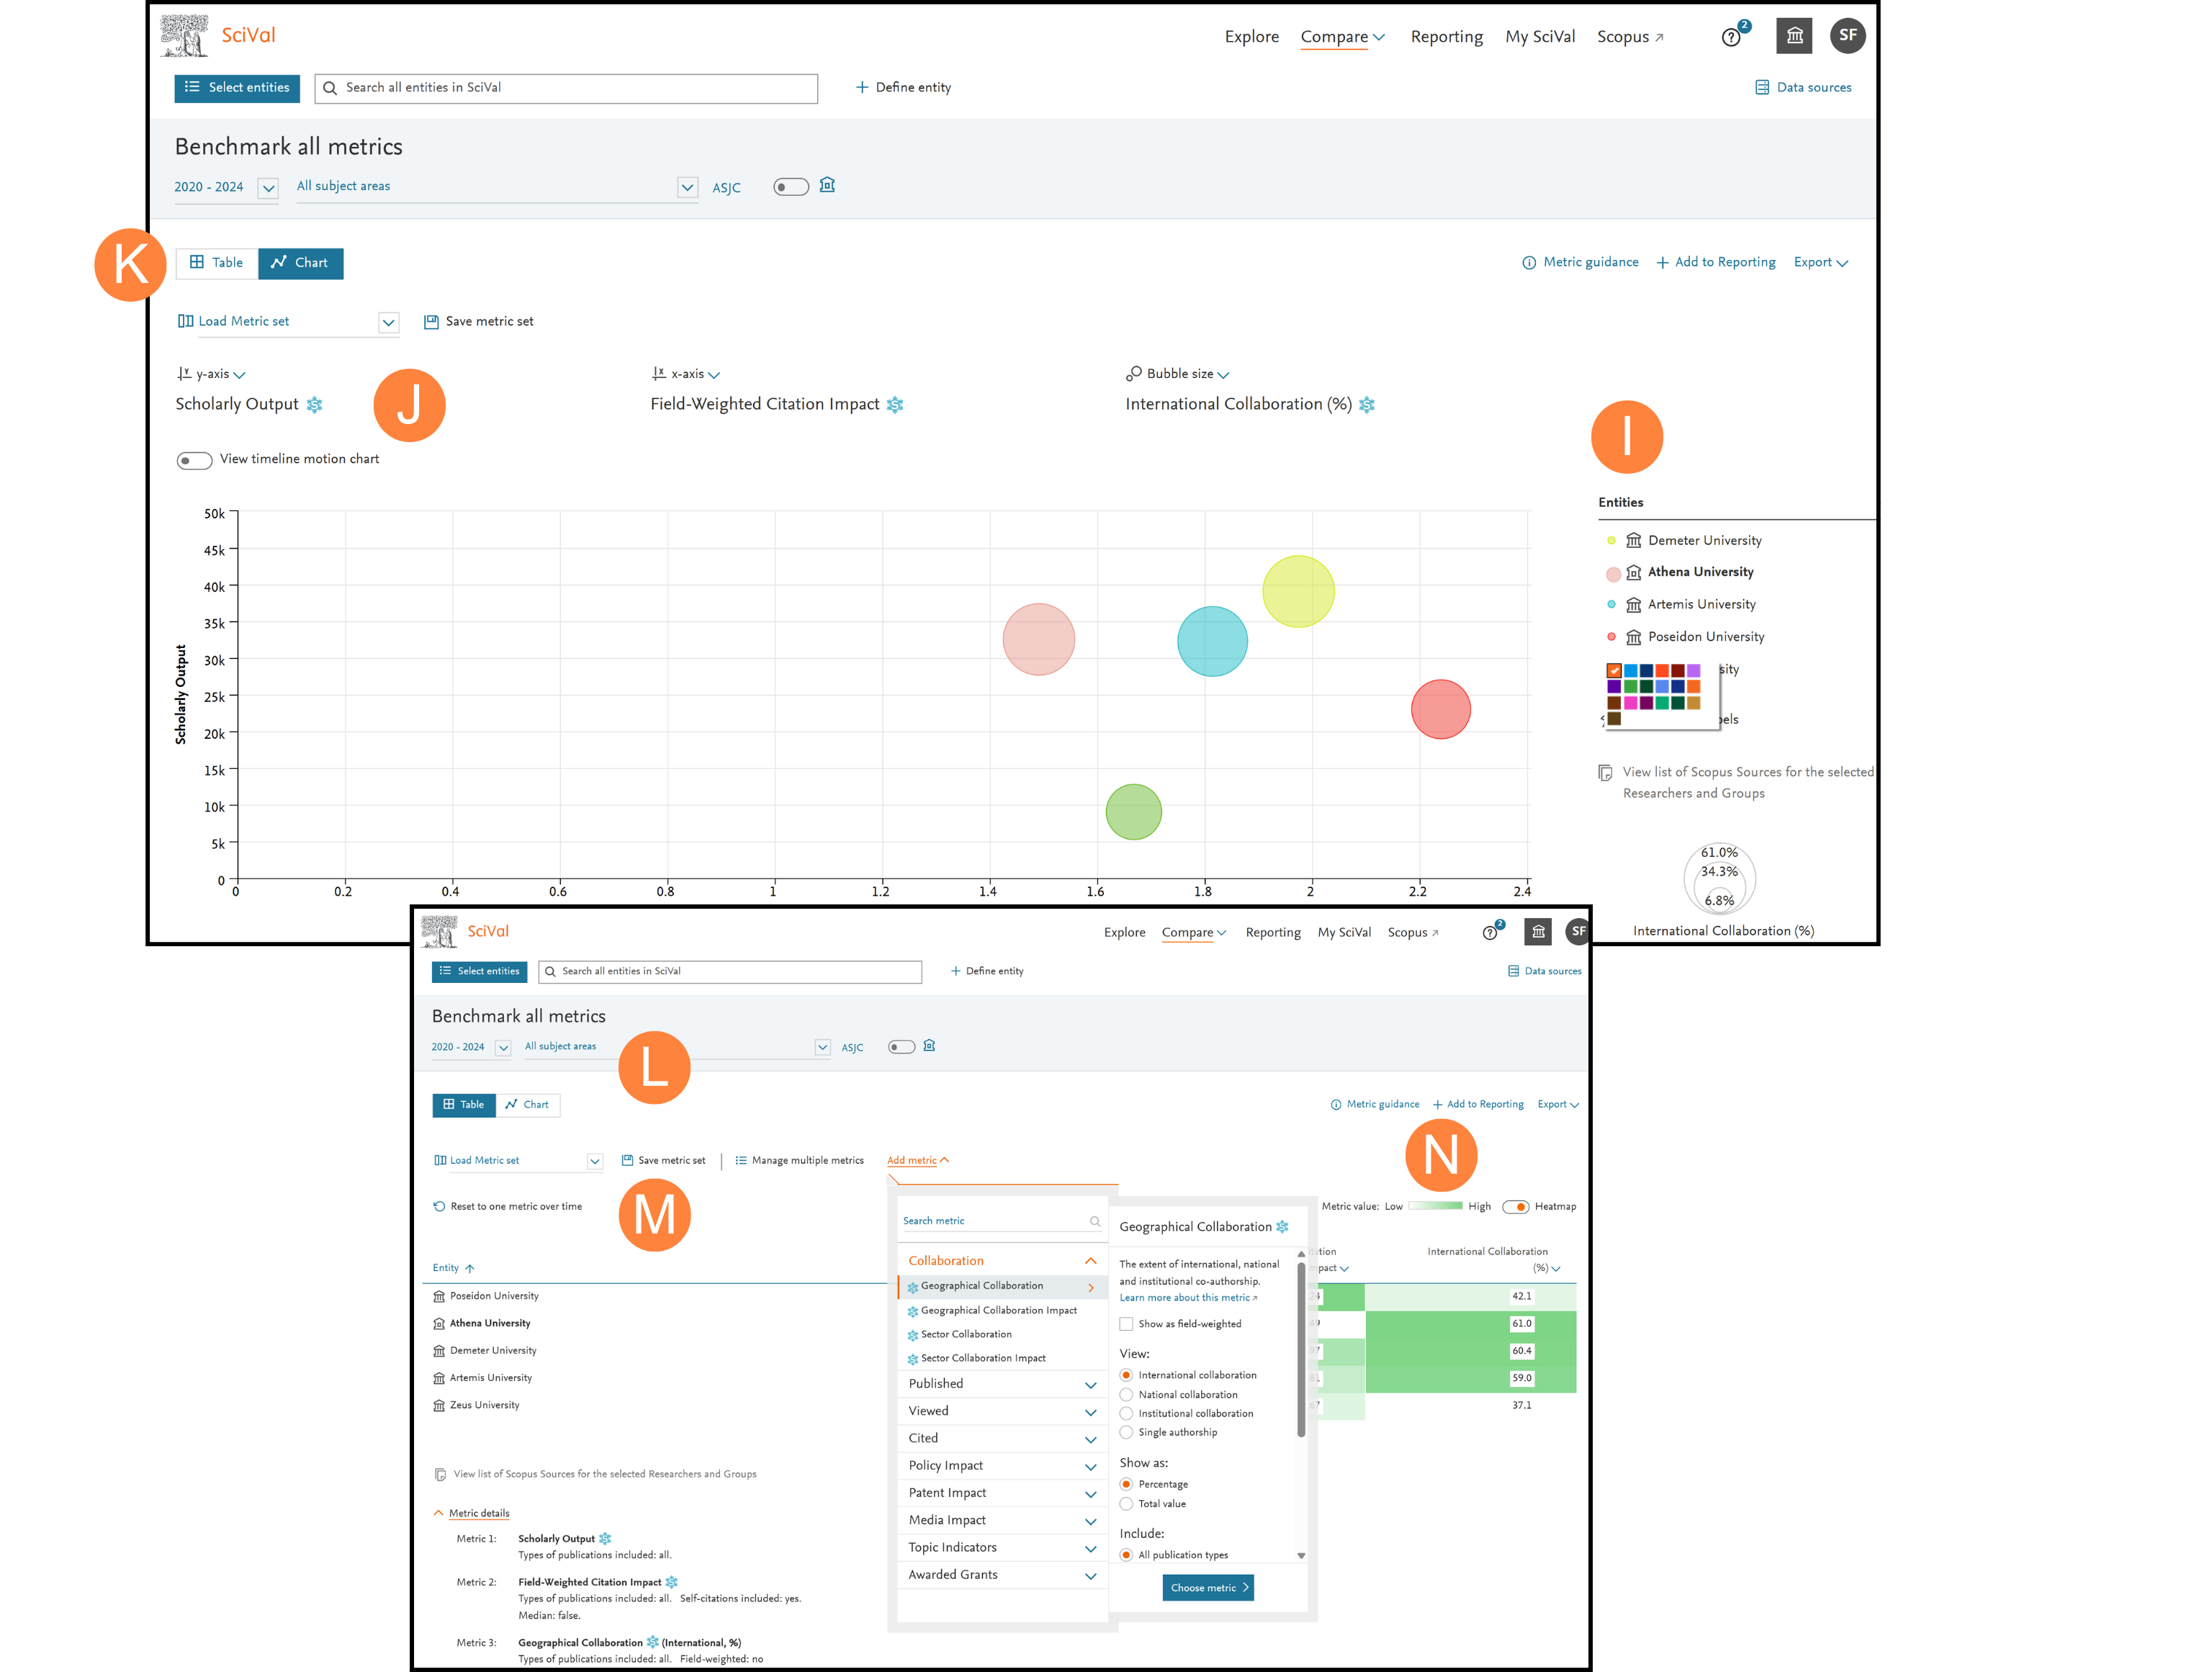
- Show entity names on the Chart by clicking the pin icon which appears after hovering on the entity name
- See progress over time through the timeline motion chart
- Switch to the table view to analyze metric values and add more metrics to the analysis
- Filter by subject area
- Add up to 25 metrics to the table by searching and selecting metrics one by one in the metric selector, or using the ‘Manage multiple metrics’ modal to add them in bulk
- Add the analysis to a Report
The numbers within the table are clickable and will show you the underlying publication data.
Did we answer your question?
Related answers
Recently viewed answers
Functionality disabled due to your cookie preferences