
View by category
The Reporting section in SciVal allows you to create rich reports specifically tailored to support your institution's distinct research strategy. Select entities, metrics and options in all modules to save as analyses, and use in your custom made reports.
Analyses and reports are stored in a Reporting library accessible via the navigation bar at the top of the screen.
Some important facts to note are:
- SciVal uses a “what you see is what you get” approach, meaning that the filters and options you select will be reflected in the analyses that is saved in Reporting.
- You can only use an analysis in one report. To use the same analysis in a second report, you'll need to copy it.
- Reports, like the analyses in SciVal are living entities. Any new content that is added to SciVal from Scopus through the weekly feed, will be reflected where applicable in the analyses, as they are in the SciVal modules. To save a snapshot in time, you can export a report.
Working with Reporting
In the Reporting section you can save / use analyses, create reports, order your reports in groups or folders and rename, copy, merge, delete, export and share your reports.
You can also use the report templates to quickly populate reports for a number of entities.
Reports are made up of one or more analyses A report may contain up to 20 analyses. To create an analysis:
- Select the entities, metrics and options, and chart or table in any of the modules. The filters and options you select will be reflected in the analyses that is saved in Reporting.
- Click 'Add to Reporting' and either save it using the default name or give it a custom name. Choose if you want to add it to an existing report, or if you want to create a new one.
- For a table you can also choose the number of visible rows to include from 5 – 500.
- After saving your analysis, you can either go directly to the Reporting Library, or save more analyses.

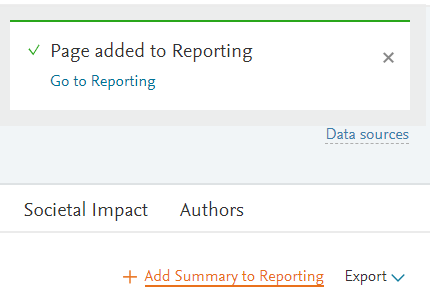
Note: In the Overview Summary tab, you can add the complete page to Reporting. When you select 'Add Summary to Reporting', it automatically saves all of the analyses on the page as separate analyses in Reporting, and creates a report containing all analyses. You can then rename, reorder, add, and remove analyses to the report before you share it.
To create a report, go to the Library of analyses and reports, by clicking 'Reporting' in the global navigation bar at the top of the screen. Please note that an analysis can only be used in one report. If you wish to use the same analysis in a second report, you will need to copy it.
- Click 'Create new' and select 'Report'.
- Drag and drop the analyses you want to use in your report to the right-hand side.
- Drag and drop the analyses in the report to have them in the desired order and name your report.
- Click the 'View' tab at the top to see the report layout.
- Add descriptions to each analyses as needed.
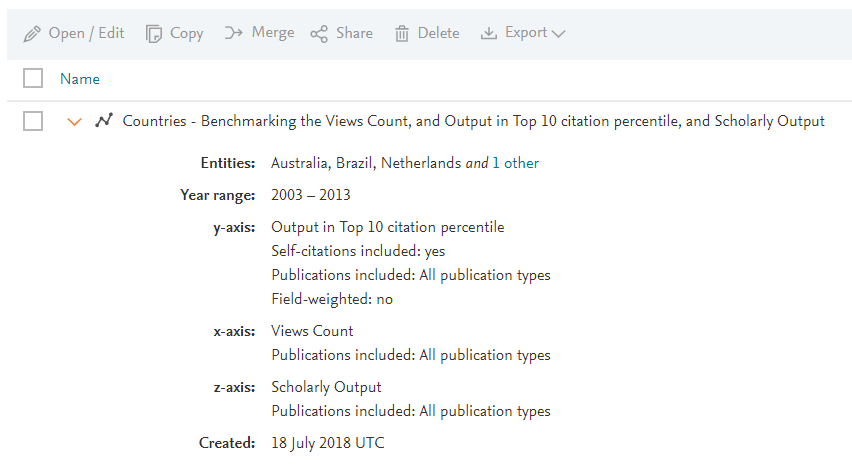
Note: You can see the details of each analysis, including the entities, year range, and options chosen for each analysis, by clicking the chevron.
You have the option to export and share reports. This can for example, help keep your team informed on their progress throughout the year. You can also export individual analyses as csv or xlsx files.
To export a single report or analysis:
- Select the report or analyses using the checkbox.
- Choose 'Export' from the top panel or the export icon in the entity you have chosen.
- Choose your export option.
To export multiple reports or analyses:
This can be used to export 10 reports and/or analyses as one zip file.
Note: A report can contain up to 20 analyses, so this option allows you to export a maximum of 200 analyses.
- Select the reports and/or analyses you want to export.
- Choose 'Export'.
- Choose your export format.
- You’ll receive an email once the export is ready (usually within 6 hours).
Saving a Report as a Snapshot creates a timestamped PDF document, stored in SciVal alongside the Report.
As with sharing custom made entities, SciVal allows you to share reports with other SciVal users within your institutional account
- Select the reports you want to share.
- Choose 'Share'.
- Invite people to receive the report(s), choose their rights (editing or view), add a message and send the invitation.
You can also click on the 'Currently invited / shared with' link to view and modify the sharing options for the selected report(s).
You can merge 2 or more reports into a single report. This can only be done if the total number of analyses in the combined report is less than 20.
- Select the reports you wish to merge.
- Select Merge and name the new report.
- If needed, adjust the sharing rights.
Once you build up a library of reports and analyses you may want to organize it. Reporting gives you a flexible folder structure to help you organize your library.
To get started you can either:
- Click 'Create new' and select 'Folder', then add analyses and reports to your folder, or;
- First select the reports and analyses you’d like added to a folder, then click 'Create new' and select 'Folder'.
- You can name your folder, add sub-folders and add or remove analyses/reports from the folders as required.
Report templates can help:
- Speed up repetitive tasks.
- In just a few clicks you can have a fully populated report with up to 20 analyses for the entity (i.e. a Researcher) you’re interested in. Then use the same template for another Researcher.
- Less “metric-savvy” colleagues choose the right analyses for the entities they are investigating.
- Guide users on how to find metrics within SciVal
There are 20+ predefined templates available for all entities in SciVal. Each template provides an easy way to get a mix of simple and sophisticated metrics.
Report templates are also a great way to get to know the metrics within SciVal. Once a report is created from a template you can jump straight to the relevant modules in SciVal to modify and interact with the metrics.
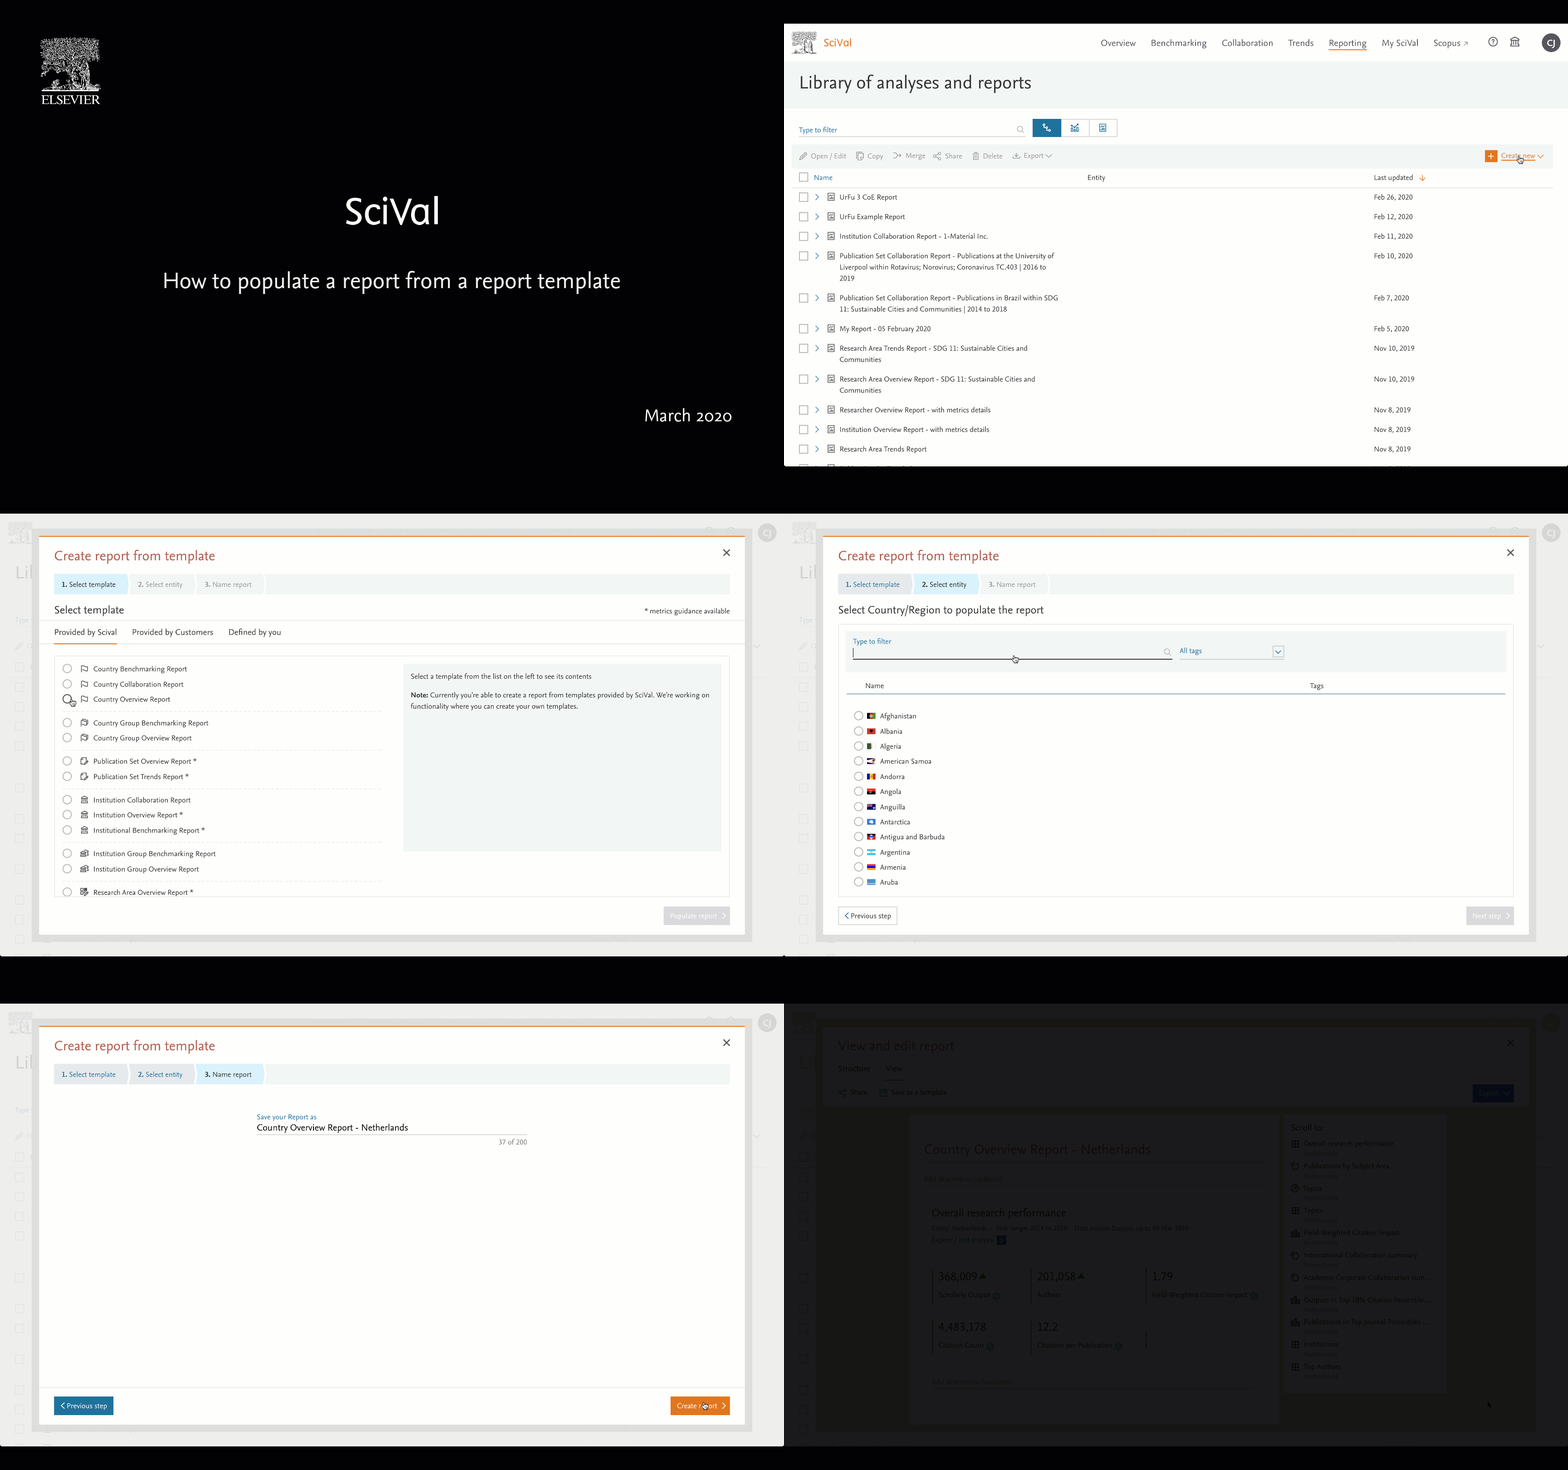
To populate a report from a template:
- In My SciVal, click 'Create new'> 'Report from Template'.
- Select the template you want to use.
- Note: A template with analyses from Benchmarking, plus one of the other modules, will require an additional step. You first need to choose a core entity (the entity that will feature in the analyses from the Overview, Collaboration and/or Trends modules) and then the entities with which to benchmark.
- Select the entity, or entities that will be analysed in the report.
- Note: When you select a template, the panel on the right gives details about the analyses within the template and the modules needed. Analyses that are greyed out, belong to modules to which you have no access.
- Name and save your report.
- Some of the templates contain metrics guidance for each analysis, which you can choose to include or exclude from your report.
Once saved, you now have a standard report. You now have the freedom to change, remove and add analyses as you wish.
You can also create a report direct from the header of the Overview and Trends modules. Click the “Report from Template” link and follow the instructions.
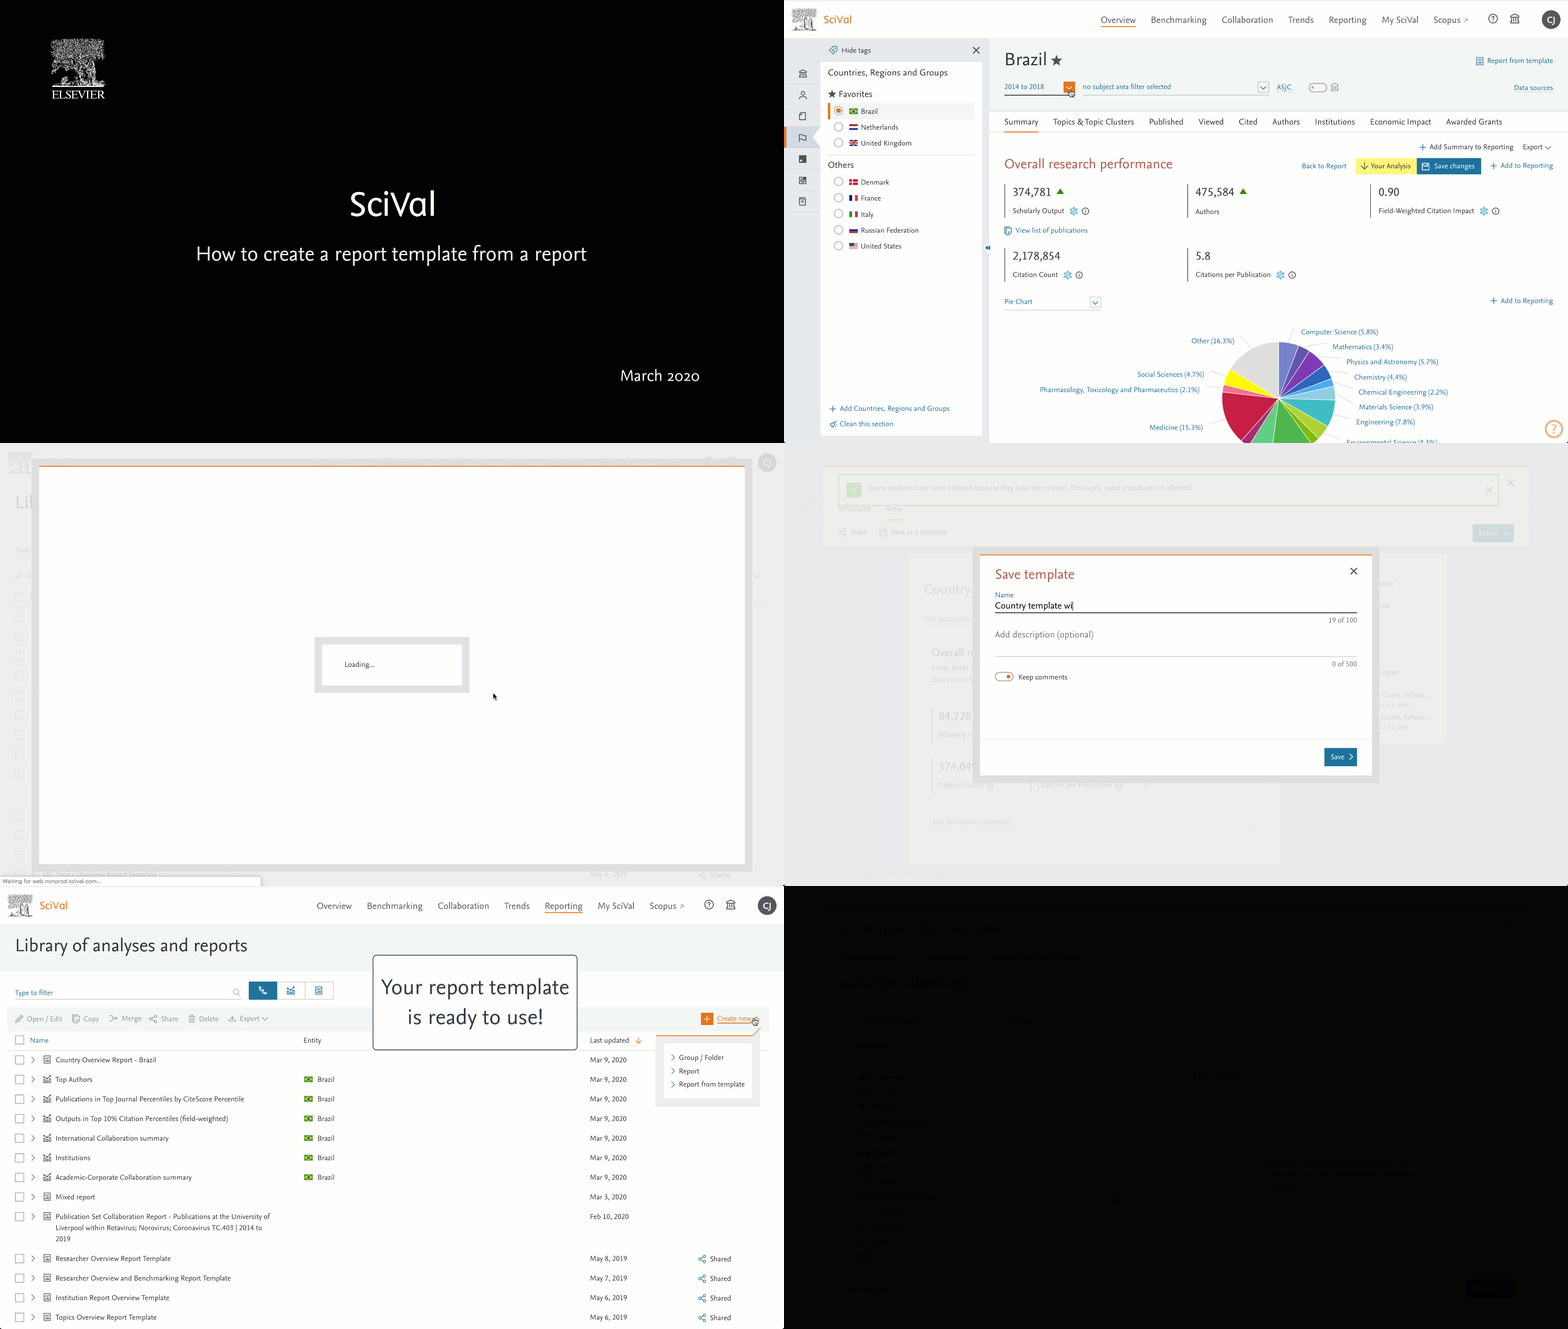
You can create a report template from a report. Go to Reporting and open the report you would like to save as a template. Click the “Save as template” link.
Report templates focus on a core entity
This means the report must focuses on one of the available entities in SciVal (e.g. a Researcher, or Institution, or Topic etc) when using analyses from either the Overview, Collaboration or Trends modules. Benchmarking analyses may contain other entity types with which to benchmark your core entity.
If your report meets the following criteria, you’ll be able to save it as a template:
- analyses using the Overview, Collaboration and Trends modules must contain only one entity type. An example of an entity type is a Researcher or a Researcher Group
- analyses using the Benchmarking module can contain different entity types
- the report can contain analyses from all modules
Note: The options you selected in your report will be stored in the report template and cannot be changed in the template, so make sure they are correct! For example, the subject classification and date range.
Save report as template – what happens next?
For Overview, Collaboration and Trends analyses:
- All entities are stripped out of the template and the entity type is stored as the core entity for the template
- All analyses, along with their options are stored (e.g. year range and subject area filter)
For Benchmarking analyses:
- All entities are stripped out of the template and the entity types are ignored. This is because any entity type combination can be used in a Benchmark analyses in a report template
- All analyses, along with their options are stored (e.g. year range, field-weighting, self-citation, article type and subject area filter)
If you’ve added descriptions to the analyses, you can choose to keep them in the template
Once you name and save the template, it’s available with the other report templates in the tab “Defined by you” and ready for use!
Once you have saved an analysis or created a report, either from a number of analyses, or from a report template, you can always go back and edit the report.
The types of changes you can make are:
- Add or remove analyses
- Change the order of the analyses
- Modify the setting of an analyses (the date range, subject area, field-weighting etc.
To edit an analysis:
- Select the analysis, or the report that contains the analysis you would like to edit.
- Click 'Explore' / 'Edit' – this takes you directly to the analysis within SciVal.
- Make changes to the analysis and click 'Save changes'.
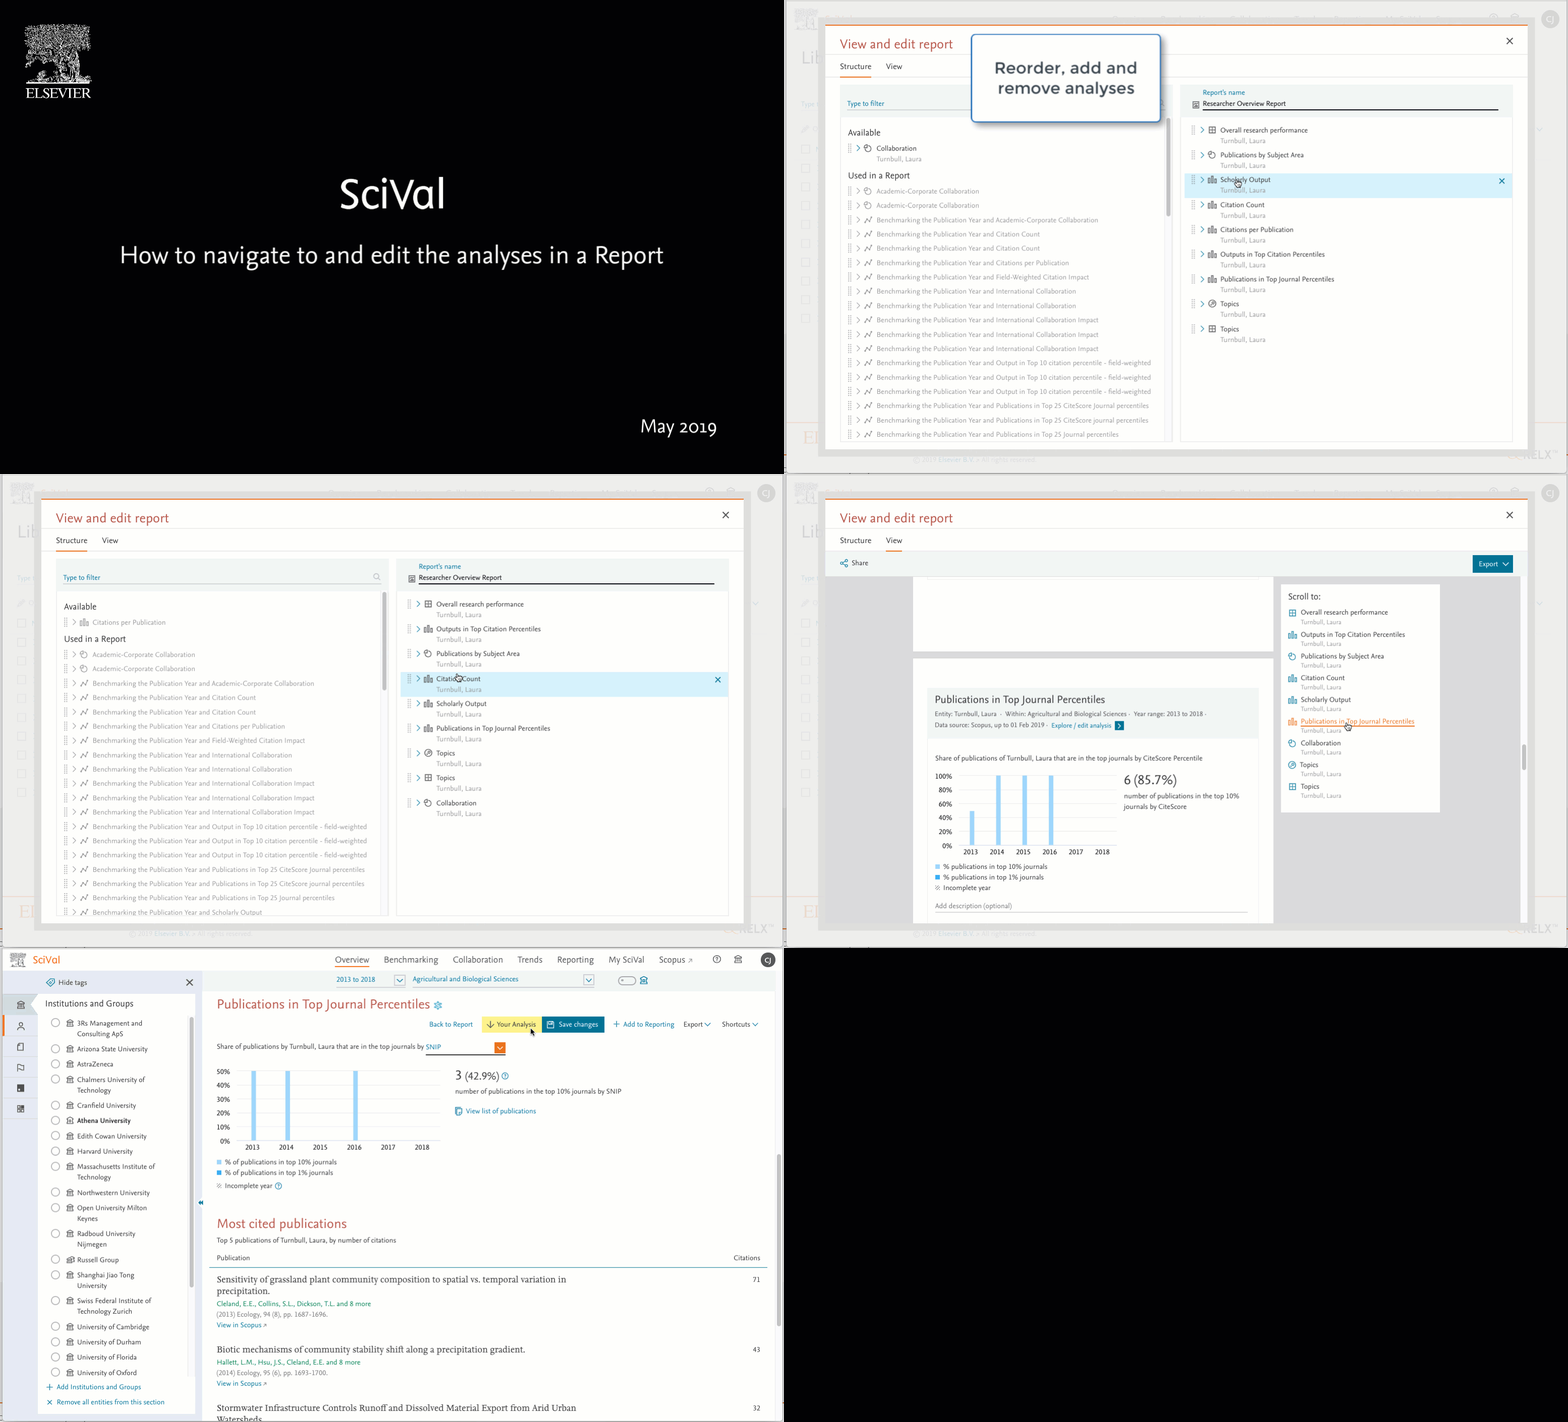
To change the order of the analyses in a report and add or remove them:
- Select the report.
- Click 'Structure' (in the top left).
- Drag the analyses on the right into the order you require.
- Remove analyses and add available ones from the left panel.
Note: There can be up to 20 analyses in a report and an analysis can only be in one report.
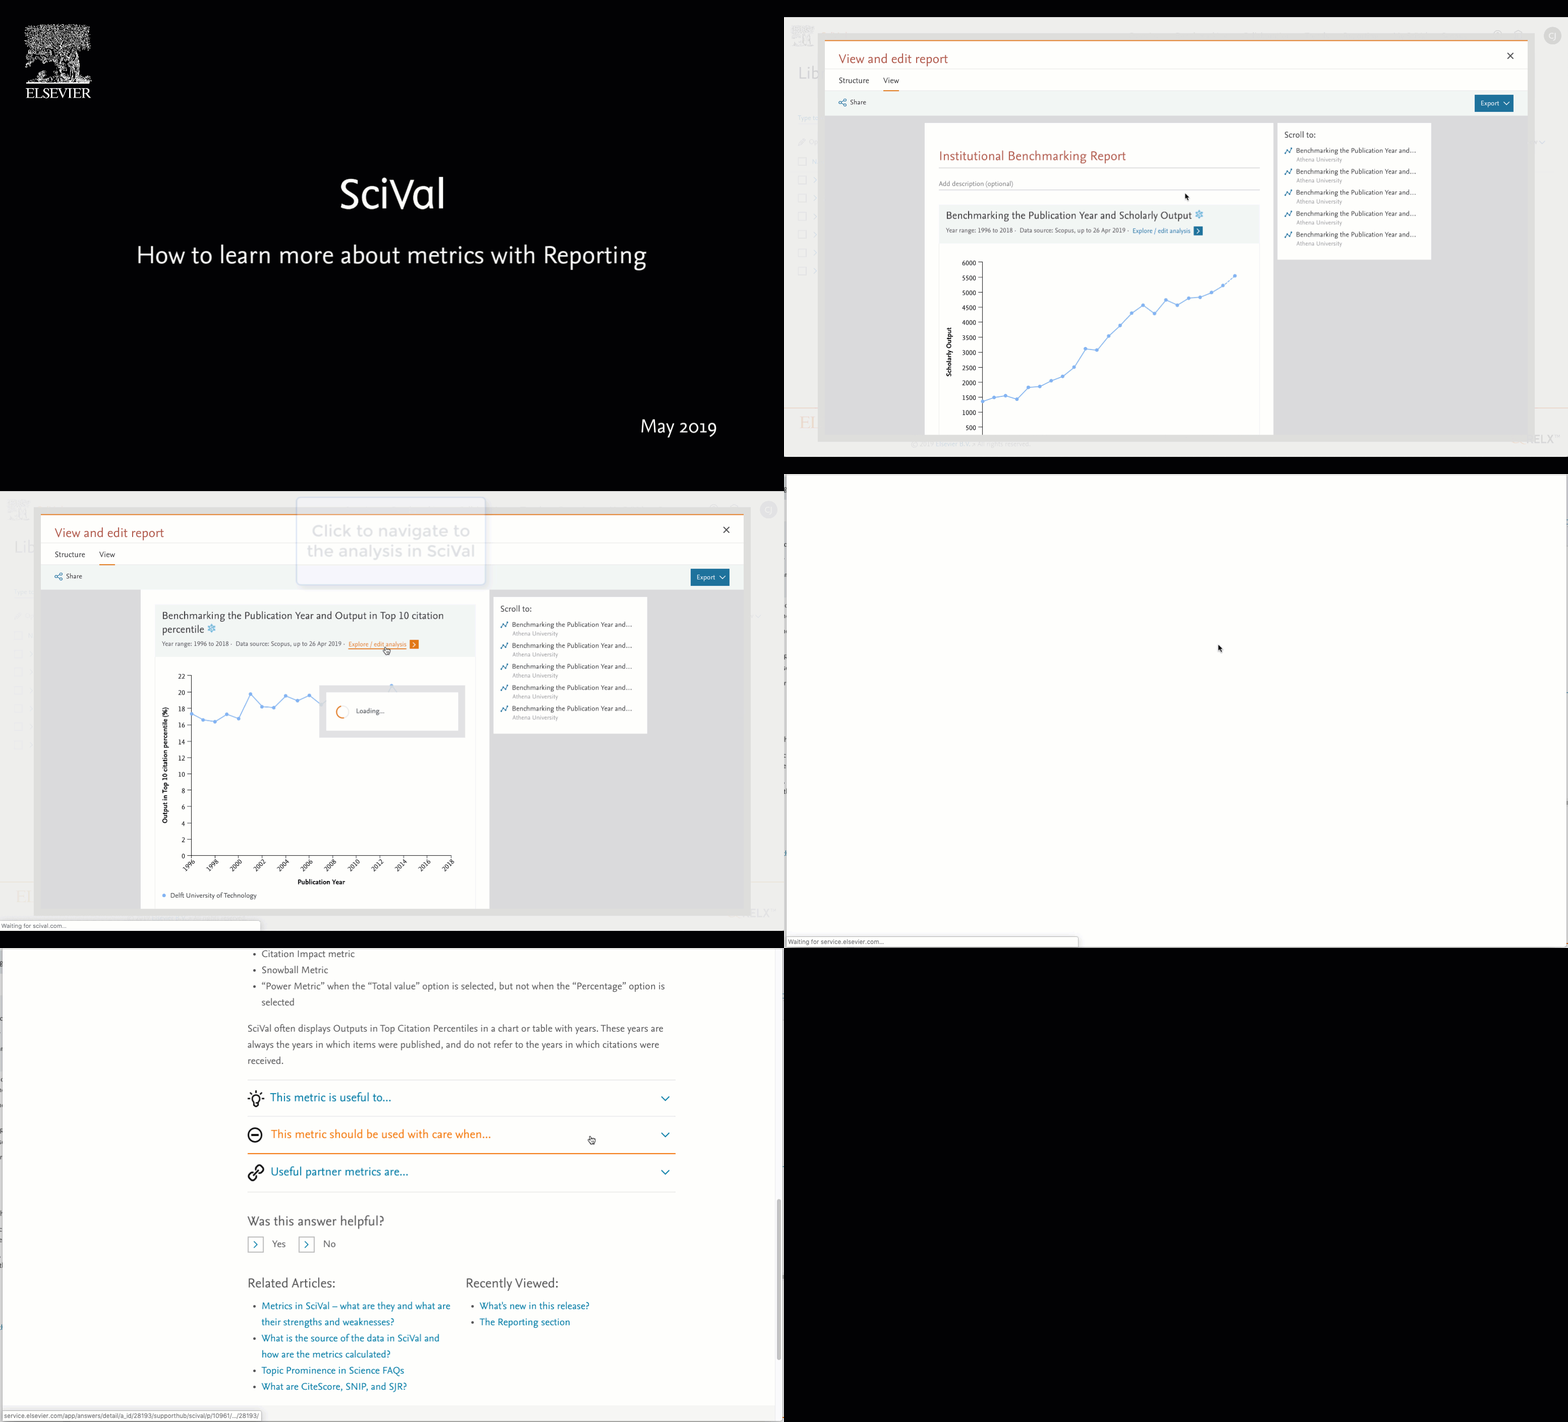
Reports can be used as a way to learn about metrics and where they are located in SciVal. For a first-time user, they can be an ideal way to navigate directly to the relevant modules within SciVal and then learn about the strengths and weaknesses of each metric.
To learn more about an analysis:
- Select the analysis, or the report that contains the analysis you would like to edit.
- Click Explore / Edit – this takes you directly to the analysis within SciVal.
- For a Benchmarking metric, on the metrics selector click 'Learn more about this metric'.
- This takes you to the SciVal Support Center with information about the metric you clicked on. From here you can also learn about the other metrics in SciVal.
Did we answer your question?
Related answers
Recently viewed answers
Functionality disabled due to your cookie preferences