
View by category
The Research Strength Score (THE) measures the representative research quality.
It is based on the 75th percentile value of 5-year Field-Weighted Citation Impact (FWCI 5Y) calculated from the Scholarly Output (THE) to reduce the skewing effect given by publications with exceptionally high FWCI 5Y.
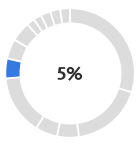
The indicator is weighted at 5.0% of the overall THE World University Rankings Score.
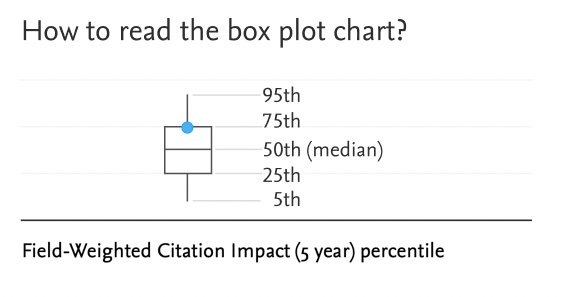
Note: The box plots displayed are derived from the 5, 25, 50, 75 and 95 percentiles.
Field-Weighted Citation Impact 5 years (THE)opens in new tab/window
- A box plot graphically demonstrates the locality, spread and skewness for groups of numerical data through their quartiles.
- In addition to the box on a box plot, there can be lines (which are called whiskers) extending from the box, indicating variability outside the upper and lower quartiles, thus, the plot is also called the box-and-whisker plot.
- For the box plot on the Research Strength Score, the box indicates the 75th (top 25th), 50th and 25th percentiles. The whisker lines indicate the 95th (top 5th) and 5th percentiles for the 5 year FWCI.
- The blue dot (75th percentile), is the value used in the Research Strength Score.
Did we answer your question?
Related answers
Recently viewed answers
Functionality disabled due to your cookie preferences