
View by category
CiteScore is a simple way of measuring the citation impact of sources, such as journals.
Below you will find the answers to most commonly asked questions about CiteScore.
Calculating the CiteScore is based on the number of citations to documents (articles, reviews, conference papers, book chapters, and data papers) by a journal over four years, divided by the number of the same document types indexed in Scopus and published in those same four years.
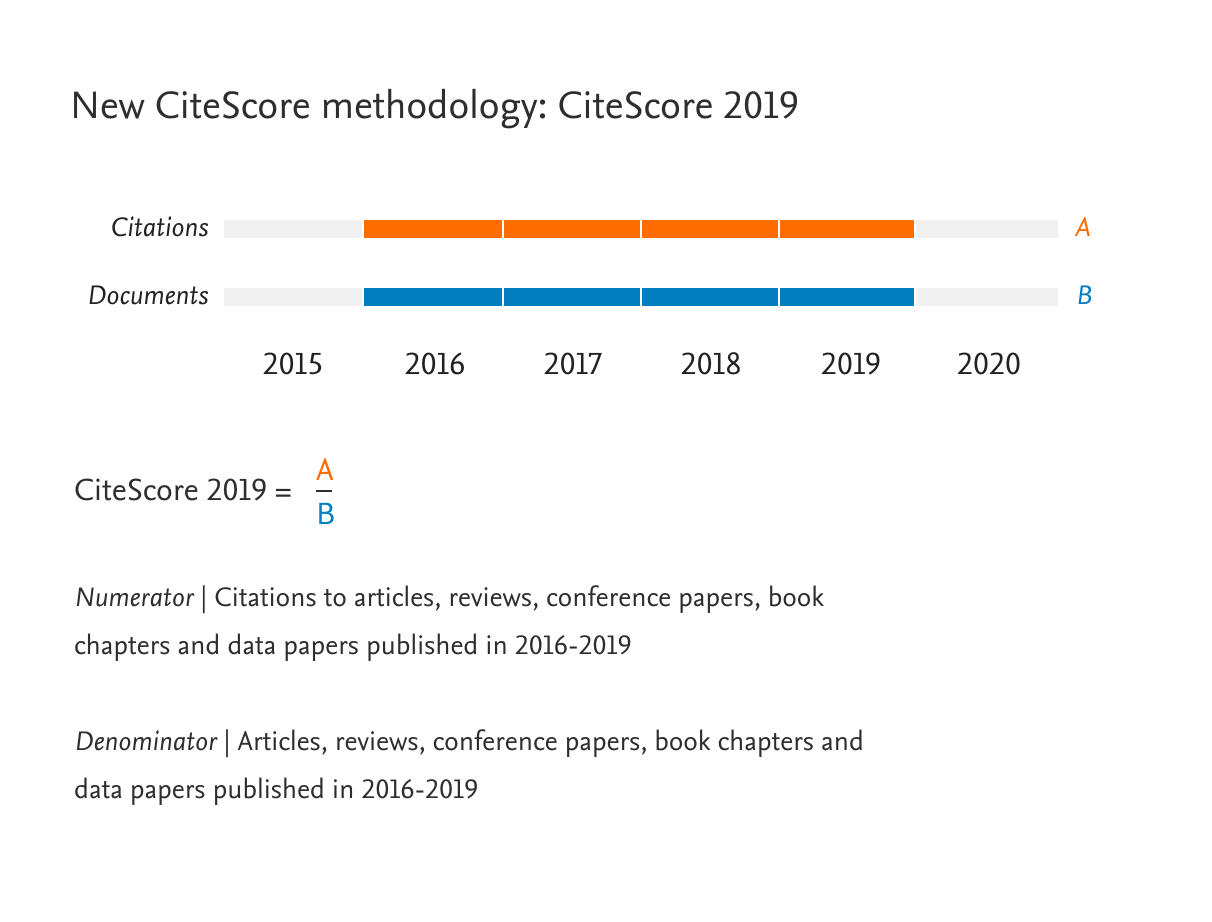
For example, the 2019 CiteScore counts the citations received in 2016-2019 to articles, reviews, conference papers, book chapters, and data papers published in 2016-2019, and divides this by the number of these documents published in 2016-2019.
Four-year window
Peer reviewed bibliometric literature, such as the Journal of Information Science, shows that a three-year window is long enough to capture the citation peak for the majority of disciplines. However, a four-year window was chosen to allow for a more recent year to be included in the equation, making the calculation more robust and stable. CiteScore uses a 4-year window.
The CiteScore numerator and denominator both include the same five document types (articles, reviews, conference papers, book chapters, and data papers) for consistency. This approach gives a more complete picture of citation impact and makes manipulation of the calculation more difficult.
Articles-in-press are indexed in Scopus for some publishers, but are not included in the CiteScore calculation.
Articles-in-press in Scopus are not processed in the same way as regular Scopus items. For example, in Scopus the cited reference list is not available for articles-in-press and therefore they do not contribute citations to other documents in the same way as regular Scopus articles. Also, Scopus does not receive articles-in-press from all serial titles and publishers. Therefore, we exclude articles-in-press from the CiteScore calculation to offer consistency and avoid bias between source titles and publishers.
CiteScore metrics (not CiteScore Tracker metrics) are reported once per year and do not change, so they are suitable for reporting the citation impact of a serial title. Scopus.com is a dynamic database and changes daily.
The CiteScore metrics are created from a snapshot of Scopus and represent the relative performance of serial titles at that point in time. The metrics for previous years have been calculated by recreating the Scopus database as it was at a consistent degree of completeness (around 95%) for each year's metrics.
You should not compare between subject fields using CiteScore. This metric is not field-normalized, and different publication and citation behavior of researchers in different fields affects the values, as well as differences in performance.
You can compare between subject fields in any of the following three ways:
- Using the CiteScore percentile ranking within a subject field. Journals that are in the top 10% of distinct fields have a similar citation impact on that field, even though this percentile ranking is based on a CiteScore with a different absolute value
- Use SNIP, which is a field-normalized metric
- Use SJR, which is a field-normalized metric
CiteScore Tracker is calculated in the same way as CiteScore, but for the current year rather than previous, complete years.
The CiteScore Tracker calculation is updated every month, as a current indication of a title's performance.
The numerator (citation count) of the current year's metric builds up every month as additional citations are received, so that the construction is consistent with the construction of the complete year CiteScore. CiteScore Tracker is not based on a rolling 12-month window.
The metric values are fixed around springtime, then the Tracker is calculated for the subsequent year. For example, CiteScore Tracker 2020 will be complete and fixed around May 2021, when CiteScore Tracker 2021 will start to be displayed in Scopus.com.
The following metrics are complimentary to CiteScore:
- CiteScore Percentile indicates the relative standing of a journal in its subject field. A 98th CiteScore Percentile means the journal is in the top 2% of its subject field. You can use this number to compare sources in different subject fields.
- CiteScore Rank and Rank Out Of indicates the absolute standing of a serial in its field; for example, 14th out of 63 journals in the category.
- Citations is the numerator of the CiteScore calculation.
- Documents is the denominator of the CiteScore calculation.
- CiteScore Tracker forecasts a source’s performance for the upcoming year. CiteScore Tracker 2020, for instance, will continue to update on a monthly basis until it is fixed as an annual score in spring 2021, when Scopus starts to provide a monthly view on CiteScore Tracker 2021.
When quoting a CiteScore metric value, provide the name of metric, value of metric, year to which metric refers, currency of data from which metric was calculated, data source, and the serial title that the metric refers to. Also include a URL or link to the source of the metrics in the format: www.scopus.com/sourceid/xxxxxxx. Furthermore, t is good practice to quote the subject category from which a metric is calculated for CiteScore Percentile, Rank, and Quartile.
It is also good practise to quote the subject category within which a metric is calculated for CiteScore Percentile, Rank, and Quartile.
The minimum information you should provide is the metric name and year. A link to Scopus and the context of the metric (such as on a journal home page) provides the rest of the information.
Examples on how to refer textually to a CiteScore metric value quoted for a particular serial title are:
- CiteScore™ 2019 for Journal A. Calculated by Scopus on 31 May 2020.
Available from www.scopus.com/sourceid/xxxxxxx - CiteScore™ Tracker 2019. Calculated by Scopus on 15 November 2019.
Available from www.scopus.com/sourceid/xxxxxxx - CiteScore™ Percentile 2018. Calculated by Scopus on 31 May 2019 for biomedical sciences.
Available from www.scopus.com/sourceid/xxxxxxx
You should not compare between subject fields using CiteScore. This metric is not field-normalized, and different publication and citation behavior of researchers in different fields affects the values, as well as differences in performance.
You can compare between subject fields in any of the following three ways:
- Use the CiteScore Percentile ranking within a subject field - Journals that are in the top 10% of distinct fields have a similar citation impact on that field, even though this percentile ranking is based on a CiteScore with a different absolute value.
- Use SNIP - Which is a field-normalized metric.
- Use SJR - Which is a field-normalized metric.
The meaning of a CiteScore of 3.64 differs per subject field, because researchers in different subject fields behave differently, and there are different levels of citations.
CiteScore Percentile serves as the baseline to understand what a CiteScore value means. CiteScore Percentile compares the CiteScore of a serial title to that of others in the same subject field, and indicates the relative position of the serial title. For example, a serial title might have a CiteScore of 3.64 and a high CiteScore Percentile in its field of 93%, or a CiteScore of 3.64 and a low CiteScore Percentile in its field of 34%.
The definition of self-citations that is relevant for CiteScore metrics is citations made by documents published in the serial title to other documents published in the same serial title. In almost all cases, these citations are a responsible and useful behavior to indicate related documents to readers; it is reasonable to expect related papers to be published in the same serial title. Consequently, journal self-citations are included in CiteScore metrics.
CiteScore Percentile indicates the relative standing of a serial title in its subject field. Each subject field is divided into 100 equal-sized percentiles based on the number of serial titles, and a serial title is assigned to a percentile based on its CiteScore. A serial that has a CiteScore Percentile of 96% is ranked according to CiteScore as high or higher than 96% of serial titles in that category.
CiteScore Percentile is calculated by taking all serial titles with CiteScores in a particular subject field, and ordering them by their CiteScore from high to low. CiteScore Percentile for a serial title S, is calculated by applying the equation:
CiteScore Percentile of S = [ (L + (0.5 x S) ) / N ] x 100
Where
- L = number of serial titles in subject field with a CiteScore lower than X
- S = number of serial titles in the subject field with CiteScore X
- N = total number of serial titles in the subject field with any CiteScore
This method does not give a 100th percentile rank. Scopus rounds down to the nearest whole figure in displaying these percentiles, in line with the spirit of this calculation method.
Consider the fictional example illustrated in the table below. The serial titles in this subject field have been ranked from high to low according to their CiteScores.
- For Proceedings C:
- CiteScore = 1.79
- L = 26 (there are 26 serials with a CiteScore lower than 1.79)
- S = 1 (only Proceedings C in this subject field has a CiteScore of 1.79)
- N = 29 (there are 29 serials in this subject area)
- CiteScore Percentile Rank of Proceedings C = [ (26 + (0.5 x 1)) / 29 ] x 100 = 91%
- For Journal X:
- CiteScore = 0.39
- L = 5 (there are 5 serials with a CiteScore lower than 0.39)
- S = 2 (Journal W in this subject field also has the same CiteScore of 0.39)
- N = 29 (there are 29 serials in this subject area)
- CiteScore Percentile Rank of Journal X = [ (5 + (0.5 x 2)) / 29 ] x 100 = 20%
Serial title | CiteScore | Rank | CiteScore Percentile |
|---|---|---|---|
Proceedings A | 2.14 | 1 | 98% |
Journal B | 1.87 | 2 | 94% |
Proceedings C | 1.79 | 3 | 91% |
Journal D | 1.53 | 4 | 87% |
Journal E | 1.51 | 5 | 84% |
Journal F | 1.45 | 6 | 81% |
Journal G | 1.39 | 7 | 77% |
Journal H | 1.38 | 8 | 74% |
Journal I | 1.35 | 9 | 70% |
Journal J | 1.29 | 10 | 67% |
Proceedings K | 0.99 | 11 | 63% |
Proceedings L | 0.97 | 12 | 60% |
Proceedings M | 0.94 | 13 | 56% |
Journal N | 0.89 | 14 | 53% |
Journal O | 0.72 | 15 | 50% |
Journal P | 0.68 | 16 | 46% |
Journal Q | 0.59 | 17 | 43% |
Journal R | 0.57 | 18 | 39% |
Journal S | 0.52 | 19 | 36% |
Proceedings T | 0.51 | 20 | 32% |
Journal U | 0.46 | 21 | 29% |
Proceedings V | 0.42 | 22 | 25% |
Journal W | 0.39 | 23 | 20% |
Journal X | 0.39 | 23 | 20% |
Journal Y | 0.36 | 25 | 15% |
Journal Z | 0.32 | 26 | 10% |
Proceedings A1 | 0.32 | 26 | 10% |
Journal B1 | 0.15 | 28 | 5% |
Journal C1 | 0.00 | 29 | 0% |
Note that a journal has one CiteScore, but a different CiteScore Percentile for each subject field it is indexed in. The highest CiteScore Percentile is shown for a serial title by default, and you can investigate a serial title's relative position in the various subject fields it is part of in Scopus.com.
Note that there is an alternative and slightly simpler method that does not use the value S. It indicates the percentage of scores that fall below a given score, rather than the percentage of scores that fall at and below a given score, as implemented here. The results differ only for tied titles.
Note: in SciVal when you export the CiteScore percentile values in SciVal, the metrics refer to the top percentile. This means that in Scopus a journal in the 98th percentile, will be shown as the top 2% in SciVal.
In SciVal when you export the CiteScore percentile values in SciVal, the metrics refer to the top percentile. This means that in Scopus a journal in the 98th percentile, will be shown as the top 2% in SciVal.
Did we answer your question?
Related answers
Recently viewed answers
Functionality disabled due to your cookie preferences