
View by category
SciVal Metric: Publications in Top Journal Percentiles
Last updated on November 15, 2024
Also available in
 Back to all metrics
Publications in Top Journal Percentiles in SciVal indicates the extent to which an entity’s publications are present in the most-cited journals in the data universe: how many publications are in the top 1%, 5%, 10% or 25% of the most-cited journals indexed by Scopus?
The most-cited journals are defined by the journal metrics CiteScore, SNIP (Source-Normalized Impact per Paper) or SJR (SCImago Journal Rank). This means that the data universe is the set of items indexed by Scopus that have a journal metric and so can be organized into percentiles; this excludes publications in stand-alone books and trade publications, which do not have journal metrics.
How is this calculated?
We look at all of the publications in your selected year range and identify the journals in which they are published. From the journals we can determine in which percentiles the publications belong.
Note: we only calculate this metric for publications that have journal metrics. As a result, you may see a smaller publication count for your percentile than you were expecting. Learn more
All items indexed by Scopus that have a CiteScore, SNIP or SJR value form the data universe used to generate this metric:
- The CiteScore, SNIP or SJR values at the thresholds of the top 1%, 5%, 10% and 25% most-cited journals in Scopus per Publication Year are calculated. It is possible that the same journal metric value received by the indexed item at, say, the 10% boundary has been received by more than 10% of indexed items; in this case, all items with this journal metric value are counted within the top 10% of the data universe, even though that represents more than 10% items by volume. This is less likely to happen than for the Outputs in Top Citation Percentiles thresholds, because the journal metrics are generated to 2 or 3 decimal places which reduces the chance of items having the same value.
- These thresholds are calculated separately for CiteScore, SNIP and SJR, not once for a combination of both journal metrics.
- For CiteScore and SJR, the percentage thresholds are taken directly from the CiteScore Percentile values that are calculated by Scopus and the SJR percentile values as calculated by the Scimago Journal Rank. A journal receives a CiteScore and SJR Percentile for each ASJC in which it’s categorized. SciVal always uses the highest relevant CiteScore or SJR Percentile, which is dictated by the subject area filter.
- SciVal uses these journal metric thresholds to calculate the number of an entity’s publications within indexed items that fall within each percentile range.
- Indexed items have multiple journal metric values, for distinct years. Which one is used in assigning publications to journal metrics thresholds?
- The journal metric value matching the publication year of an item of scholarly output is used as far as possible.
- The first journal metric values for SNIP and SJR are available for 1999. For scholarly output published in the range 1996-1999, the journal metric value for 1999 is used.
- The first journal metric values for CiteScore are available for 2011. For scholarly output published in the range 1996–2010, the CiteScore Percentile value for 2011 is used. If no 2011 metrics are available for the journal, then no value is displayed.
- Current year journal metric values are published during the course of the following year. For recent items whose journal metric values have not yet been published, the previous year’s journal metric values are used until the current year’s become available.
- A publication may be counted in the Top Journal Percentiles without itself ever having been cited. The citations received by an individual publication are irrelevant for this metric, which is based only on citations received by a journal or conference proceedings.
SNIP and SJR are both field-normalized journal metrics, meaning that this metric can be used to compare the presence of publications in journals of entities working in different disciplines. The CiteScore Percentile allows a similar comparison across disciplines.
Why do some publications have no journal metrics?
The three journal metrics included in SciVal (CiteScore, SNIP and SJR) are all calculated once a year in June using Scopus data. In the months following the calculation, new journals are added to Scopus, which will not be given any journal metrics until the next calculation in June. As a result, not all publications will belong to journals that have journal metrics.
For Publications in Top Journal Percentiles, not all publications belong to journals that have journal metrics and we only calculate this metric for publications that do have journal metrics.
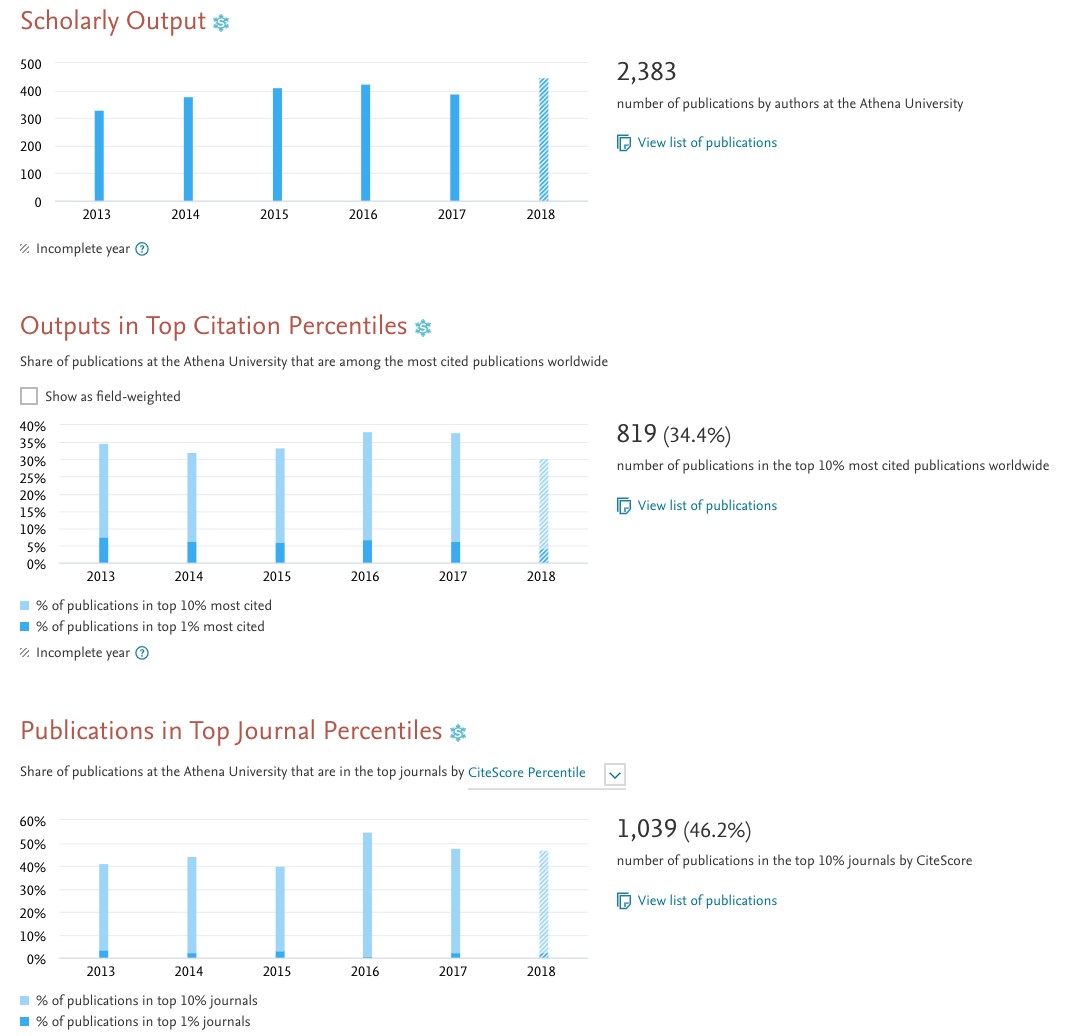
In the example below, at first glance the percentage value for Publications in Top Journal Percentiles appears too high, when compared to Outputs in Top Citation Percentiles, but that is just because not all of the articles belong to journals that have journal metrics.
Do the following to check how many publications are included in the calculation:
Outputs in Top Citation Percentiles:
Using the example screenshots below, there are:
- 2,383 Scholarly Outputs, with
- 819 (34.4%) in the top 10% Citation Percentile
If we multiply 819 by the percentage of articles that are in the top 10% - which is 34.4% or for the calculation 0.344, we get:
819/0.344 = 2380 publications (which is the same as the Scholarly Output when rounding errors are accounted for).
Publications in Top Journal Percentiles:
Let's calculate how many publications are being considered by this calculation. To do this we need to divide the number of Scholarly Outputs in the Top Journal Percentile (1,039) by the percentage that made the Top Journal Percentile (46.2% or for the calculation 0.462)
1,039/0.462 = 2,249 publications. This means there are roughly 134 publications that belong to journals with no journal metrics, which is why the percentage value looks relatively high when compared to the Outputs in Top Citation Percentiles.
 Publications in Top Journal Percentiles is a:
- Citation Impact metric
- “Power Metric” when the “Total value” option is selected, but not when the “Percentage” option is selected
SciVal often displays Publications in Top Journal Percentiles in a chart or table with years. These years are always the years in which items were published, and do not refer to the years in which citations were received.
- Benchmark entities even if they have different sizes and disciplinary profiles:
- It is advised to select the “Percentage” option when comparing entities of different sizes, to normalize for this variable.
- SNIP and SJR are field-normalized metrics. CiteScore is not a field-normalized metric, but the CiteScore Percentile (used for the calculation of the Publications in Top Journal Percentiles) is. Selecting one of these journal metrics will inherently account for differences in the behavior of academics between fields.
- Showcase the presence of publications in journals that are likely to be perceived as the most prestigious in the world
- Incorporate peer review into a metric, since it is the judgment of experts in the field that determines whether a publication is accepted by a particular journal or not
- Avoid the “dip” in recent years seen with metrics like Citation Count and Citations per Publication
- Investigate performance very early in a new strategy, or for an early-career researcher, since journal data underpin this metric, and not the citations received by individual publications themselves which would require time to accumulate
- The objective is to judge an entity’s publications based on their actual performance, rather than based on the average of a journal:
- A publication may appear in a journal with a very high CiteScore, SNIP or SJR value, and not itself receive any citations; even the most highly cited journals in the world contain publications that have never been cited.
- A publication may be very influential and have received many citations, without being published in a journal with a high CiteScore, SNIP or SJR value; journals which do not rank very highly in the data universe may still contain very highly cited publications.
- Benchmarking the performance of a Researcher who is the editor of a journal in the top percentiles, since they can publish multiple editorials which all fall into these top percentiles. In this situation, it is advised to use the Publication Type filter to exclude editorials and ensure that the types of publications in the data sets being compared are consistent.
- Entities are small and there may be gaps in their output within the Scopus coverage. A single missing publication from a small data set will have a significant negative impact on apparent performance. Although it is relatively unlikely that publications in such prominent journals are not indexed by Scopus, we advise users to be vigilant and to bear this possible limitation in mind.
- Citation Countopens in new tab/window, Citations per Publicationopens in new tab/window, Field-Weighted Citation Impactopens in new tab/window, and Outputs in Top Citation Percentiles opens in new tab/windowwhich rely on the citations received by an entity’s publications themselves, and not on the average performance of the journal
- Outputs in Top Citation Percentilesopens in new tab/window, which indicates the extent to which an entity’s publications are present in the most-cited percentiles of the data universe, but depends on the citations received by the publications themselves. This is a logical partner metric.
- The set of all other “Power Metrics” whose value tends to increase as the entity becomes bigger: Scholarly Output, Subject Area Count, Scopus Source Title Count, Citation Count, Cited Publications (“Total value”), Number of Citing Countries, Collaboration (“Total value”), Academic-Corporate Collaboration (“Total value”), Outputs in Top Citation Percentiles (“Total value”), and h-indices
- The set of all other “time-independent metrics”, which provide useful, reliable information immediately upon publication and do not rely on the passing of time for useful data to accumulate: Scholarly Output, Subject Area Count, Scopus Source Title Count, Collaboration, and Academic-Corporate Collaboration
Did we answer your question?
Related answers
Recently viewed answers
Functionality disabled due to your cookie preferences