
View by category
Times Higher Education World University Rankings - THE WUR
Last updated on November 15, 2024
Also available in
The underlying bibliometric datasets are available for the ranking years 2021, 2022 and 2023.
For more information on the THE World University Rankings (WUR), please visit the THE web siteopens in new tab/window. Details of the criteria for participation, submission requirements and calculations can be found in the THE WUR methodology documentopens in new tab/window.
Ranking enhancements in the Overview module
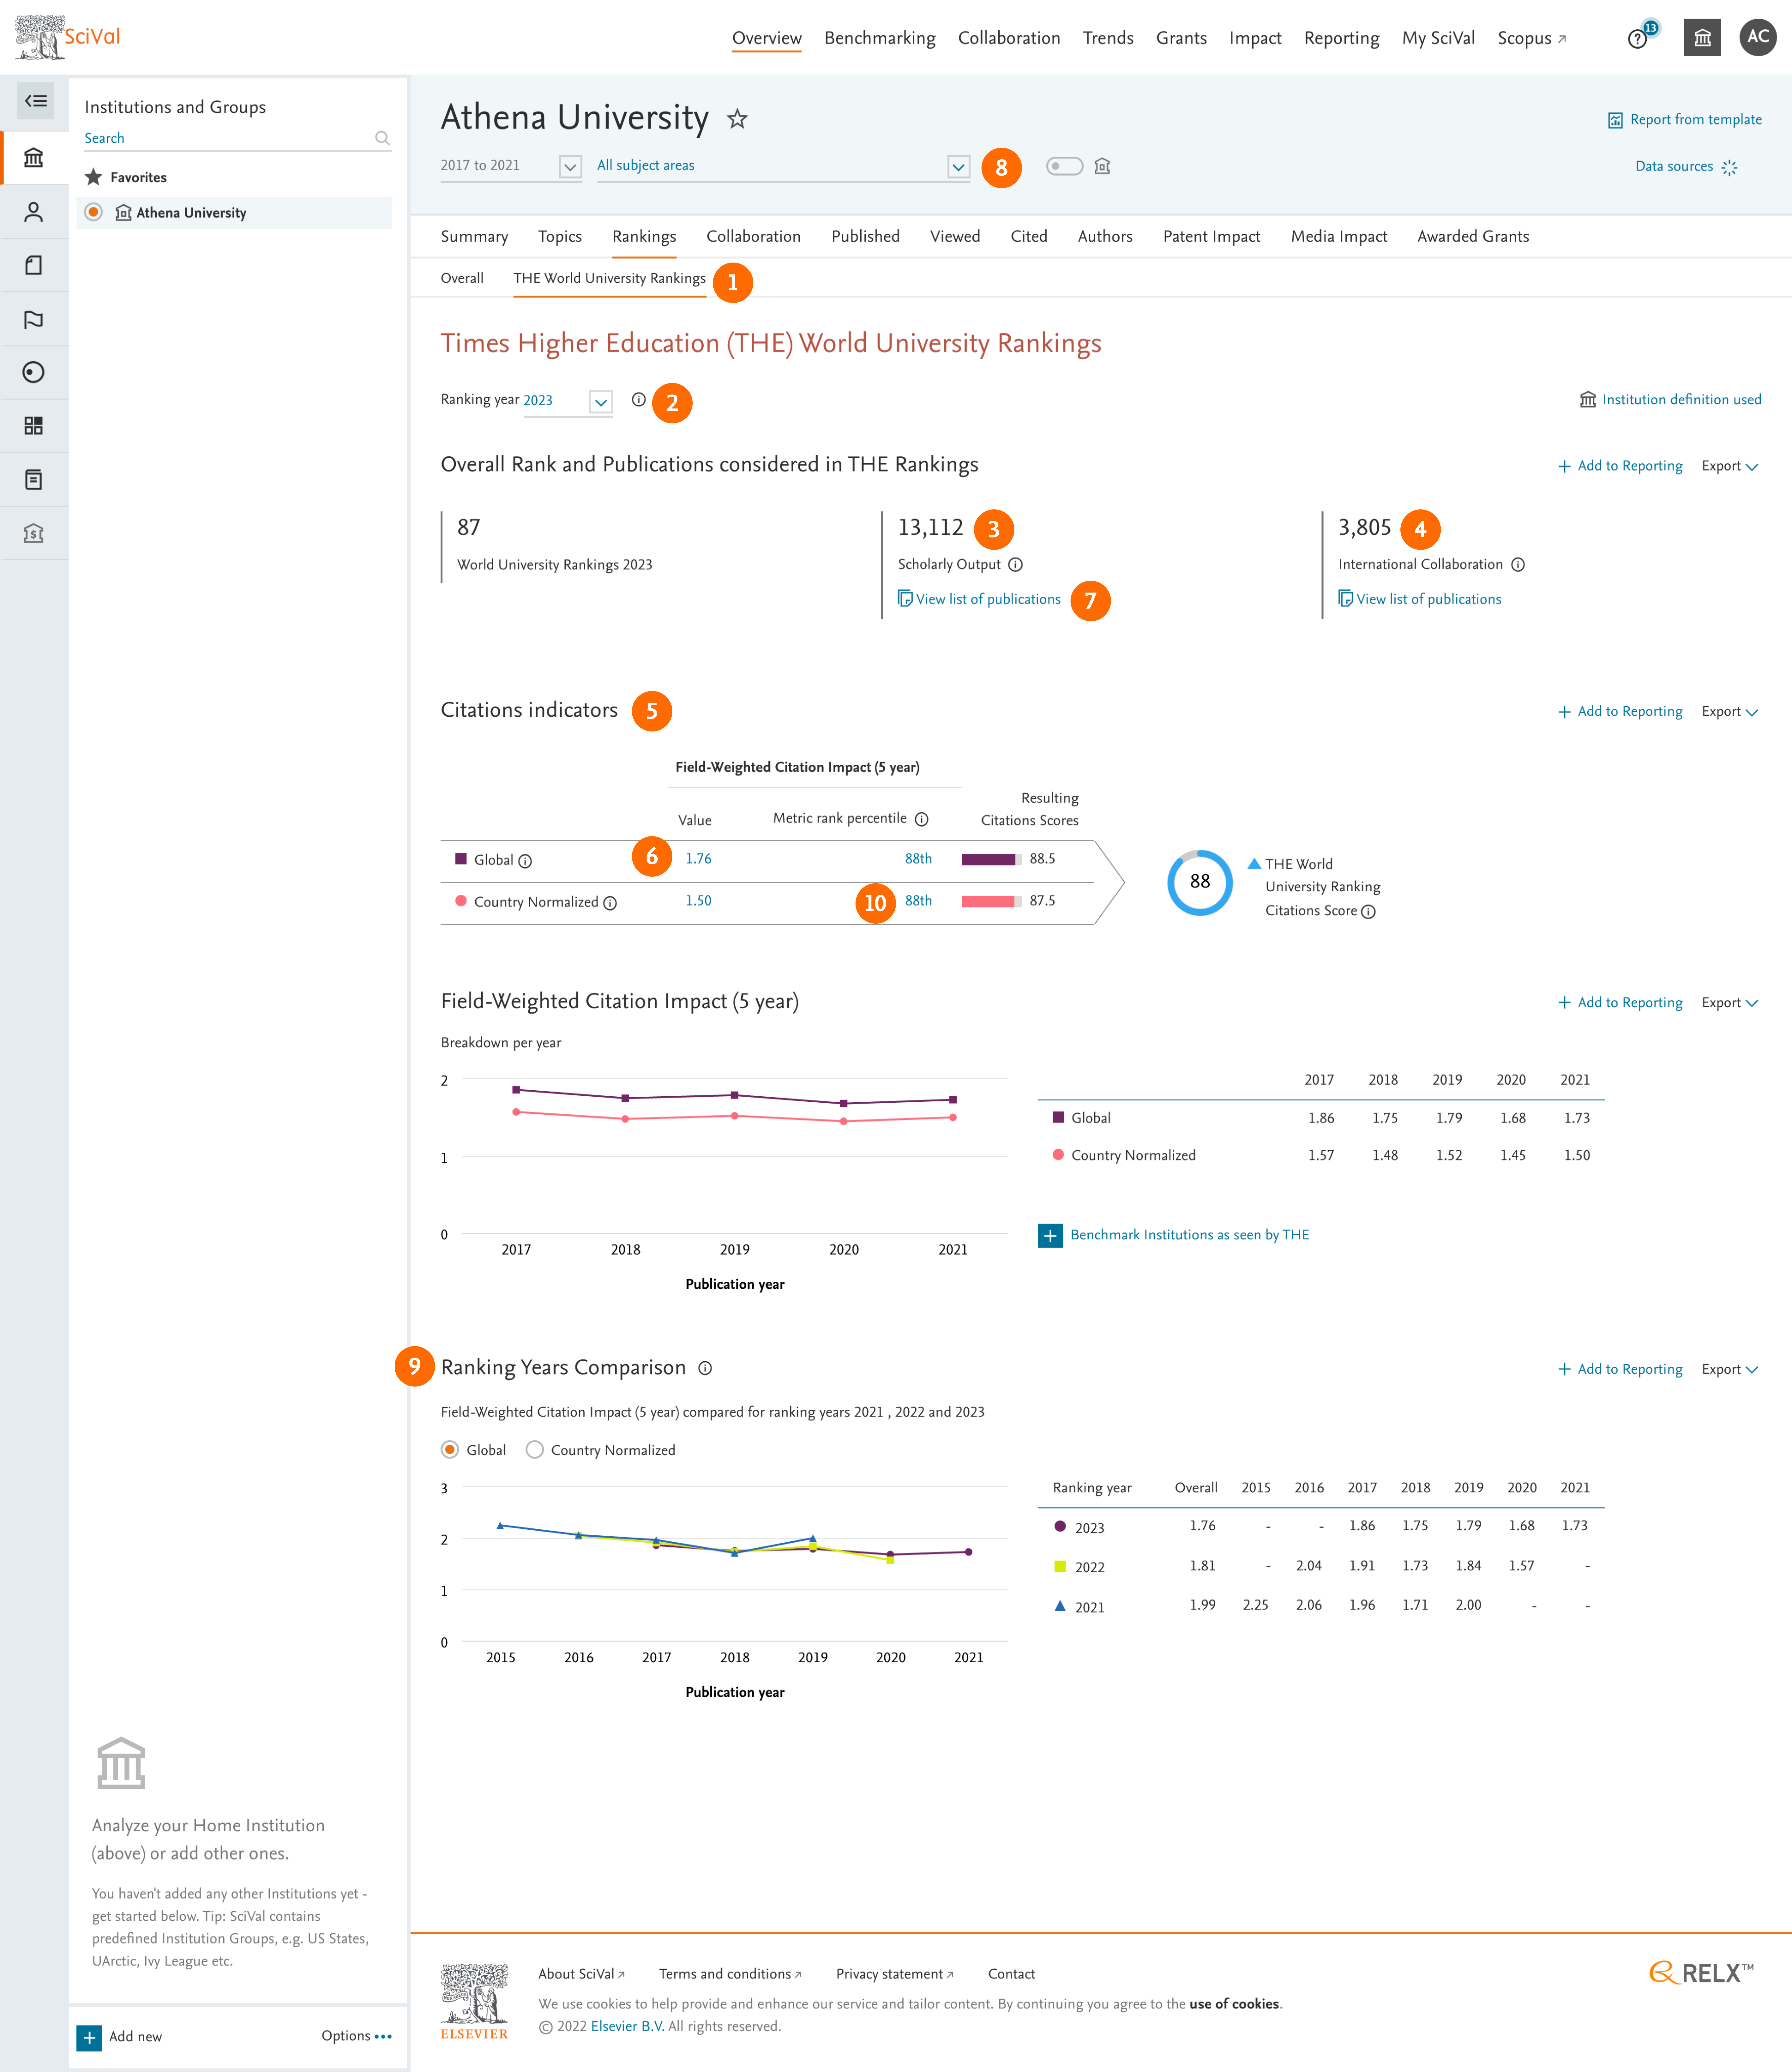
- “THE World University Rankings” tab in 'Rankings' helps SciVal customers:
- Generate insights based on the actual Scholarly Output and International co-authorship data used in the THE WUR, removing the need to export and generate the dataset manually.
- Analyze, understand and generate insights based on the actual FWCI’s and Citation Scores used in 30% of the THE WUR, rather than proxies developed in-house.
- Analyze the trends in the bibliometric drivers to enrich your understanding and inform plans accordingly.
- Switch between three ranking years 2021, 2022 and 2023. Learn more
- Scholarly Output considered in THE Rankings
- THE’s Research Productivity indicator – contributing 1/5 of the Research Score and 6% of the Overall Ranking Score – is based on the Scholarly Output (eligible document types include articles, reviews, conference proceedings, books and book chapters) published in sources indexed by Scopus® per institution. Learn more opens in new tab/window
- International Collaboration considered in THE Rankings
- THE’s International Collaboration indicator – contributing 1/3 of the International Outlook Score and 2.5% of the Overall Ranking Score – is calculated as the proportion of a university’s total publications that have at least one international co-author and is also subject normalized to account for differing subject profiles for universities. Learn more opens in new tab/window
- Citation indicators considered in THE Rankings
- The Citations indicators – THE Citations Score, Global Citations Score, Country Normalized Citations Score, Global FWCI and Country Normalized FWCI – are based on 5-year Field-Weighted Citation Impact (FWCI) data calculated using the snapshot of Scopus data provided around May/June each year.
- The final Citations Score in the ranking is the average of the Global Citations Score and Country Normalized Citations Score. Learn more opens in new tab/window
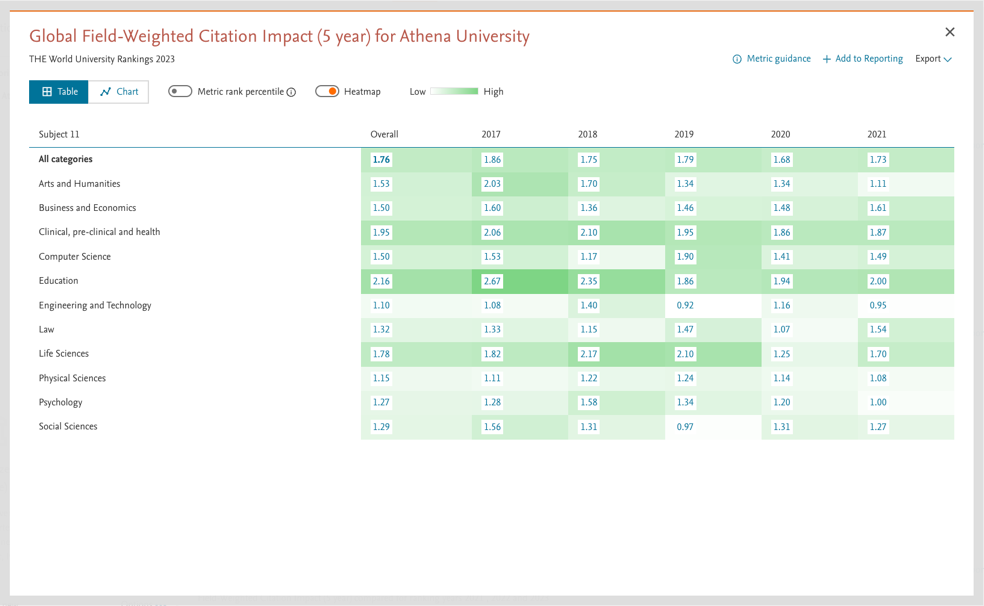
- FWCI trend (FWCI modal) – You can view the 5-year trend of the university’s Global or Country Normalized FWCI’s per subject area by clicking on a FWCI value. You can switch between a table view and a chart view.
- List of publications underlying Scholarly Output or International Collaboration
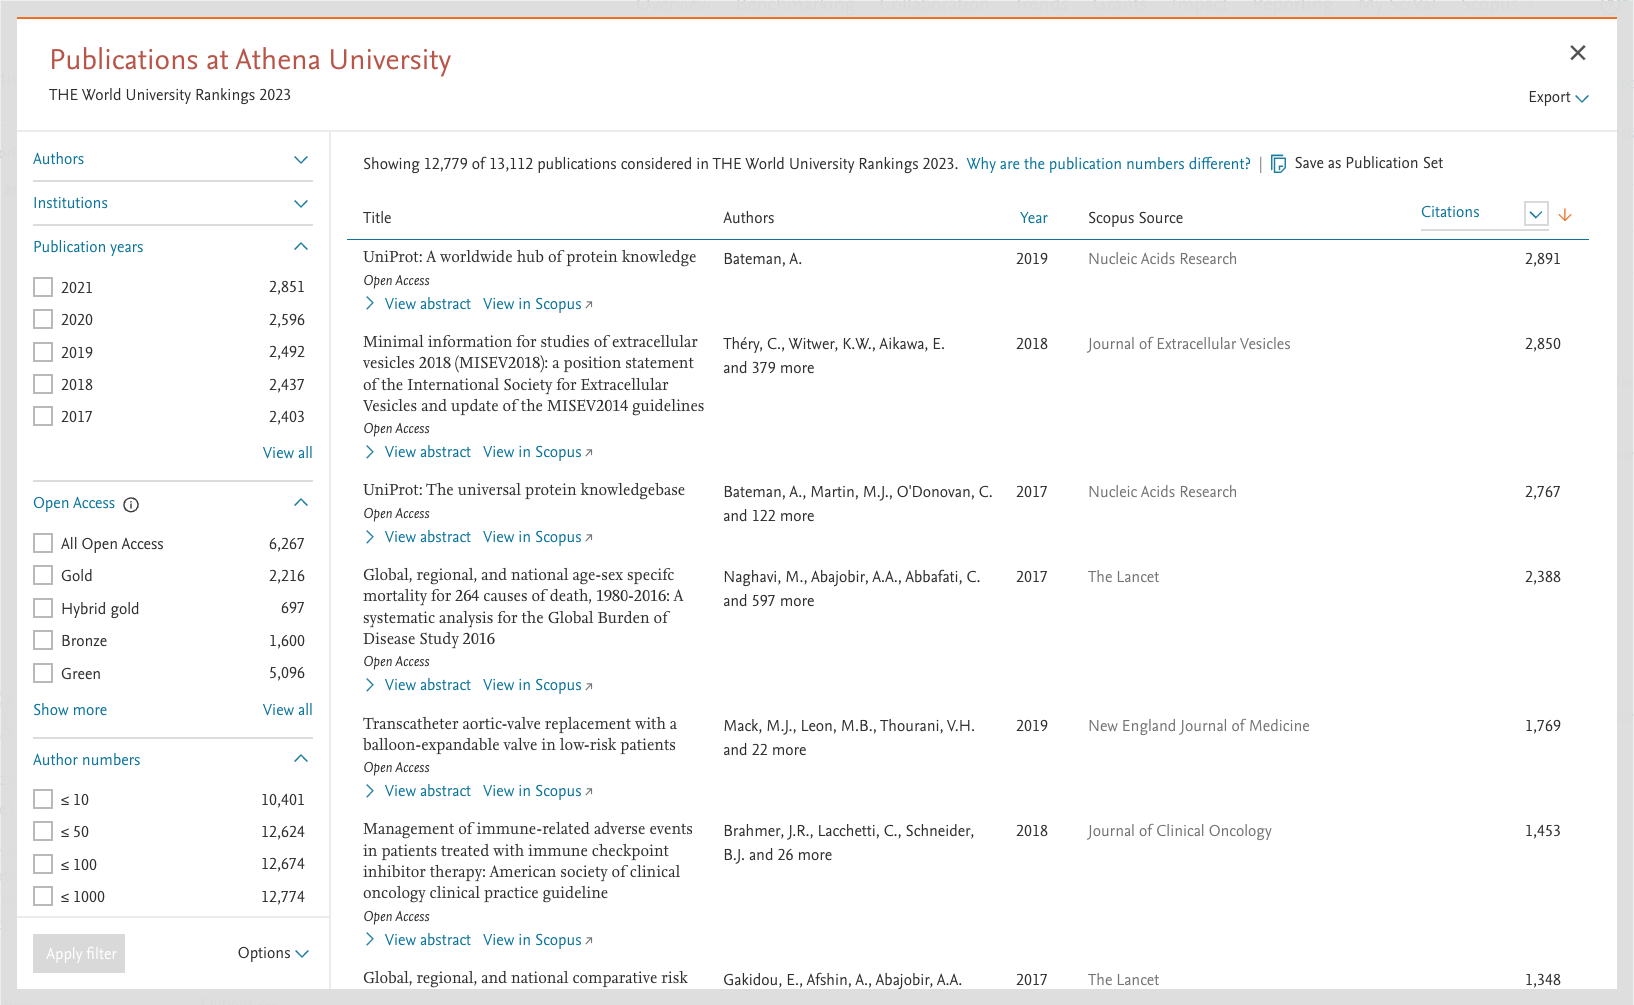
- Clicking on a “view list of publications” link launches a modal in which the publications underlying the Scholarly Output or International Collaboration are shown.
- For further analysis, you can export the publications into a spreadsheet or save the list as a Publication Set.
- You can see publications for a specific subject area and/or year by clicking on an FWCI in the FWCI modal (see 6).
- Filter the metrics on the page using sub-categories of the THE subject classification, for example Engineering and Technology and see its impact on the overall FWCI and ranking.
- Only the THE subject classification is available as other ones are not relevant for THE World University Rankings.
- In addition, 2015-2019, 2016-2020 and 2017-2021 are the only available year ranges for ranking years 2021, 2022 and 2023, respectively. We do not have data for previous years’ rankings yet.
- Analyze the changes in FWCI values to get insights into changes in ranking scores.
Gain insight into the underlying drivers of changes in ranking scores through access to the global and country-normalized FWCI (5 year) values for each publication year considered in three ranking years (2021, 2022, and 2023). - Understand the relative performance of a university in FWCI (5 year) through their metric rank percentile.
The metric rank percentile of FWCI (5 year) for a university shows where it stands in comparison with the other participating universities. For example, the 99th percentile is equivalent to the top 1%.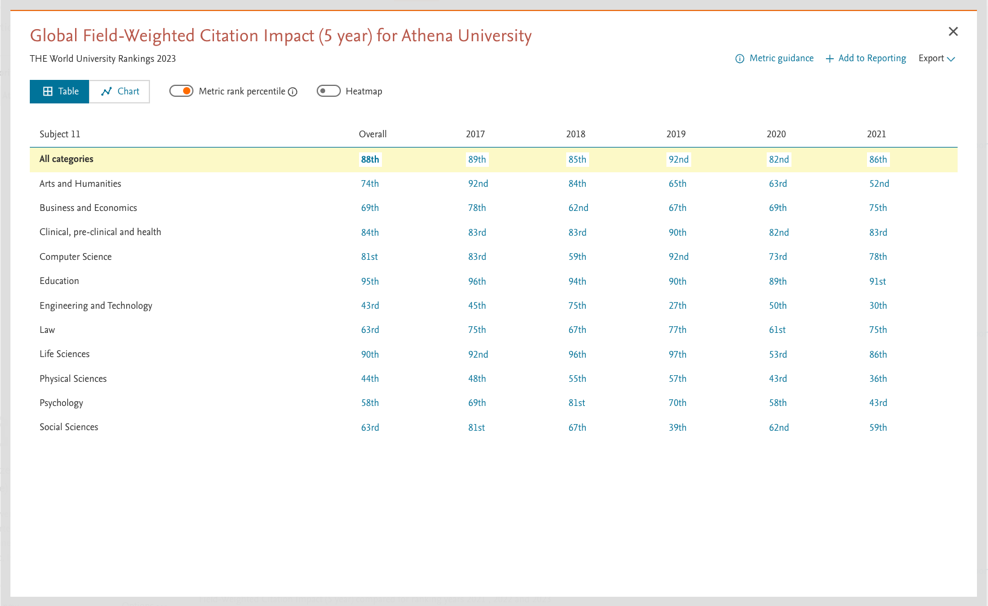
Did we answer your question?
Related answers
Recently viewed answers
Functionality disabled due to your cookie preferences