
View by category
 Back to all metrics
Relative Activity Index (RAI) is defined as the share of an entity's publications in a subject area, relative to the global share of publications in the same subject. A value of 1.0 indicates that the entity's research activity in a field corresponds exactly with the global activity in that field; a value higher than 1.0 implies a greater emphasis; and a value lower than 1.0 suggests a lesser focus.
For the Sustainable Development Goals (SDGs), the RAI is calculated by looking at the total publications an entity has for an SDG, divided by the total publications for the same entity, to create a percentage. The same calculations are done for each SDG for the World. The index for the entity is calculated by dividing the entity's percentage by that of the World.
Below is an example of how the RAI was calculated for the Worlds, which provides the index of 1.00, vs the UK and Athena University:
UK SDG 1 percentage is (10539/1371780)*100 = 0.77%
UK SDG 1 Index is 0.77 / 0.43 = 1.79
World |
|
| UK |
|
| Athena University |
| ||
|
|
|
|
|
|
|
|
|
|
Total publications (all) | 20561586 | Percentage | Index | 1371780 | Percentage | Index | 14899 | Percentage | Index |
SDG 1: No Poverty (2021) | 89322 | 0.43% | 1.00 | 10539 | 0.77% | 1.79 | 70 | 0.47% | 1.08 |
SDG 2: Zero Hunger (2021) | 235338 | 1.14% | 1.00 | 15359 | 1.12% | 0.98 | 82 | 0.55% | 0.48 |
SDG 3: Good Health and Well-being (2021) | 2744271 | 13.35% | 1.00 | 194444 | 14.17% | 1.06 | 1980 | 13.29% | 1.00 |
SDG 4: Quality Education (2021) | 256269 | 1.25% | 1.00 | 19716 | 1.44% | 1.15 | 218 | 1.46% | 1.17 |
SDG 5: Gender Equality (2021) | 164146 | 0.80% | 1.00 | 18785 | 1.37% | 1.72 | 142 | 0.95% | 1.19 |
SDG 6: Clean Water and Sanitation (2021) | 322868 | 1.57% | 1.00 | 13269 | 0.97% | 0.62 | 187 | 1.26% | 0.80 |
SDG 7: Affordable and Clean Energy (2021) | 881746 | 4.29% | 1.00 | 43090 | 3.14% | 0.73 | 912 | 6.12% | 1.43 |
SDG 8: Decent Work and Economic Growth (2021) | 278312 | 1.35% | 1.00 | 23323 | 1.70% | 1.26 | 335 | 2.25% | 1.66 |
SDG 9: Industry, Innovation and Infrastructure (2021) | 487131 | 2.37% | 1.00 | 32918 | 2.40% | 1.01 | 506 | 3.40% | 1.43 |
SDG 10: Reduced Inequality (2021) | 287826 | 1.40% | 1.00 | 29769 | 2.17% | 1.55 | 235 | 1.58% | 1.13 |
SDG 11: Sustainable Cities and Communities (2021) | 429894 | 2.09% | 1.00 | 27416 | 2.00% | 0.96 | 462 | 3.10% | 1.48 |
SDG 12: Responsible Consumption and Production (2021) | 258875 | 1.26% | 1.00 | 17100 | 1.25% | 0.99 | 430 | 2.89% | 2.29 |
SDG 13: Climate Action (2021) | 299957 | 1.46% | 1.00 | 26914 | 1.96% | 1.34 | 351 | 2.36% | 1.61 |
SDG 14: Life Below Water (2021) | 185383 | 0.90% | 1.00 | 13586 | 0.99% | 1.10 | 72 | 0.48% | 0.54 |
SDG 15: Life on Land (2021) | 227919 | 1.11% | 1.00 | 18451 | 1.35% | 1.21 | 72 | 0.48% | 0.44 |
SDG 16: Peace, Justice and Strong Institutions (2021) | 250758 | 1.22% | 1.00 | 31756 | 2.31% | 1.90 | 241 | 1.62% | 1.33 |
The RAI is displayed in SciVal as a Cobweb Chart:
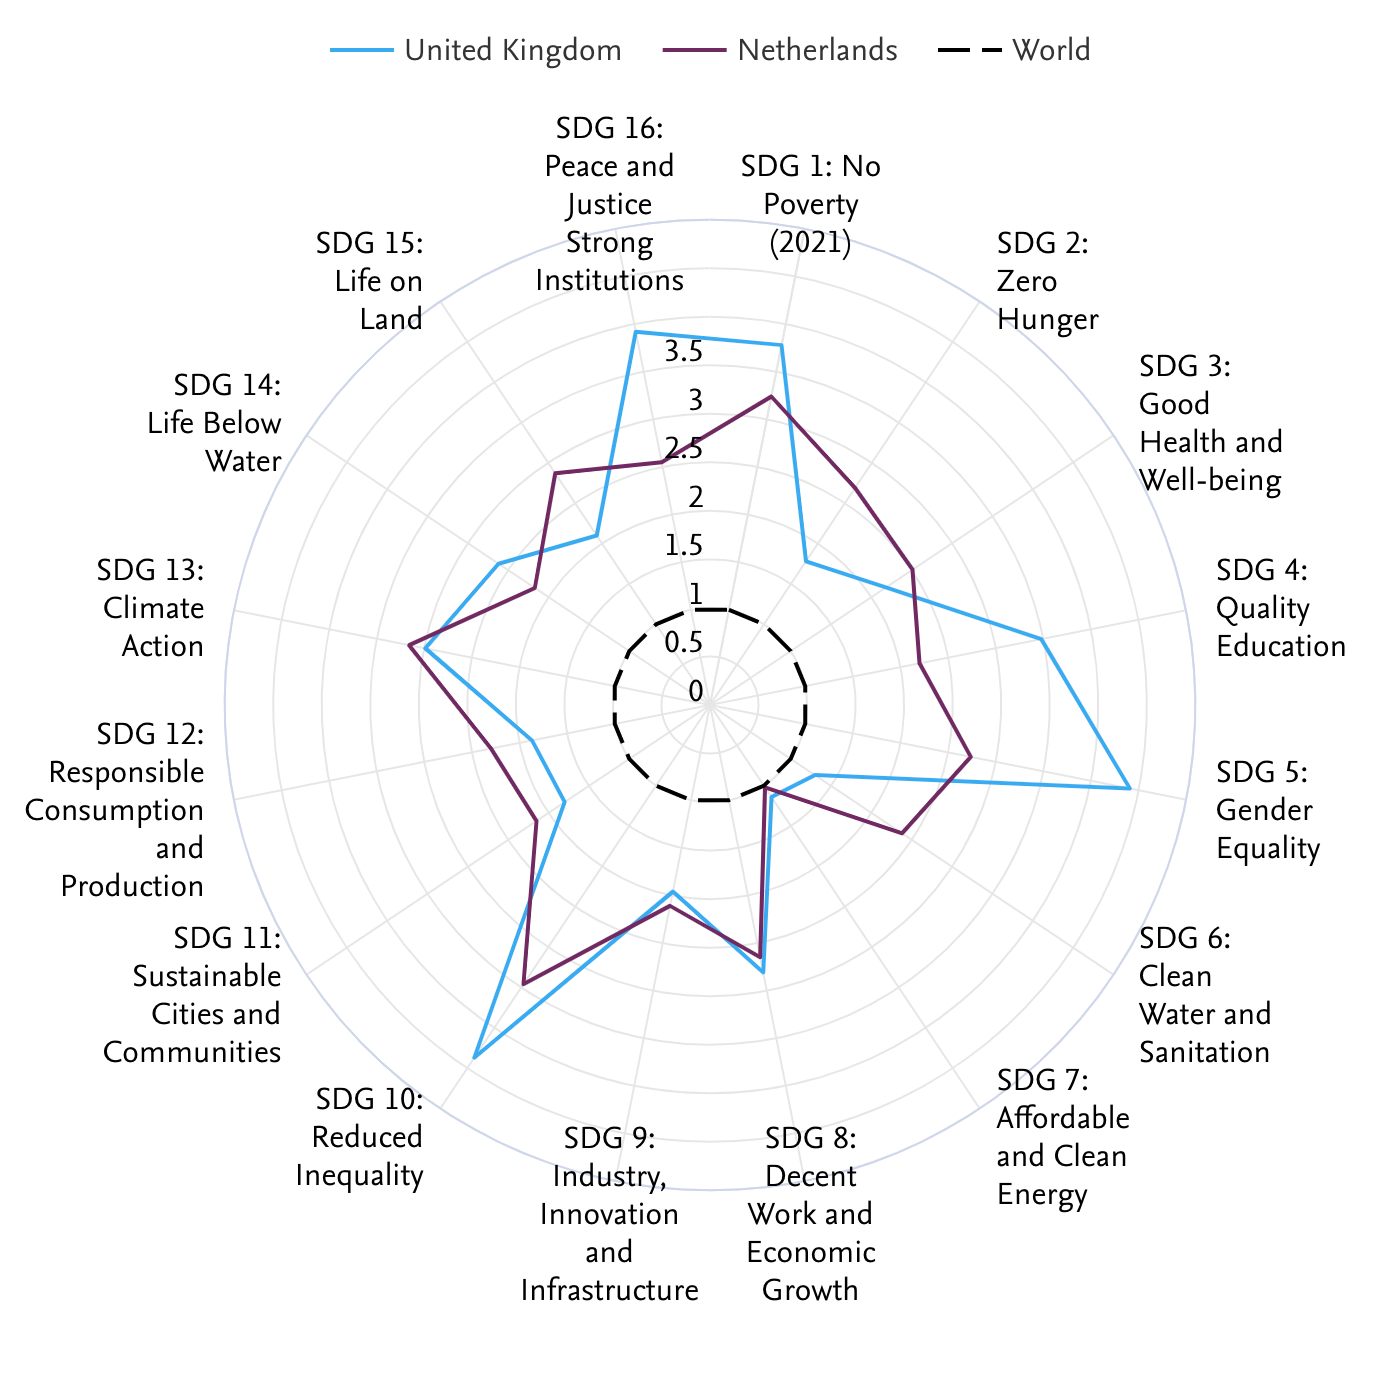
- Compare the activity of one entity in the SDGs to another. Such as comparing a British university to the UK and World
- Normalise the outputs of the SDGs so you can compare the relative activity in one SDG to the others. For example, SDG 3 - Good Heatth and Well-Being has the most publications globally and usually dominates charts when looking at raw scholarly output. The RAI helps to normalize this so that SDG 3 can be compared to the other SDGs.
- Understand if you're entity's SDG output is more or less than the relative world or country output
- Benchmarking the scholarly output of entities with distinct disciplinary profiles:
- Academics in distinct fields tend to publish with very different frequencies. For example, life sciences generally publish with high frequency, than academics in humanities, who tend to publish with low frequency.
- When comparing entities made up of a mixture of disciplines, such as an Institution or a Country. Ensure you compare like for like SDGs against each other and compare the overall patterns the vizualisation in SciVal provides.
- Comparing the results in SciVal with other tools using different SDG mapping methodologies.
- There can be very large differences in mapping methods and therefore in the resulting publications per SDG.
- opens in new tab/windowCitations per Publication opens in new tab/windowand Field-Weighted Citation Impactopens in new tab/window, which bring complementary perspectives into view on total visibility, and also account for differences in the size of entities being compared. Field-Weighted Citation Impact also accounts for differences in publication and citation behavior between disciplines.
- Scholarly Output of the SDGs, helps see the total value per SDG, compared to the indexed value
Did we answer your question?
Related answers
Recently viewed answers
Functionality disabled due to your cookie preferences