Release notes for November 2023
Last updated on March 08, 2026
Release notes for Bioactivity Visualization Export
Addition of new layout for the Bioactivity Visualization excel export
In order to better support bioactivity data screening, competitive and novelty search analysis, we have added a new layout for the Bioactivity Visualization MS Excel export format, in addition to the old excel format. This new format aims to reduce the post-export formatting time and will also provide richer insights into the Target and Bioactivity workflows. The new layout will be the default export format and other formats like the old Microsoft excel, XML, Molfile, etc. may be selected from the ‘Choose a format’ modal.
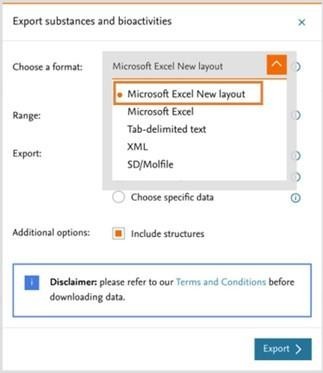
Below are the details of the improvements made on the new layout of the Microsoft Excel format.
Maintaining the user interface view in the excel export
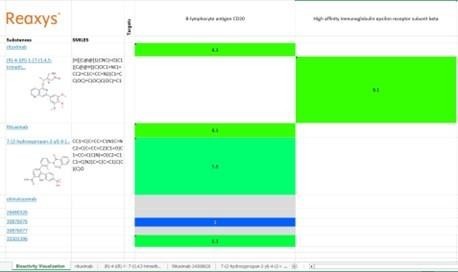
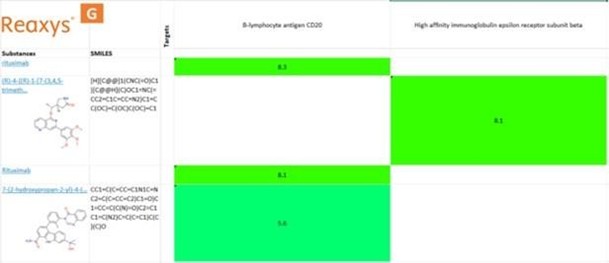
With the new excel export layout, you will be able to export the bioactivity visualization with the same view (including the color coding and values in the cells) as on the Reaxys.com user interface. The display would be chemical substances (Y-axis) vs biological targets (X-axis) and activity potency as pX (Cells).
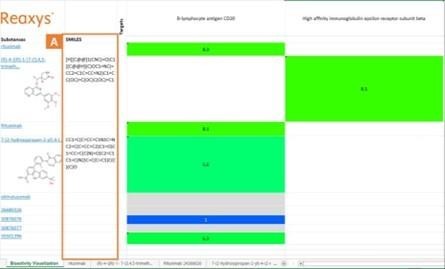
New SMILES column
A new column has been added for the SMILES of the corresponding substance (A).
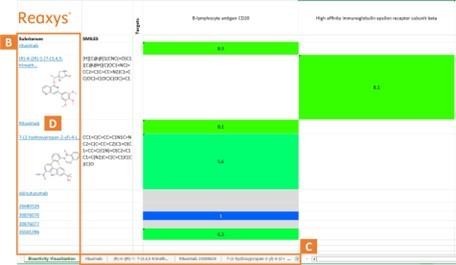
New substance tab for individual substances in the Bioactivity Visualization
Every substance (B) in the Bioactivity Visualization will have a separate substance tab (C) to have access to a more detailed view on individual substance and its associated data. Each substance on the main excel sheet will also contain a clickable link (D) that leads to the individual substance tab. Please note that these substance tabs will only be generated when substance is chosen as one of the values (either X or Y- axis) when generating the Bioactivity Visualization.
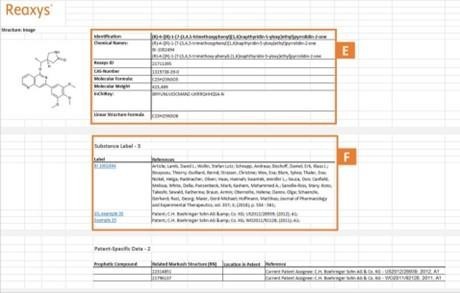
Structured data present at each substance tab on the Excel
The individual substance tab will contain detailed information on substance identification, chemical name(s), Reaxys ID, CAS number, molecular weight, molecular formula, etc. We have also included the substance label information to support your patent analysis use case (F).
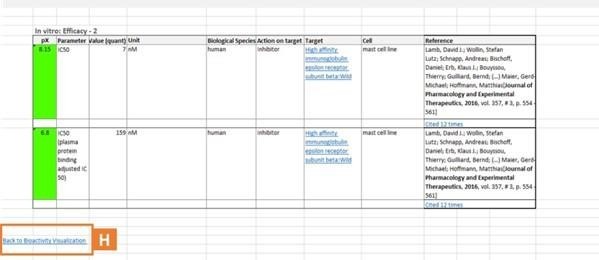
In order to go back to the main 'Bioactivity Visualization' page, one can either click on the Reaxys logo (G) on top of the page or 'Bioactivity Visualization' (H) on the bottom of the page.
Did we answer your question?
Related answers
Recently viewed answers
Functionality disabled due to your cookie preferences