
View by category
The h5-index uses a 5-year publication and citation window on the standard h-index calculation and can be used to fairly track the metric over time in Compare. The h5-index for an entity in 2019 takes the outputs published by that entity from 2015-2019 and the citations received by those outputs in the same time window, to form a data set. It then uses the h-index calculation on the data set to compute the h5-index.
h-index gives information about the performance of Researchers and Research Areas. The h-index of an entity is 9 if the top 9 most-cited publications for that entity have each received at least 9 citations; it is 13 if an entity’s top 13 most-cited publications have each received at least 13 citations; and so on.
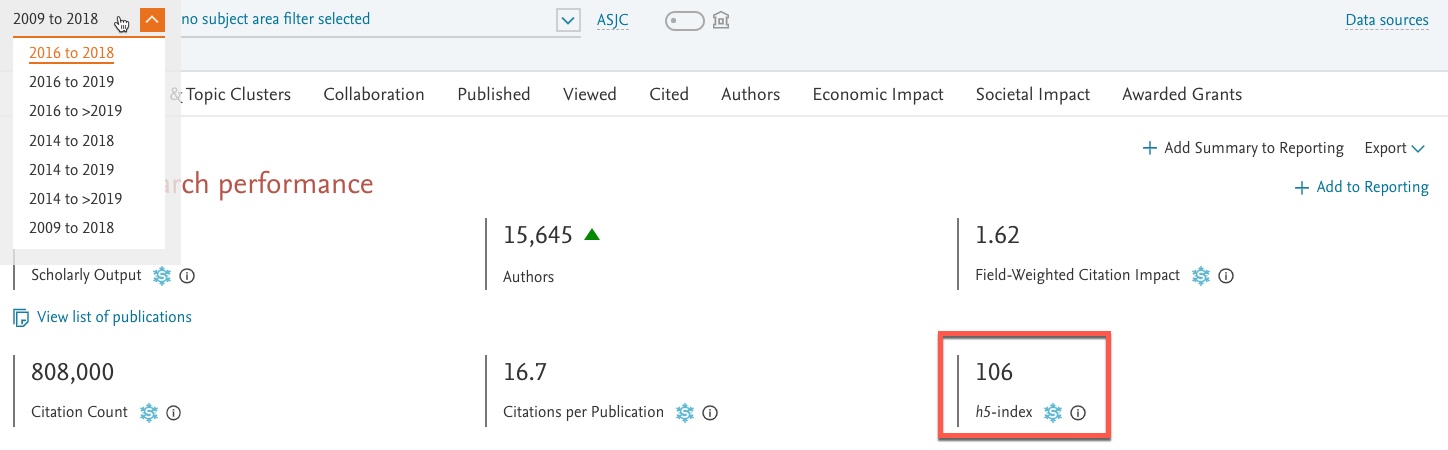
The h5-index in Overview for an entity is always using publication and citation information from the last 5 complete years in your chosen year range. A year is considered complete, 6 months into the following year. For example, 2025 was considered complete in June 2026.
So, if in January 2026, you choose the year range, 2011 to 2026, the h5-index uses the date range 2011 – 2025, as 2026 is not yet considered a complete year until around June 2026. Learn more about incomplete yearsopens in new tab/window. As a result in Overview, the h5-index will always be calculated based upon the final complete year in your range. In our example, that would be an h5-index from 2025.
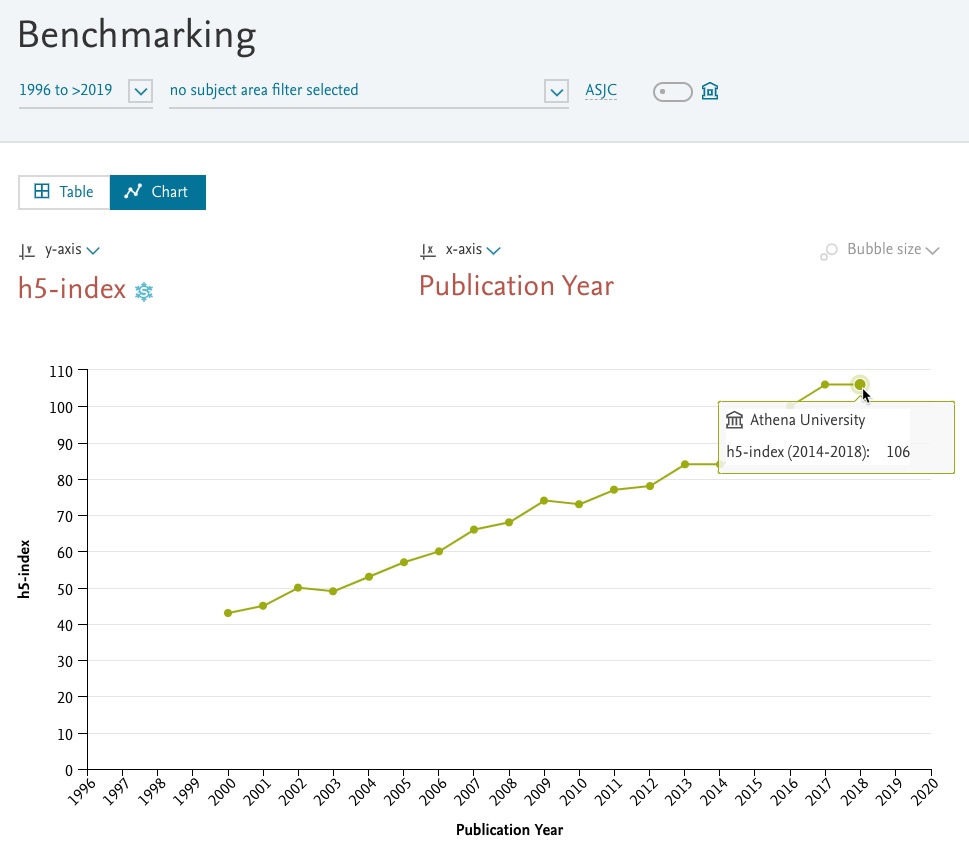
In Benchmarking, unlike other h-indices, the h5-indices are calculated using a 5 year time window and the chart plots the latest year from the range. For instance, the data point for 2019 is the h5-index range of 2015-2019.
If you have selected an incomplete year in your year range, or a year before 5 complete years of data are available (1996 – 1999), no metrics will be displayed for those years.
Did we answer your question?
Related answers
Recently viewed answers
Functionality disabled due to your cookie preferences