
The h-graph is one way of displaying and comparing the productivity and impact of published work of scholars. The h-index is the method used which was developed by J. E. Hirschopens in new tab/window.
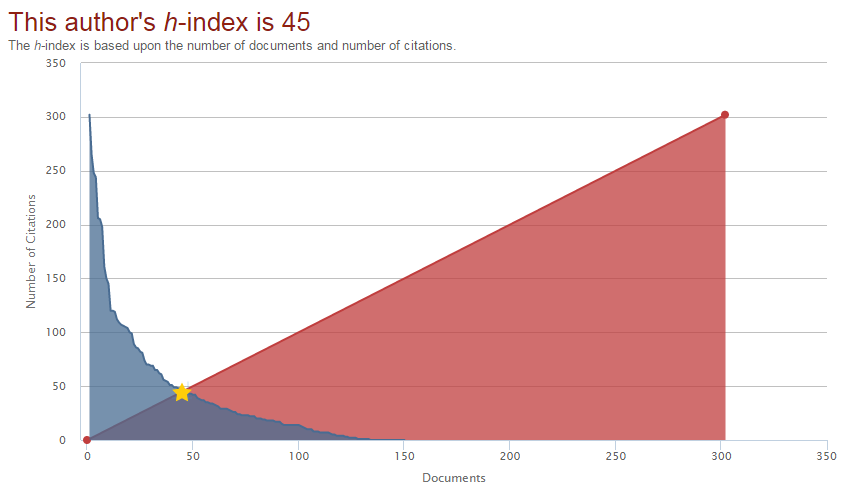
The h-index is based on the highest number of papers included that have had at least the same number of citations. The graph shows a 45 degree line which models a 1:1 relationship between publishing articles and being cited. An author’s publishing history is mapped out on this graph, beginning with their publication with the highest citations to the lowest.
Select a section below to find out more about the h-index, how it works, and how corrections can be made:
The h-index is available in both a graph and a document list from the Analyze Author Output page. The graph displays information as an interactive graph for authors, multiple authors, or a group of selected documents.
The graph includes two lines: h-index and the 45 degree line:
- The h-index represents the number citations received for each of the articles in descending order.
- The 45 degree line represents the number of citations equal to the number of articles.
Where the author’s line meets the 45 degree line marks the h-index, and it can be used to compare different scholars
For more information:
Click on a topic below to see steps on creating an h-graph for:
You can create an h-index for a single author and any matched authors.
- Run an author search. A list of author search results opens.
- From the author results list, click the name of the author you want to evaluate. The author details page opens.
- From the author details page, click ‘View h-graph’. The Analyze Author Output page opens with the h-index tab selected.
- You can interact with the results:
- Change the date range
- Select ‘Exclude self citations’
- Select ‘Exclude citations from books’
- Or zoom in on a segment of the graph by left-clicking and dragging across the section you are interested in.
You can create an h-index for more than one author from Author search results. The h-index includes documents written by all selected authors.
- Run an author search. A list of author search results opens.
- From the results list, select checkboxes for authors you want to evaluate.
- Click ‘View citation overview’. The Citation overview for the selected authors opens.
- From the Citation overview page, click ‘View h-graph’. The Analyze Author Output page opens with the h-index tab selected, depicting the selected authors’ h-index.
Selected documents from a document results list
You can create an h-index for selected documents from most Scopus results lists.
- Run a document search. A list of documents search results opens.
- From the document search results, select the documents you want to evaluate.
- From the document search results list, click ‘View citation overview’. The Citation overview for the selected documents opens.
- From the Citation overview page, click ‘View h-graph’. The h-graph for the selected documents opens.
Your h-index relies on two key pieces of information for its accuracy:
- The documents you published must be linked to your profile
- Citations of your documents must be linked in Scopus
We get it right almost all the time; however, there are times when corrections need to be made, and we are happy to help you with those.
How
Find out which of these categories best fits your situation:
- Missing documents - Can I find the document on Scopus?
- Missing citations - Can I find the citing / cited documents on Scopus?
Scopus is currently updating pre-1996 cited references going back to 1970. The h-index might increase over time.
For more information, see the Scopus content coverage policy.
Did we answer your question?
Related answers
Recently viewed answers
Functionality disabled due to your cookie preferences