View by category
EmBiology Release Notes
Last updated on March 03, 2026
We’re excited to introduce powerful new export features designed to enhance your data analysis and sharing experience:
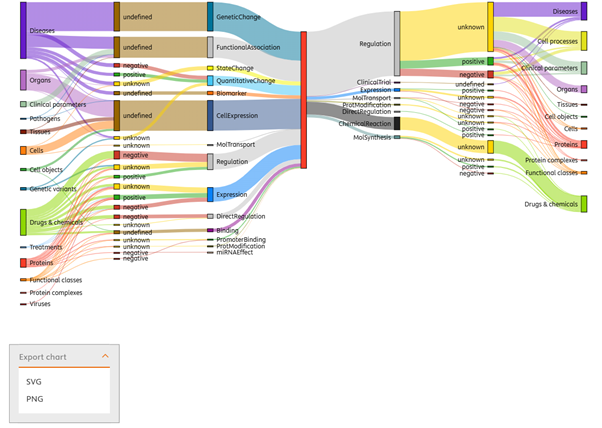
Sankey Diagram Export
Visualize complex data flows and relationships with ease with the Sankey diagram.
Now, you can export Sankey diagrams directly from the results page, in SVG or PNG formats.
This will enable you to communicate insights more effectively in reports and presentations or simply save your results for later.
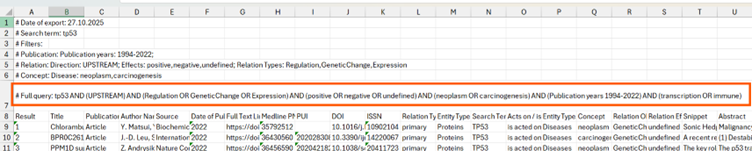
Full Query Export in Excel
Export your entire search results, including the full query and applied filters, into a neatly formatted Excel file.
This gives you the flexibility to perform offline analyses, create custom reports, or seamlessly integrate data into your workflows.
Visualize Relationships Like Never Before!
The new Insights Heatmap transforms complex biological data into a clear, visual overview of how proteins, drugs, or diseases are connected through supporting research. It helps you quickly identify the strongest links and spot gaps in the literature, saving you time and guiding your next steps with confidence. This powerful visualization puts the full picture at your fingertips, making it easier to uncover insights that drive your research forward.
What’s New?
Dynamic Visual Overview
- View relationships between your uploaded list of proteins and key concepts of interest (drugs, diseases, cell processes, biomarkers, etc.) in a new heatmap layout.
- Each cell shows the exact number of supporting references, giving you a clear measure of relationship strength.
- Use the effect symbols in each cell to get a quick overview of the relationships (i.e. positive, negative, unknows or undefined).
- Click on cells to open a side panel with detailed info about that relationship, including:
- Protein summary
- Total articles supporting the link
- A link to view all related articles in a new tab
- Cells with no documented links display as “N/A” but still provide the protein summary on the side panel.
Customizable & Interactive
- Easily switch between colour schemes (including accessibility-friendly options) via a dropdown menu.
- The legend below the heatmap explains the colour scale, updating dynamically based on your data.
- Toggle the “Show reference counts” button to display or hide the exact number of references in each cell.
- The x-axis displays up to 25 concepts, and the y-axis shows up to 200 proteins; both axes are sticky for easy navigation.
- The heatmap is fully scrollable horizontally and vertically, allowing you to explore extensive data.
Why You’ll Love It
This new heatmap offers a quick, visual snapshot of complex biological relationships, enabling faster insights. Whether you’re exploring protein interactions or drug targets, this feature helps you see the bigger picture at a glance, supported by detailed, reference-backed data.
For detailed information, view the EmBiology Insights — Step-by-Step Guide
The NEW Insights filters allows users to precisely narrow their search by publication year, supporting references, or relationship types.
For detailed information, view the EmBiology Insights guide.
EmBiology filters have been updated to include a search bar to more easily find filters. Entering a text search returns any filter terms that include the searched text, allowing multiple filters to be applied at once. Additionally, filters can be ordered by number of supporting references and alphanumerically for easy browsing through terms.
For detailed information, view the EmBiology new filter text search user guide.
The addition of a free text search to the main search results page enables users to filter results by specific terms or phrases. The results list will be filtered to those that include the keyword(s) in the title, relationship description or text snippet.
For detailed information, view the EmBiology free text search guide.
EmBiology Insights helps you quickly find connections to diseases or processes of interest, understand pathways, see commonalities and prioritise a list of up to 200 genes/proteins. The February 2024 release adds additional filtering capabilities to further narrow down your list of genes/proteins before finding connections - for example, to search proteins involved in a particular cell function, or that are expressed in a specific cell type or primary cell location.
For detailed information, view the EmBiology Insights Guide.(Opens in a new tab or window)
Did we answer your question?
Recently viewed answers
Functionality disabled due to your cookie preferences